
 ?Mathematical formulae have been encoded as MathML and are displayed in this HTML version using MathJax in order to improve their display. Uncheck the box to turn MathJax off. This feature requires Javascript. Click on a formula to zoom.
Abstract
Habitat loss and harvesting of non-timber forest products (NTFPs) significantly affect the population dynamics. In this paper, we propose a general mathematical modelling approach incorporating the impact of habitat size reduction and non-lethal harvesting of NTFP on population dynamics. The model framework integrates experimental data of Pentadesma butyracea in Benin. This framework allows us to determine the rational non-lethal harvesting level and habitat size to ensure the stability of the plant ecosystem, and to study the impacts of distinct levels of humidity. We suggest non-lethal harvesting policies that maximize the economic benefit for local populations.
1. Introduction
Forest fragmentation and habitat loss are amongst the most common causes of species extinctions and are two of the main threats to species sustainability. Moreover, there is an empirical evidence that habitat loss and isolation have long lasting effects on population evolution and community assembly [Citation9, Citation10, Citation15, Citation17, Citation30, Citation35–37, Citation44, Citation53, Citation55]. As a consequence, research on population dynamics in fragmented and reduced landscapes is increasing. It includes research work on comparing the dynamics of a population in a continuous forest with the dynamics of the same population on fragments with distinct sizes [Citation9, Citation34]. The modelling setting to study habitat fragmentation and habitat reduction uses ordinary differential equations (ODEs) to describe meta-populations in patches, network models, models based on reaction diffusion equations, and discrete models (cellular automata or individual-based models). An increasing number of studies in the field employs integral projection models [Citation43] and linear matrix models [Citation11, Citation13, Citation39].
Harvesting non-timber forest products (NTFPs) is another stress that significantly affects population dynamics [Citation20, Citation22–24, Citation45, Citation49, Citation50, Citation54]. The NTFPs are any forestry related products other than timber (e.g. [Citation2, Citation4] and references therein). Their use is widespread globally. People from a wide range of socio-economic, geographical and cultural background harvest NTFPs for household subsistence, indigenous medicine, healing, raw materials for large companies and micro-enterprises, and other purposes [Citation2, Citation4, Citation33, Citation41].
The ecological harm due to NTFPs is less than the harm caused by timber extraction, though excessive non-lethal harvesting can still influence the regeneration and sustainability of these resources [Citation46]. Three decades of investigation on the ecological effect of NTFP harvesting has shown that its negative impacts are evident mostly from harvesting vital organs such as root, bark or leaves [Citation22, Citation45, Citation49]. This study also shows that harvesting of reproductive organs, such as fruits or flowers, often has limited effects. Indeed, as shown in [Citation49], more than of fruits can be harvested without any effects on population dynamics. However, recent work on NTFP harvesting in a gallery forest in Benin indicates that collection of fruits greater than 25% can lead to a decrease in seedling production and a significant increase of the frequency of a clonal reproduction [Citation19]. This result may have implications for the definition of sustainable non-lethal harvesting in clonal trees/bushes/plants [Citation19].
Non-lethal harvesting often takes place in a fragmented landscape or in an ecosystem with reduced habitat. Most forests will be fragmented and reduced by construction of roads and deforestation for agricultural purpose. Therefore, it is expected that the fragmentation and decreasing of forests' size will occur even more frequently (e.g. [Citation4]). Thus, studying the simultaneous impact of habitat reduction or fragmentation and NTFP collection on population dynamics is becoming more critical. However, research on the population response to habitat loss and NTFP harvesting has evolved independently with a few recent works addressing the combined effect of these two stresses on population dynamics. For example, Kouagou et al. [Citation31] investigates interaction effects of fruit harvest, fire, gallery forest size and distance to streambeds on density, recruitment, survival and growth of Pentadesma butyracea offspring in dry and moist ecological conditions. This study is based on generalized linear mixed effect models [Citation7, Citation13]. Nonetheless, understanding the synergistic ecological impacts of harvesting and habitat loss on population dynamics is still limited. Thus, there is the need to continue experimental and theoretical studies as well as mathematical model development and their theoretical analysis to systematically tackle the following topics:
study the effects of the feedback impact of non-lethal harvesting and fragmentation or habitat reduction on the population dynamics of plants;
identify the rational non-lethal harvesting level and habitat area to ensure that the plant population does not decrease;
explore how humidity and rainfall affect issues mentioned in (a) and (b);
investigate optimal NTFP harvesting policies that guarantee, not only the economic benefit for local populations, but also the survival of the plant system population based on the habitat area.
The development of models that aid the investigation of such matters is of great importance for practical conservation and management purposes, which motivates this work. In this paper, we propose a general mathematical modelling approach to address the aspects listed in items (a)–(d). Experimental data are integrated to parametrize the model. To this end, we use an illustrative case of NTFP harvesting of fruits from Pentadesma butyracea forest gallery in Benin. The tree population in the gallery is subject to different levels of habitat reduction distributed over two distinct climatic regions.
Pentadesma butyracea (Clusiaceae) provides distinct NTFPs [Citation4, Citation5, Citation14, Citation31, Citation47], in particular, fruit almonds that are transformed into butter for cooking (e.g. [Citation4, Citation5, Citation14, Citation19, Citation31, Citation47] and references therein), used in cosmetics [Citation14, Citation19, Citation33, Citation48] or pharmaceutical industry [Citation19, Citation21]. Due to overexploitation and habitat loss Pentadesma is one of the 10 most threatened food tree species in Benin and Togo [Citation4, Citation14, Citation19]. Studies indicate that the next human generation will have only half of the resources provided by Pentadesma butyracea today [Citation14]. Thus, this species is listed amongst the 62 wild food plant species south of the Sahara (Africa) recommended by the Forest Genetic Resources organisation for conservation actions [Citation14]. Therefore, it is critical not only to study how the dynamics of the population is influenced by co-existent stresses but also to develop tools to assist designing sustainable exploitation of the Pentadesma's NTFP when the habitat is prone to size reduction.
Although there is a substantial work studying the biological characteristic and marketing value of this tree species ([Citation4, Citation6, Citation31, Citation32], and references therein), mathematical modelling is in its infant stages. It involves linear mixed effect models and statistical tools to analyze data. Our mathematical model can be applied to any trees/shrubs/plants. Hence for the rest of this paper we make reference to its application to trees.
The new features of our study are:
The suggested ODE model incorporates the dependence of the population growth rate on the reduction of habitat size (including fragmentation) and non-lethal harvesting rate that allows analysis of the dynamics of a plant population in response to two simultaneous stresses, namely, habitat size reduction and NTFP harvesting.
The model integrates a nonlinear dependence of the harvesting rate on the tree density that is materialized via a logistic type growth rate of a tree population.
The ODE model is a tool to study the long- and short-term impact of habitat reduction and non-lethal harvesting on tree viability. The importance of taking into consideration these two dynamic perspectives, while developing realistic managements policies, was demonstrated by Gaoue [Citation18]. The long- and short-term dynamical behaviour studied in [Citation18] uses two modelling strategies, while in this paper we use only one model. Then, we study the long-term dynamics using dynamical system techniques and investigate the short-term behaviour by performing numerical simulations.
Non-lethal harvesting policies of fruits are developed aiming to identify those that maximize the economic benefit (net profit).
The model is quite general in the sense that it can be parametrized with the data from any ecological system that satisfies the underlying assumptions. Furthermore, the growth rate function mentioned in (i) can be adapted to distinct tree species. To illustrate an application of our model framework, we integrate experimental data of harvesting fruits from Pentadesma butyracea forest gallery in Benin. This ecosystem has distinct levels of habitat reduction across two regions with distinct climatic profiles provided in [Citation19].
This paper is organized as follows. Section 2 presents the model and its assumptions. In Section 3, we describe the data set used to parametrize the model. In Section 4, the parametrization of the model is performed with data sets from a moist and a dry region of Benin. In Section 5, the dynamics of the Pentadesma's tree population are studied and results on the survival of the Pentadesma tree populations are presented. In Section 6, an optimal control problem is developed to determine the optimal harvesting policy of fruits from Pentadesma butyracea tree that maximizes net profit. In Section 7, we discuss the results obtained in this paper.
2. Mathematical model
In this section, we build a general mathematical model integrating two stresses, namely, non-lethal harvesting and habitat reduction. We assume that the NTFPs harvested are fruits produced by the trees. In Section 4, we incorporate into the model experimental data collected from Pentadesma butyracea forest gallery sites located in Benin.
In our model development, we assume that the population net growth rate (recruitment rate minus death rate) is affected simultaneously by the reduction of habitat size and by the non-lethal harvesting rate.
We consider a nonlinear dependence of the harvesting rate on the plant density. There are several works pointing out the importance of taking into account this dependence when studying the effect of harvesting on the tree population viability (e.g. [Citation27]). In our ODE model, the nonlinear dependence is described by a logistic term for the growth rate of the tree population.
The experimental data were collected on sites longitudinal to neighbouring rivers and streams. The widths of the sites, measured transversally to the riverbeds and streambeds, were recorded and used as a surrogate for habitat reduction.
The rectangular area, based on the data collection, is given in square metres. That is, satisfying
where w and l are the width and length of the site (or habitat), respectively, and are expressed in metres.
Note that, if then the area is also zero for any value of l. Thus, w can be used as a reliable measure of the site's area reduction (that is, habitat reduction) and habitat fragmentation. Observe that habitat reduction occurs when the width w decreases with l>0 fixed, while fragmentation is observed when locally w = 0 within the region of a certain l>0 fixed. For this reason, we fix the length l and introduce the ODE model describing the change of the number of trees per unit of the habitat's width, which we denote by
Thus, the variable
represents a measure of the density of the trees in the habitat of a given width, w. Hence, throughout the paper, we refer to
as density of the tree population.
The temporal dynamics of the variable are modelled by a single ODE with a logistic growth rate. Compared to the Malthus equation, the suggested logistic equation includes an extra mortality term due to the intra-species competition for resource and has the form
with a>0 [Citation40]. The parameter β is the difference between the natural growth and death rates that will be described later in this section. Under the assumption that the β is positive, the constant a can be written as
In this case, K can be taken as the maximum number of individuals supported by a given environment. That is, K is the density at which fertility and mortality rates, including the mortality due to competition for resources, balance each other. If β is negative, then a, which is positive, can be written as
and
If
then there is still a mortality due to competition for resources and the ODE becomes
Adding harvesting changes the growth rate. It is an open question whether it also changes the competition death rate. In this paper, we assume that it does. With this considerations, the ODE model reads
(1)
(1) where a>0 is a parameter of the system;
is the percentage of Pentadesma's fruits harvested per year; and
is the width of the habitat. K is the carrying capacity of the system. The dependence of the carrying capacity on the fruit harvesting could be modelled if data were available to parametrize a function describing this dependence. However, that is not the case. Additionally, since the model we are proposing constitutes one of the very few modelling framework addressing the issue of non-lethal harvesting, we try to keep the model simple. Thus, we assume that the carrying capacity is constant within each of the sites where the data were collected but vary from a site to a site within both climatic regions where they are located.
In Section 4, we parametrize the model (Equation1(1)
(1) ) with the data from Benin, which is described in detail in Section 3. The data collection was done in sites that are located in two distinct geographic regions, Sudanian and Sudano-Guinean regions. Additionally, these regions have distinct climatic profiles, dry and moist, respectively [Citation19, Citation51]. For this reason, we separately parametrize the function
in the model (Equation1
(1)
(1) ) with one data set from a dry region and another data set from a moist region, leading to two distinct parametrized functions. To simplify our notation and to distinguish, the two geographic and climatic regions, we assign the subscripts j = 1, 2 to the dry and moist regions, respectively.
Following this notation, the net growth rate of the density of Pentadesma (1/year) is defined as
(2)
(2) where
is the recruitment rate of new trees into the system (1/year) in the region
The form of the function
and its parametrization, via the two data sets, are given in Section 4. The recruitment rate function is hypothesized to depend on the fruit harvesting rate α and the habitat width w. The underlying hypothesis is that the removal of fruits from the site will reduce the number of seeds available for replenishing the ecosystem and the reduction of habitat size lead to a lower seed set. We note that only natural reproduction occurs in both habitats, that is, the recruitment is through new trees sprouting in the habitat.
The function is the total natural death rate of the population in the climatic region j. It is defined as the limit (as
goes to 0) of the total number of deaths per total number of trees over a period of length
divided by
[Citation40]. It satisfies
Given the limited number of data points, we use the arbitrary constraint
The death rate is hypothesized to depend on the habitat width and to be independent of the harvesting rate because the removal of fruits do not cause additional mortality to the tree. However, the reduction of habitat size may increase the mortality rate. The function will be discussed in detail in Section 4.
Combining Equations (Equation1(1)
(1) ) and (Equation2
(2)
(2) ) yields:
(3)
(3) for a given region
The description of the parameters of the model (Equation3
(3)
(3) ) is given in Table and, in contrast to model (Equation1
(1)
(1) ), emphasizes the influence of distinct humidity levels in each region (moist and dry habitat) on the dynamics of the tree population.
Table 1. Description of the variables and parameters of the Pentadesma butyracea model (Equation3(3)
(3) ).
3. Pentadesma data description
The data set used in our study is a subset of the data set published in [Citation19]. It contains data pertained to the years of 2016 and 2017 and census of 12 populations of Pentadesma butyracea equally distributed between two climatic regions (six sites in Sudanian at –
and six sites in Sudano-Guinean at
–
) in Benin. The average annual rainfall varies between 900 and 1100 mm in the Sudanian region, which we will refer to as a dry region and denote it with the subscript j = 1, and between 1000 and 1200 mm in the Sudano-Guinean region, which we will refer to as a moist region and use the subscript j = 2 to denote it. These two regions are known to be geographically different and have distinct climatic and vegetation characteristics [Citation19, Citation51]. Therefore, we consider two distinct data sets instead of aggregating them into a single set. In each of the 12 habitats, three rectangular plots of 500 m
were established to record the two-year (2016 and 2017) average of the harvesting rate and the tree's population density. The number of new trees into the system, called offsprings, was recorded in 2016 and 2017. It includes the total number of incoming trees via seeds and clones. The number of dead trees per total population per year (that is, the mortality rate of the tree population) in 2016 and 2017 is provided for two Pentadesma butyracea classes: offspring and adult trees. Additionally, for each population, the width w of the gallery forest measured perpendicularly to the riverbeds and streambeds was recorded. The distinct widths represent the distinct Pentadesma butyracea habitat size. The area (
) is A = 500 m
A summary of the data sets is given in Appendix 1, Tables –. More details on methods of data collection and region description are provided in [Citation19].
We note that the data set we worked with is very small and there is a high variability in data points. Additionally, the data do not cover exhaustively the range of possible non-lethal harvesting rates (range ). For example, the data in the dry region do not include harvesting rates between zero and
and, in both regions, the recorded maximum harvesting rate was approximately
Concerning the width of the site, the maximum width is 34.5 m in the dry region, while in the moist region the width measurement values are in the range 27–85 m.
4. Model parametrization
In this section, we use data on the Pentadesma butyracea population in the climatic regions of Benin described in Section 3. We parametrize the function describing the dependence of recruitment rate of Pentadesma on the width of the site and harvesting level. We also parametrize the function
expressing the dependence of mortality on the width of the fragment. The net growth rate
as a function of the width of the site and the harvesting rate is obtained by substituting the parametrized functions
and
into Equation (Equation2
(2)
(2) ).
The functions and
are fitted to the experimental data using the function cftool in MATLAB [Citation38]. The best-fit curve is assumed to minimize the sum of squared residuals. Since the functions are nonlinear, we use the standard error of the regression to assess the goodness of fit.
4.1. Recruitment rate of tree fitting, 
The form of the recruitment rate function for each region j = 1, 2 is not known. Additionally, the experimental data points vary significantly. Thus, we propose a function that captures the pattern observed in the data, is continuous and differentiable on
and for
satisfies the following biologically reasonable conditions:
(4)
(4)
(5)
(5)
(6)
(6)
(7)
(7)
(8)
(8)
(9)
(9)
(10)
(10) where
is the natural recruitment rate of Pentadesma trees. This parameter is the recruitment rate when there is neither habitat reduction/fragmentation nor harvesting. One possible function
that satisfies the requirements (Equation4
(4)
(4) )–(Equation10
(10)
(10) ) is given in Equation (Equation11
(11)
(11) ). We would like to emphasize that this choice is not unique.
(11)
(11) The parameters
and
are the harvesting and width decay constants, respectively. Their units are % per year and metres, respectively. The parameter
is a natural recruitment constant express in
Applying the condition (Equation5
(5)
(5) ) to Equation (Equation11
(11)
(11) ) yields the following expression for the parameter
:
(12)
(12) The quantities
are model parameters described in Table and fitted to data. The parameter
is computed by substituting the values of
from the fitting into Equation (Equation12
(12)
(12) ). Furthermore, the form of the functions (Equation11
(11)
(11) ) and (Equation12
(12)
(12) ) are the same for dry and moist regions but the parameters values
vary. However, we remove the subscript j for simplicity of notation. The function in Equation (Equation11
(11)
(11) ) is fitted separately with the data available for dry region (j = 1) and moist region (j = 2). The fitting results are summarized in Table and Figure .
Figure 1. The function defined as in (Equation11
(11)
(11) ) with the width expressed in m and
in year
The surface represents the fitted function. The star marker represents the data points. (a) Dry region (j = 1); and (b) Moist region (j = 2).
![Figure 1. The function Rj(w,α) defined as in (Equation11(11) Rj(w,α)=Ro[1−exp(−(100−α)/αo)][1−exp(−w/wo)].(11) ) with the width expressed in m and Rj,α in year−1. The surface represents the fitted function. The star marker represents the data points. (a) Dry region (j = 1); and (b) Moist region (j = 2).](/cms/asset/ff542df3-302c-4827-bde9-91e1aeea4afd/tjbd_a_2071489_f0001_oc.jpg)
Table 2. The values of the parameters and the Fit Standard Error, RMSE, obtained when the fitting of the function in Equation (Equation11
(11)
(11) ) is performed for moist and dry regions. The values of
were computed using formula (Equation12
(12)
(12) ) and the estimated values of the parameters
Summary of the results:
As discussed in Section 3, the available data set is very small with high variability in the data points. Furthermore, the experimental points do not cover the feasible non-lethal harvesting rates (range ). With these constrains, the fits that we present are the best we could obtain. The Fit Standard Error (RMSE) associated to each fit is less than
We hope that the biological implications we discuss in this Section will motivate future studies with larger data sets.
From the results presented in Table , we observe that the relative decrease in the value of the natural recruitment rate of Pentadesma trees () from the dry region to the moist region is approximately
This suggests that, in the absence of fragmentation and non-lethal harvesting, the recruitment rate of trees is much higher in the dry region than in the moist region of Benin. Furthermore, results shown in Figure suggest that, in the moist region, either increasing the harvesting rate or decreasing the site width affects the recruitment rate of Pentadesma for very large values of α and very small values of width. On the other hand, in the dry regions, the increase of the non-lethal harvesting rate in the range zero to
leads to a decrease in the recruitment rate of Pentadesma. In particular, our results in Table and in Figure indicate that for a fixed width the decrease of the recruitment rate with the increase of the harvesting rate is more pronounced in the dry region (harvesting decay constant
is approximately 77) than in the moist region (
is approximately 0.25). Thus, the results suggest that the increase of a non-lethal harvesting rate has a more detrimental impact on the recruitment rate of Pentadesma trees in the dry region than in the moist region. In contrast, the impact of a habitat size reduction on the tree's recruitment rate in both regions is almost negligible as indicated by the low value of the estimated values of the constant width decay
(
m in the dry region and
m in the moist region).
4.2. Mortality rate fitting,
In this section, we parametrize the mortality rate function which is expressed in units of 1/year. In order to achieve this goal, we first introduce the general form of the function
We assume the mortality of the Pentadesma tree due to fruit removal to be negligible and to be dependent only on the site width for a fixed dry or moist region.
As described in Section 3, the data on mortality rates of Pentadesma trees include the mortality in each site within each of the two climatic regions in 2016 and 2027. Furthermore, the experimental data are divided into mortality rates of offsprings and of adult trees. Since our model is not structured by age, for each climatic region j = 1, 2 and each year, we fix the site and consider the total mortality rate as the sum of the mortality rate of offsprings and adult trees. The total mortality rate for each region j = 1, 2 is the limit (as goes to 0) of the total number of deaths per total number of trees over a period of length
divided by
[Citation40]. We assume that
satisfies the following properties:
When the site width is close to zero, the death rate approaches 1 to reflect the fact that the death rate is very high when the width of the patch is very small. The constrain
When the width is very large the mortality levels approach a certain non-zero value.
One possible function that satisfies these conditions is
(13)
(13) where
represents the mortality decay constant in a given region j. The parameter
is the natural mortality rate of the trees in region j in the site that is not fragmented (i.e. in a continuous forest). The values of the parameters
are estimated via data integration and a summary of the results is given in Table and in Figure . The fit was performed using cftool built in function in MATLAB [Citation38]. The best-fit curve is the one that minimizes the sum of the squares of the residuals. The goodness of fit is measured by the standard error of the regression. In Table , the values of the RMSE are provided for each fit. In the data set, there is no information on the death rate of Pentadesma trees in a not fragmented forest. Thus, for each region j, we fit the data to Equation (Equation13
(13)
(13) ) twice. In one fit we estimate the parameters
and
In the other fit we estimate only parameter
and the value of each
is computed by averaging the mortality values of two years (2016 and 2017) in the site with the largest width within a given region j (see Appendix 1). The former fit exhibits a slightly higher RMSE than the latter. Additionally, we fit the data to a concave downward saturation type function. However, the values of the RMSEs obtained were also slightly higher than the RMSEs obtained when fitting function (Equation13
(13)
(13) ). Thus, Table presents the fitting obtained with this last function and the estimates of the parameters
Figure 2. Graphs of in the dry region (left panel) and the moist region (right panel). The solid black line depicts the curve of the total mortality rate of the tree population fitted using Equation (Equation13
(13)
(13) ). The corresponding data values are indicated with a circle symbol. The blue circle shown in the right panel indicates an outlier. The width is expressed in m and μ is in year
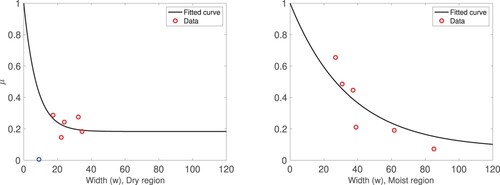
Table 3. Values of the parameter in metres, when the functions
in Equations (Equation13
(13)
(13) ) is fitted to data. The subscripts j = 1, 2 denote dry and moist region, respectively. The subscripts j in the different quantities were dropped to make the table easier to read.
Summary of the results:
Let us note that our data set has several limitations as pointed out in Section 3. Due to the high variability observed in the data, we perform the fit with the average of the total mortality rate of the trees over 2016 and 2017.
The mortality data from the dry region when the experimental point corresponding to the site with the lowest width (i.e. w = 9 m) is included, suggest that the mortality function μ is an increasing linear function of the habitat width in the range m (see Figure , left panel). Furthermore, no information on mortality is provided for higher values of habitat width. If an increasing linear relation is assumed, then
as
Additionally, when the point with w = 9 m is included, the data suggest that
as
However, assuming that
satisfies such properties would not be ecologically realistic. We expect that as the width of the habitat goes to zero, the mortality rate tends to its maximum value, while as the width of the habitat goes to ∞, the mortality rate approaches a positive finite value. These observations strongly suggest that the mortality measured in the dry site with w = 9 m is an outlier. In Table and Figure , we present the obtained fitting results excluding this point. However, we keep the point in the graph to be truthful to the data collected. We consider two types of mortality rate functions, an exponential decay type function similarly to the one considered for the moist region (Figure , right panel) and a concave upward saturation type function (not included in this paper). For each of these functions, the goodness of the fit was better excluding the outlier. Excluding the outlier, the fit with the concave upward saturation type function was slightly worse than the one obtained with the exponential decay function.
Table shows that the total natural death rate of Pentadesma is higher in the dry region than in the moist regions. Specifically, in the dry region (j = 1) we observe that while
in the moist region (j = 2). Furthermore, our results suggest that the habitat reduction (via the decreasing in the site width, measured transversally from the riverbeds and streambeds to the edge of the gallery forest) has a more severe impact on the Pentadesma mortality rate in the moist region than in the dry region. This can be observed in the graphs shown in Figure . In the dry region, the mortality rate of the trees is approximately equal to the corresponding natural death rate for the widths greater than
m. However, in the moist region, the mortality rate of the tree population keeps decreasing for values of the width beyond 100 m. The decrease in the habitat width below
m leads to a faster increment in the mortality rate.
The presented conclusions need to be further investigated with larger data sets.
4.3. Net growth rate,
The net growth rate of the Pentadesma population, in a given climatic region is defined by Equation (Equation2
(2)
(2) ) as:
where
is the function given in Equation (Equation11
(11)
(11) ) with the estimated parameters presented in Table . The total mortality of trees as a function of area in either dry or moist region,
is described in Section 4.2 with parameters given in Table . The parametrized net growth rate
is depicted in Figure .
Figure 3. The graphs of the net growth rate of the tree population defined in (Equation2
(2)
(2) ). The width is expressed in m, and
in year
(left) Dry region,
(right) Moist region,
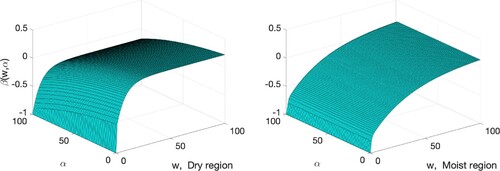
Summary of the results: The habitat reduction occurs through the reduction of site's width measured perpendicularly from the riverbeds and streambeds to the edge of the Pentadesma gallery. Given a small data set with high variability of experimental values, Figure suggests the following impact on the net growth rate of trees.
The impact of habitat reduction: For a fixed harvesting rate, in the dry region the negative impact of habitat reduction on the net growth rate is only significant when the width of the site is close to zero. In contrast, in the moist region, there is a decrease in the net growth rate with habitat reduction across the width in the range
The impact of non-lethal harvesting rate: For a given habitat width in the moist region, increasing the harvesting rate does not impact significantly the net growth rate of the trees. However, in the dry region of Benin, as the harvesting rate of Pentadema's fruits increases, the net growth of the tree populations decreases. Given a fixed width of a site, the negative effects of an increasing harvesting rate on the Pentadema net growth in the moist region is negligible when compared to the negative impact of a similar action in the dry region.
5. Population dynamics and viability of Pentadesma
5.1. Tree population dynamics
In this paper, a viable population is a population for which the density have a nonnegative population net growth rate. Otherwise, the population state is referred to as unviable. The Proposition 5.1 summarizes the steady states of the model (Equation1(1)
(1) ) and gives conditions for the survival of a tree population. The proof is straightforward by standard dynamical systems theory.
Proposition 5.1
Consider the model given by (Equation1(1)
(1) ), with nonnegative parameters.
| (i) | If | ||||
| (ii) | If | ||||
| (iii) | If | ||||
From Proposition 5.1 and the assumption that the initial condition is positive () follows that the population is unviable if
The population is viable if
Let us note that from Proposition 5.1 (iii) follows that when the system stabilizes at
Hence, K can be thought as the maximum of tree population density supported by the system. That is, K is the carrying capacity of the system [Citation40]. In this paper, we assume that the value of K is constant within each of the site where the data were collected (see Section 2).
5.2. Effects of the rain fall levels on the viable habitat size and non-lethal harvesting rates
In this section, we identify the values of the habitat's width and non-lethal harvesting rate that can be implemented in each climatic region of Benin without impairing the viability of Pentadesma butyracea tree. Thus, we work with model (Equation3(3)
(3) ) with
given in Equation (Equation2
(2)
(2) ). For a fixed j, we denote by
the pair of values of the habitat width and harvesting rate that satisfies
Proposition 5.1 states that for a given non-lethal harvesting rate α, if the width of the habitat is equal or below the threshold
then
which indicates that the biomass density in the habitat is decreasing towards the equilibrium state
This implies that the viability of the trees is in jeopardy. If the width of the habitat is above the critical value
then the density of biomass stabilizes at the carrying capacity of the system K. Similarly, in a fixed site width w there is a critical value of harvesting level
above which the tree population density decreases towards the steady state
For each region type (dry or moist), the relation between the critical value of the habitat width and the critical harvesting rate
can be determined by solving the equation
The relationship between these two thresholds is depicted in Figure .
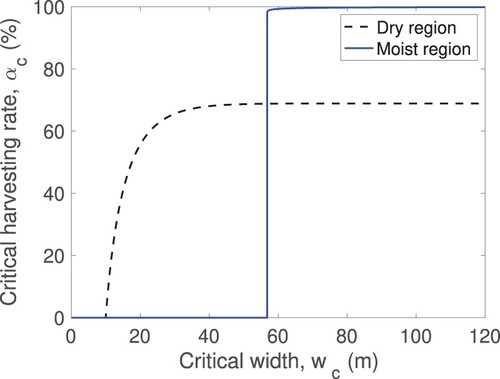
Figure 4. Critical harvesting rate as a function of habitat width
The dashed black line corresponds to
in the dry region while the solid blue line corresponds to
in the moist region. The quantity α is expressed in % per year and the width in metres.
In the two climatic regions of Benin considered in this paper, the width of each of the 12 sites (six sites in the dry region and six sites in the moist region) is known (see Appendix 1). Thus, the equation parametrized for each region as described in Section 4.3 together with the width specific for each site can be solved to determine the maximum harvesting rate
to be implemented in each habitat without any detrimental effect on the population survival. These values are provided in Table for illustrative scenarios in which we use the values of w measured at the time of the experimental data collection. For each site, similar simulations can be done with distinct values of a site's width in order to build if-then projections.
Table 4. Values of the critical harvesting rate for each habitat in the two climatic regions of Benin.
From management perspective, it is also relevant to determine the minimum width that supports the harvesting. These values are presented in Table when considering the harvesting rates in place in each of the habitats at the time of the experiments. However, the values of the α's can be varied to calculate the width thresholds that guarantee the viability of the trees.
Table 5. Values of the critical habitat width for each current non-lethal harvesting level observed in the two climatic regions of Benin.
Summary of the results
Results depicted in Figure based on the available experimental data indicate that in the moist regions of the Pentadesma gallery the critical level of non-lethal harvesting is high (α higher than %) for the habitat width greater than
m. Decreasing the habitat width below this value leads to a steep decrease in the non-lethal harvesting rate to zero. This sharp decrease suggested by our results most likely stems from the less optimal features of our data set. In contrast, in the dry regions of Benin, the maximum sustainable level of the non-lethal harvesting is
lower than the rate in the moist regions but this critical value is supported for much lower habitat width. In fact, a maximum non-lethal harvesting rate of
can be implemented in habitats with widths no smaller than
m. The decrease of the width from this value to
m leads to a fast decrease in the critical harvesting rate to zero. However, the observed decreasing rate is much slower that the one observed in the moist region. This pattern can also be seen in Tables and . Our results in Table suggest that some sites in the dry region of Benin have been over harvested. Specifically, in Tchoundekou, Peperkou and Kouba the harvesting level that has been implemented is not supported for any habitat size. Additionally, the results suggest that, with the current width of the Gouta, Guiguisso, Kpiti, Setou sites in the moist region, the best police is no harvesting.
5.3. Evolution of temporal dynamics of the Pentadesma model
The transient dynamics of model (Equation3(3)
(3) ) is governed by the closed form solution of the logistic ordinary differential equation (e.g. [Citation3]) of the form
where
is the Pentadesma population density (number of trees per width of the habitat) at time
That is, it represents the initial condition to model (Equation3
(3)
(3) ). To simplify the expression, we omit the dependence of
on
Numerical simulations of the model
For different habitats in the moist region distinguished by the different carrying capacities K and habitat width w, we consider three non-lethal harvesting rates: per year. These values were chosen based on study of the critical thresholds
for each habitat performed in Section 5.2. In each of the six habitats in the moist region, the evolution of the Pentadesma density over time is given in the upper panel of Figure . Similarly, temporal dynamic profile for each of the six habitats in the dry region are given in the lower panel of Figure . In the simulations, as in the assumption in Section 5.2, the value of the carrying capacity K is the experimental value of the density of the Pentadesma population in each of the 12 habitats. The initial density tree population is
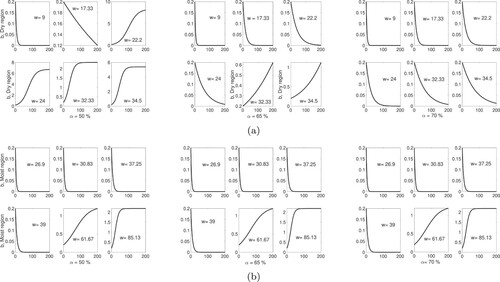
Figure 5. Number of Pentadesma trees per width, b, as a function of time (years) with The width w is expressed in m. The distinct values of the width considered in the simulations are shown in the figure and
per year. (a) Dry region of Benin. (b) Moist region of Benin.
Summary of the results
Illustrative simulations of the model's temporal dynamics are presented in Figure for non-lethal harvesting rates %. The results obtained in the moist region of Benin for sites with
m reveal that the long-term dynamical behaviour is extinction of the tree population with similar temporal evolution pattern. However, in sites with
m, the Pentadesma density reaches the site's carrying capacity but with distinct temporal evolution. The transient dynamics are faster in site with w = 85.13 m than the dynamics in the site with w = 61.67 m.
For a fix site's width in the dry region, the distinct harvesting rates % lead to a higher variability in the profile of the short- and long-term dynamics of the Pentadesma population density than the variability shown in the moist region. Furthermore, Figure shows that the non-lethal harvesting rate
guarantees that the tree population does not decrease in sites with widths
m within the moist regions but is not viable in any site in the dry region of the Pentadesma's forest gallery.
We note that the data include values of the density of the Pentadesma tree population observed in a single year in a given site. Therefore, it was not feasible to compare the time series obtained with the parametrized model with experimental data. Such comparison will be possible when a more complete Pentadesma tree population census is performed in the gallery forest of Benin.
6. Optimization of benefits
The Pentadesma butyracea tree has multiple uses. Its timber is used in construction and its fruits are used in cosmetic and pharmacy industry. This section aims to find the harvesting rate of fruits from Pentadesma tree that brings maximum economic benefits (net profit). The considered time interval is finite and for illustrative purpose we consider one harvesting season, which typically lasts about three months. The analysis can be extended to considering several harvesting seasons (years) with different harvesting costs and varying harvesting rates. This extension will make the model more realistic but significantly increase its investigation. This section compliments other sections of the paper and presents some application and relevance of our study.
The seasonal harvesting of Pentadesma's fruits consists of collecting fruits that have fallen to the ground. Then seeds are extracted from the fruits, dried, processed and sold a few months later. If there are no harvesting cost or no loss from theft or other causes, then it does not matter if fruits are collected as soon as they fall or after all fruits have fallen. Here we will study a more realistic case in presence of harvesting costs and loss from theft. We will work with days as our time unit.
6.1. Modelling the rate of change of the number of mature fruits on the ground
We implement the following assumptions based on practical observations and knowledge in the field. On the average, a Pentadesma tree has mature fruits for 90 days, and new fruits mature during 15 days (see [Citation14] for other details). The number of fruits at the 15th day is the maximum number of mature fruits, It is natural to assume that mature fruits do not fall from the tree in the next 60 days. Then the mature fruits drop to the ground at a rate proportional to the number of fruits left, according to a Malthusian population model [Citation3].
The number of fruits produced by a given tree is between 2 and 521 with the majority of trees producing between 2 and 200 fruits. The average number of fruits produced per tree is 100 [Citation14]. This number changes from year to year. We will take to be a typical value though we will also do some simulations for
400, 200, 150 and 50 to show the effect of the number of fruits produced by a tree on non-lethal harvesting rate that maximizes the economical benefit.
Since only harvesting from the ground occurs, we consider the time period after which the fruits have fallen to the ground, that is, from day 75 onward. For simplicity, t = 0 corresponds to the time point when the first fruit falls to the ground and T is the end of a harvesting period. To obtain an equation describing the number of fruits that fall from a single tree, we consider a time period . Let
be the total number of fruits on the ground at time t. Then
(14)
(14) The description of the variables involved in Equation (Equation14
(14)
(14) ) are given in Table . The assumption is that
and these quantities are such that
is non-negative.
is given in terms of the dropping rate per unit time,
, that is,
(15)
(15) We assume the fallen fruits are harvested at a rate
per unit time:
(16)
(16) Finally, the amount of fruits stolen is given by
(17)
(17) The three rates (Equation15
(15)
(15) )–(Equation17
(17)
(17) ) may also be functions of the number of fruits N, but for notational simplicity we will not write that dependence explicitly. Using Equation (Equation14
(14)
(14) ) written in terms of the rates (Equation15
(15)
(15) )–(Equation17
(17)
(17) ) and taking the limit as
goes to 0 we obtain the following ODE:
(18)
(18) While it is possible that
is not satisfied by the solution of this ODE, this condition can be imposed as a part of the optimal control problem. Assuming that the fruits fall from the tree at a constant rate, the number of fruits
that are left on the tree is described by the following ODE:
(19)
(19) where B>0 is a constant of proportionality describing the rate at which fruits fall. The closed form solution to Equation (Equation19
(19)
(19) ) is
. Therefore,
. We will assume that the number of fruits lost to theft or other causes is proportional to the number of fruits on the ground. So
. Here
represents the rate at which the fruits are lost or stolen. With these rates the ODE (Equation18
(18)
(18) ) takes the form
(20)
(20) subject to the initial conditions
(21)
(21)
Table 6. Description of functions in Equation (Equation14(14)
(14) ).
6.2. Optimal control problem
The price, P, per litre of Pentadesma oil in West Africa varies from 1.7 to 7 euros depending on the region and time [Citation33]. The units of P are any money units such as euros or dollars.
We consider that the cost of fruit harvesting is proportional to the harvesting rate squared and inversely proportional to the number of fruits left on the ground plus a constant. The first part is a common assumption that the cost of production depends on the square of a production rate [Citation25, Citation28, Citation29], and the second one models the fact that when there are few fruits left on the ground then the fruits are more disperse, and it is harder to find them. It is natural to assume that it is about twice as expensive to collect fruits when there are few of them left.
So the optimal control problem (OCP) to investigate the sustainable harvesting rate that maximizes the net benefit of the non-lethal harvesting is:
(22)
(22) subject to the constraint (Equation20
(20)
(20) ),
(23)
(23) and the initial conditions (Equation21
(21)
(21) ).
The first term in the integrand function in (Equation22(22)
(22) ) is the profit from harvesting the total number of fruits times the price per fruit and the second term is the harvesting cost. Here c is a constant proportional to the harvesting cost measured in units money times days. The objective function needs to be multiplied by a constant
which is the number of litres of oil produced per Pentadesma fruit. Since it is a multiplicative constant, without loss of generality, we can take it to be one and multiply the maximum calculated profit by this constant later. Similarly, we can take P to be 1, which is equivalent to taking a new multiplicative constant
instead of
. The value of the constant c vary significantly. So we will do simulations with different values of c.
Our modelling technique and numeric algorithms can be easily modified to different formulations of the objective function. The objective function (Equation22(22)
(22) ) assumes a quadratic form convenient for a theoretical analysis of applied problems. Isoelastic, logarithmic and other nonlinear output-revenue functions can also be used to provide a realistic description of a studied economic-environmental process [Citation25, Citation26].
6.3. Numeric simulation
We will solve the OCP (Equation20(20)
(20) )–(Equation23
(23)
(23) ) using a direct method in which the unknown variable
and control
are discretized by cubic piecewise polynomials over a partition of the interval
. The coefficients of the polynomials are chosen to maximize the objective function. The open source package BOCOP [Citation8] is used.
Then, we investigate the effect of varying different model parameters for the optimal control solutions and consider four different scenarios, where we vary parameters and
These parameters represent the cost of harvesting fruits, the rate at which fruits are lost or stolen, the maximum number of mature fruit and the number of fruits left on the ground, respectively. First we consider the impact of the cost of harvesting the Pentadesma fruits by varying the constant parameter c from 1 to 100; and we set
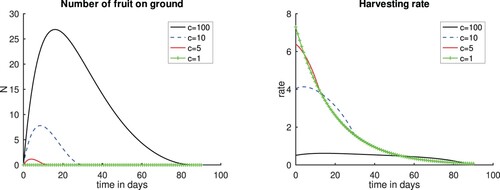
We suppose that 10% of the fruits that fall to the ground is lost. The results presented in Figure show that when the cost constant c increases from 1 to 100, the harvesting rate goes down as expected. For c = 1, the fruits are harvested as soon as they fall from the tree since it is cheap to harvest them and leaving them on the ground leads to losses.
Figure 6. Plots for scenarios varying the cost constant c. Left panel, Number of fruits. Right panel, Harvesting rate. ,
and 100. Time t = 0 is the time when the first fruits fall to the ground.
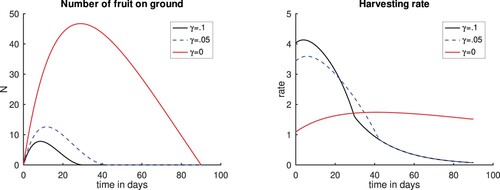
Next we investigate the effect of the number of fruits lost or stolen by taking the rate of stolen fruits (γ) to be 0% and 5%, that is, there is no or 5% of fruits stolen. We keep From outcomes shown in Figure we can see that as fewer fruits are stolen, the harvesting rate is low leading to more fruits being left on the ground. However, as more fruits are stolen, the harvesting rate goes up as there is the need to quickly harvest these fruits before they are stolen resulting in less fruits left on the ground.
Figure 7. Plots for scenario varying the amount of fruits lost or stolen and 0.1, and setting
. Left panel, Number of fruits. Right panel, Harvesting rate. Time t = 0 corresponds to the time when the first fruits fall to the ground. The case c = 10 and
corresponds to a case when we varied the cost constant c considered in Figure and is included for completeness.
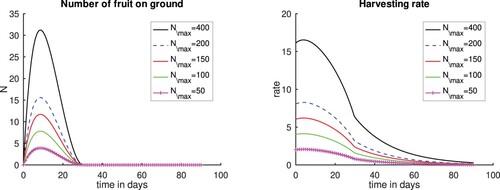
In the next scenario, we vary , by assigning values 50, 150, 200 and 400 to
, to show the differences due to the variability in the number of fruits per tree. In this scenario, we set
. We still assume that there are no fruits left on the ground at the end of the harvesting season. The results in Figure show that, as the maximum number of mature fruit
increases, the harvesting rate also increases, and the the maximum number of fruits harvested occurs at the 10th day of the harvesting period. Furthermore, for large a maximum number of mature fruits (
), the harvesting rate reaches its maximum in the first five days and the harvesting curves flatten for less fruits. This result implies that harvesting early is important particularly when the large number of fruits are produced and a large quantity of fruits are stolen.
Figure 8. Plots for scenarios varying , and setting
, and
and 400. Left panel, Number of fruits. Right panel, Harvesting rate. Time t = 0 is the time when the first fruits fall to the ground. The case c = 10 and
corresponds to a case when we varied the cost constant c considered in Figure and is included for completeness.
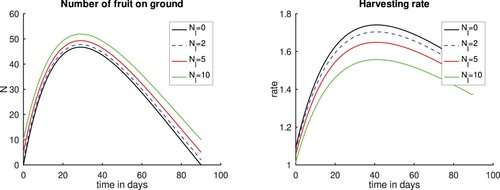
In this last scenario, we assume that there are certain number of fruits left on the ground , so that seeds can produce new trees. In this scenario, we set
and assume that no fruits are stolen or lost, that is
. We also assume that the number of fruits left on the ground at all times is greater than
and that at time t = 0 there are
fruits on the ground. We take
and
which are equivalent to 2%, 5 % and 10% of the fruits produced. From Figure , we see that as more fruits are left on the ground, the lower is the harvesting rate. This is not surprising since no fruits are being stolen.
Figure 9. Plots varying the number of fruits left on the ground Nl. Left panel, Number of fruits. Right panel, Harvesting rate. and
;
and
;
and
;
and
. Observe that the first case correspond to one of the cases preseted in Figure . Time t = 0 corresponds to the time when the first fruits fall to the ground.
7. Discussion
In this paper, we propose a model that describes the population dynamics of trees, shrubs and plants (hereafter we will write only trees), which assumes that the population net growth rate of the tree is affected simultaneously by the reduction of the habitat size and the non-lethal harvesting rate. This net growth rate (that is, the recruitment rate minus death rate) is integrated into a single ODE model. A nonlinear dependence of the harvesting rate on the plant density is incorporated via a logistic type growth rate of the tree population. It has been suggested that it is important to consider such assumption when studying the effect of harvesting on tree population viability (e.g. [Citation27]).
By studying the impacts on a tree population of two types of critical stresses, habitat size reduction and non-lethal harvesting, with a single model, we obtain novel insights into the processes underlying viable states of population dynamics. In particular, the model framework permits to determine the non-lethal harvesting level and fragment width that assure the tree population either stabilizes or increases. Furthermore, if a given non-lethal harvesting rate is known, our framework allows us to define the minimum habitat size, in terms of habitat width, that supports sustainable states of a given tree population. On the other hand, if the habitat size is known, the critical non-lethal harvesting rate is easily determined in our framework. In fact, the non-lethal harvesting level and fragment width thresholds are easily established by solving a nonlinear algebraic equation. This can be useful in the context of running scenarios to assist natural resources management.
To the best of our knowledge, our formulation is the first mathematical modelling approach to study the temporal dynamics of a tree population subject to the pressure of non-lethal harvesting and habitat reduction. For this reason, we propose a simple model as a first step into this research direction. In our future work, the model will be extended to include age- or size-structure and seasonality. To illustrate the applicability of the proposed mathematical framework, real experimental data are integrated into the model to determine parameters of recruitment rate and death rate functions. These functions constitute the building blocks of the population net growth function in the ODE model. The experimental data set consists of non-lethal harvesting of fruits from Pentadesma butyracea forest gallery in Benin in sites with distinct levels of habitat reduction, that is, different widths measured transversally to riverbeds and streambeds. The data were collected in two regions that are known to be geographically distinct and differ in their climate profile: dry and moist [Citation19, Citation51].
The values of the critical non-lethal harvesting rates are computed for 12 habitats, where pentadesma tree population data were collected. In the moist region, these values indicate that for sites that support any harvesting, the allowed rates can be high (%). This may be due to the fact that the data concerning recruitment rate include incoming new trees via seeds and clones. Nonetheless, literature points out that more than 80% of fruits can be collected without severe effects on the population dynamics (see [Citation49]). However, Gaoue et al. [Citation19] suggest that fruit harvesting greater than 25% may have significant impact on the genetic pool of the population. It can lead to a decrease in the recruitment via seeds and a significant increase of the recruitment via clonal reproduction. Our results also suggest that Tchoundekou, Peperkou and Kouba located in the dry region of Benin cannot support the harvesting level implemented at these sites.
In this paper, we also investigate how humidity and rainfall levels may change the impact of the non-lethal harvesting and habitat reduction on the recruitment, mortality and net growth rates of Pentadesma. The recruitment rate of trees in absence of fragmentation and non-lethal harvesting is much higher in the dry region than in the moist region of Benin. On the other hand, our results suggest that effect of the increment of the non-lethal harvesting rate on the recruitment rate of Pentadesma trees is stronger in the dry region than in the moist region. In contrast, the impact of the reduction of the habitat size, through the reduction of its width, on the tree's recruitment rate is almost negligible in both regions.
In the dry region, the total mortality rate of trees is approximately equal to the corresponding natural death rate for habitat widths greater than approximately 25 m. In contrast, in the moist region, the total mortality rate of the tree population is decreasing towards the natural death rate as the habitat size increases. This pattern is even observed for values of habitat size greater than 100 m. Thus, the Pentadesma trees are more prone to the adverse effects of habitat reduction in the moist regions than in the dry regions.
Concerning the impact of increasing the non-lethal harvesting of Pentadesma's fruits, our study indicates that it does not have a significant impact on the net growth rate of a tree population in the moist region of Benin while it affects negatively the net growth rate of the trees in the dry region. On the impact of habitat reduction, our results indicate that decreasing the habitat width within the moist region leads to a decrease in the net growth rate of the Pentadesma for values of the site's width close to zero. In contrast, in the dry region the negative effects of increasing habitat reduction on the Pentadesma net growth rate is negligible compared to the negative impact of a similar action in the moist region of Benin.
Using our mathematical model framework, we study the long- and short-term impact of habitat reduction and non-lethal harvesting on the tree viability. The illustrative simulations are provided for the 12 habitats where the experimental data set was collected. The study reveals that if the non-lethal harvesting rates are , then for sites in the moist region with width
m the long-term dynamical behaviour is extinction of the tree population with similar temporal evolution pattern. In contrast, in sites with width
m, the Pentadesma population density asymptotically reaches the carrying capacity of the site but with distinct temporal evolution. In the dry region, for a fix site's width and the same harvesting levels as above, we observe a higher variability in the short- and long-term temporal dynamics profiles of the Pentadesma density.
These illustrative scenarios reinforces the importance of taking into consideration these two dynamical perspectives, short-term and asymptotical, when developing realistic managements policies [Citation18]. In contrast to the study by Gaoue [Citation18], where the long- and short-term dynamical behaviours were studied using two modelling strategies, we use one model and two distinct model analytic techniques, dynamic system techniques for asymptotic behaviour and numeric simulations for transient dynamic behaviour.
Our results are obtained with a model parametrized with the best data available. This parametrization can be easily changed to accommodate distinct data sets. Our findings show the potential of the proposed model to gain insights on several quantities of interest. Namely, it sheds light on how the vital rates and population dynamics of tree/shrub/plant are impacted by non-lethal harvesting and habitat fragmentation across two regions with distinct levels of rainfall. The evaluation of the performance of the model to predict the temporal evolution of the density of the tree population will be possible when data include the values of density for more than a single time event. Due to the current ecological importance of this research line, we would like to motivate researchers to not only collect data pertinent to specific systems, including more data on Pentadesma tree gallery in Benin, but also to develop further mathematical and experimental investigation in this field.
The novel contributions of the suggested optimal control problem is the recommendation of the optimal non-lethal harvest rates to maximize the economic benefit under different scenarios. The objective function reflects realistic assumptions. The cost of non-lethal harvesting is higher when there are fewer fruits. The underlying assumption is that when there are less fruits left on the ground they are more disperse and harder to find. Therefore, more time is needed to find fruits. The hypotheses about the fruits maturation and the fruit falling rates are reasonable and their expressions can be easily changed and incorporated into a model to appropriately reflect the specific plant population.
We ran different scenarios to study the effect of model parameters on the optimal economic benefit of the non-lethal harvesting of Pentadesma fruits. Specifically, we study the impact of the cost of harvesting the Pentadesma fruits, the amount of fruits lost or stolen, and the variability in the number of fruits left on the ground. As shown in Figures –, to prevent losses of NTFP, it is best to collect the fruits as soon as they fall to the ground especially when the cost of harvesting is low and when the trees are producing a large number of mature fruits. Harvesting as quickly as possible also prevents the fruit theft. The theft of fruits and other crops is a major concern for farmers since this eventually reduces their overall profit [Citation1, Citation12, Citation16, Citation42, Citation52]. It is not the only detrimental impact of the theft of NTFP since fewer fruits left on the ground affects the growth rate and genetic diversity of trees. It could lead to increase in clonal offspring over seed produced offspring that might have limited ability to withstand environmental stochasticity [Citation19]. Thus, it is important to consider the fruit theft both from economical and biological stand point.
The novel mathematical framework, model and optimal control problem are quite general in the sense that the parametrized functions and objective function can be easily adjusted to a specific tree population and then parametrized with the available experimental data. Hopefully the current work will encourage the collection of missing data to have a higher confidence on the predictions we derive from the parametrized model for a given tree population.
In the future, we will incorporate non-steady harvesting rates based on the results of the optimization simulations presented in Section 6 and extend the study to an infinite time period. Another direction is to study different cost functions in the objective function and to consider non-lethal harvesting from the tree in addition to the harvesting of fruits from the ground.
Acknowledgments
Leite acknowledges support from USFSP 2019-20 Internal Research Grant, Instituto de Matemática Multidisciplinar and Basque Center for Applied Mathematics Research Visit Fellowships. The authors are thankful for support from NIMBioS sponsored by NSF Award # DBI - 1300426 and, partially by University of Tennessee, Knoxville and from AIM's SQuaREs research program on ‘Sustainable plant harvest in fragmented landscapes’. FBA was partially supported by the University of Kansas General Research Fund allocation #2301-2105090 and Kansas National Science Foundation grant # EPSCoR OIA-1656006. The authors acknowledge the reviewers for their useful suggestions.
Disclosure statement
No potential conflict of interest was reported by the author(s).
Additional information
Funding
References
- E. Acheampong, T.F. Insaidoo, and M.A. Ros-Tonen, Management of Ghana's modified taungya system: challenges and strategies for improvement, Agroforestry Systems 90(4) (2016), pp. 659–674.
- A. Ahenkan and E. Boon, Non-timber forest products farming and empowerment of rural women in Ghana, Environ Dev Sustain 13 (2011), pp. 863–878. doi: 10.1007/s10668-011-9295-7.
- L.J.S. Allen, An Introduction to Mathematical Biology, Pearson/Prentice Hall, 2007.
- C. Avocèvou-Ayisso, B. Sinsin, A. Adégbidi, G. Dossou, and P.V. Damme, Sustainable use of non-timber forest products: impact of fruit harvesting on pentadesma butyracea regeneration and financial analysis of its products trade in Benin, For. Ecol. Manage. 257 (2009), pp. 1930–1938.
- B.P. Ayegnon, A.P.P. Kayodé, I. Nassia, P. Azokpota, M. Soumanou, and J.D. Hounhouigan, Changes in the quality characteristics of the butter of Pentadesma butyracea under various storage conditions, African Journal of Food Science 9 (2015), pp. 514–524. doi: 10.5897/AJFS2015.1337.
- E. Badoussi, P. Azokpota, Y.E. Madodé, F.P. Tchobo, B.F. Amoussou, A.P. Kayodé, M.M. Soumanou, and D.J. Hounhouigan, Cooking and drying processes optimization of pentadesma butyracea kernels during butter production, African Journal of Biotechnology 14(39) (2015), pp. 2777–2785.
- B. Bolker, M. Brooks, C. Clark, S. Geange, J. Poulsen, M. Stevens, and J.-S. White, Generalized linear mixed models: A practical guide for ecology and evolution, Trends in Ecology and Evolution 24 (2009), pp. 127–135. doi: 10.1016/j.tree.2008.10.008.
- F. Bonnans, P. Martinon, D. Giorgi, V. Grélard, S. Maindrault, O. Tissot, and J. Liu, Bocop 2.0. 5–user guide, preprint (2017). pp.480. Available at http://bocop.org.
- E.M. Bruna, Are plant populations in fragmented habitat recruitment limited? Test with an Amazonian herb, Ecology 84 (2003), pp. 932–947. doi: 10.1007/s00442-002-0956-y.
- E.M. Bruna and W.J. Kress, Habitat fragmentation and the demographic structure of an Amazonian understory Herb (Heliconia acuminata), Conserv. Biol. 16(5) (2002 Oct), pp. 1256–1266. doi: 10.1046/j.1523-1739.2002.99494.x.
- H. Caswell, Matrix Population Models: Construction, Analysis, and Interpretation, 2nd ed., Sinauer Associates, Sunderland, Massachusetts, 2001.
- S. Charnley, R.J. McLain, and M.R. Poe, Natural resource access rights and wrongs: nontimber forest products gathering in urban environments, Soc. Nat. Resour. 31(6) (2018), pp. 734–750.
- J. Cushing, An Introduction to Structured Population Dynamics, 2nd ed., SIAM, Philadelphia, 1998.
- E.-E.B. Ewédjè, A. Ahanchédé, O.J. Hardy, and A.C. Ley, Reproductive biology of Pentadesma butyracea (Clusiaceae), source of a valuable non timber forest product in Benin, Pl. Ecol. Evol. 148 (2015), pp. 213–228.
- L. Fahrig, Ecological responses to habitat fragmentation per se, Annu. Rev. Ecol. Evol. Syst. 48 (2017), pp. 1–23. doi: 10.1146/annurev-ecolsys-110316-022612.
- G.E. Frey, S.J. Alexander, J.L. Chamberlain, K.A. Blatner, A.W. Coffin, and R.J. Barlow, Markets and market values of nontimber forest products in the united states: A review, synthesis, and identification of future research needs, Journal of Forestry 117(6) (2019), pp. 613–631.
- P.R. Gagnon, E.M. Bruna, P. Rubim, M.R. Darrigo, R.C. Littell, M. Uriarte, and W.J. Kress, Growth of an understory herb is chronically reduced in Amazonian forest fragments, Biol. Conserv. 144(2) (2011 Feb), pp. 830–835.
- O.G. Gaoue, Transient dynamics reveal the importance of early life survival to the response of a tropical tree to harvest, Journal of Applied Ecology 53 (2016), pp. 112–119. doi: 10.1111/1365-2664.12553.
- O.G. Gaoue, C. Gado, A.K. Natta, and M. Kouagou, Recurrent fruit harvesting reduces seedling density but increases the frequency of clonal reproduction in tropical tree, Biotropica 50(1) (2018), pp. 69–73.
- O.G. Gaoue, C.C. Horvitz, and T. Ticktin, Non-timber forest product harvest in variable environments: modeling the effect of harvesting as a stochastic sequence, Ecol. Appl. 21(5) (2011 Jul), pp. 1604–1616. doi: 10.1890/10-0422.1.
- O.G. Gaoue, J. Jiang, W. Ding, F.B. Agusto, and S. Lenhart, Optimal harvesting strategies for timber and non-timber forest products in tropical ecosystems, Theor Ecol 9 (2016), pp. 287–297. doi: 10.1007/s12080-015-0286-4.
- O.G. Gaoue and T. Ticktin, Effects of harvest of nontimber forest products and ecological differences between sites on the demography of African Mahogany, Conserv. Biol. 24(2) (2010 Apr), pp. 605–614. doi: 10.1111/j.1523-1739.2009.01345.x.
- S.K. Ghimire, O. Gimenez, R. Pradel, D. McKey, and Y. Aumeeruddy-Thomas, Demographic variation and population viability in a threatened Himalayan medicinal and aromatic herb Nardostachys grandiflora: matrix modelling of harvesting effects in two contrasting habitats: Harvesting and demography of N. Grandiflora, Journal of Applied Ecology 45(1) (2007 Aug), pp. 41–51. doi: 10.1111/j.1365-2664.2007.01375.x.
- P. Groenendijk, A. Eshete, F.J. Sterck, P.A. Zuidema, and F. Bongers, Limitations to sustainable frankincense production: blocked regeneration, high adult mortality and declining populations: Sustainable frankincense production, Journal of Applied Ecology 49(1) (2012 Feb), pp. 164–173. doi: 10.1111/j.1365-2664.2011.02078.x.
- N. Hritonenko and Y. Yatsenko, Optimal control of a vintage capital model with nonlinear utility, Optimization 57 (2008), pp. 581–592.
- N. Hritonenko, Y. Yatsenko, and T. Bréchet, On north-South interaction and environmental adaptation, Journal of Environmental Economics and Policy 9 (2020), pp. 319–337.
- N. Hritonenko, Y. Yatsenko, R.-U. Goetz, and A. Xabadia, Optimal harvesting in forestry: steady-state analysis and climate change impact, J. Biol. Dyn. 7 (2013), pp. 41–58. doi: 10.1080/17513758.2012.733425.
- D.G. Hull, Optimal Control Theory for Applications, Springer Science & Business Media, 2013.
- M.I. Kamien and N.L. Schwartz, Dynamic Optimization: the Calculus of Variations and Optimal Control in Economics and Management, Courier Corporation, 2012.
- A. Kolb, J.P. Dahlgren, and J. Ehrlén, Population size affects vital rates but not population growth rate of a perennial plant, Ecology 91(11) (2010 Nov), pp. 3210–3217. doi: 10.1890/09-2207.1.
- M. Kouagou, O.E.B. Ahouandjinou, L. Houessou, A. Dicko, and A.K. Natta, Synergistic effect of anthropogenic disturbances on offspring demography of Pentadesma butyracea (Clusiaceae) a threatened tree species in Benin (West-Africa), Am. J. Plant. Sci. 10 (2019), pp. 1374–1390.
- B. Lankoandé, A.M. Lykke, J.I. Boussim, and A. Ouédraogo, Structure, plant diversity and future management of Pentadesma butyracea stands, an endangered oil tree species in Burkina faso, West Africa, Forestry: An International Journal of Forest Research 92(5) (2019), pp. 591–598.
- B. Lankoandé, A. Ouédraogo, J.I. Boussim, and A.M. Lykke, Identification of determining traits of seed production in Carapa procera and Pentadesma butyracea, two native oil trees from riparian forests in Burkina Faso, West Africa, Biomass and Bioenergy 102 (2017), pp. 37–43.
- M.C. Leite, R. Sauchuk, F.B. Agusto, O.G. Gaoue, and B. Chen-Charpentier, Modeling the persistence of plant populations in fragmented ecosystems, Ecol. Modell. (2021), pp. 457. doi: 10.1016/j.ecolmodel.2021.109681.
- J. Lienert, Habitat fragmentation effects on fitness of plant populations–a review, Journal for Nature Conservation 12(1) (2004 Jul), pp. 53–72. doi: 10.1016/j.jnc.2003.07.002.
- E. Lucas, A review of trail-related fragmentation, unauthorized trails, and other aspects of recreation ecology in protected areas, California Fish and Wildlife, Recreation Special Issue (2020), pp. 95–125. doi: 10.1007/s00442-002-0956-y.
- S. Matesanz, M.L.R. Teso, A. García-Fernández, and A. Escudero, Habitat fragmentation differentially affects genetic variation, phenotypic plasticity and survival in populations of a Gypsum endemic, Front. Plant. Sci. 8 (2017), pp. 843. doi: 10.3389/fpls.2017.00843.
- MATLAB, preprint (2022). Available at https://www.mathworks.com/products/matlab.html.
- W.F. Morris and D.F. Doak, Quantitative Conservation Biology: Theory and Practice of Population Viability Analysis, Sinauer Associates, Sunderland, MA, 2003.
- J.D. Murray, Mathematical biology, Interdisciplinary applied mathematics, Vol. I, 3rd ed., Springer-Verlag, New York, 2003.
- A. Pandey, Y. Tripathi, and A. Kumar, Non timber forest products (NTFPs) for sustained livelihood: challenges and strategies, Res. J. For. 10 (2016), pp. 1–7. doi: 10.3923/rjf.2016.1.7.
- M.R. Pérez, J. Arnold, and Y. Byron, Current issues in non-timber forest products research, Proceedings of the workshop “Research on NTFP”, Hot Springs, Zimbabwe, 28 Aug–2 Sept 1995, Cifor, 1996.
- M. Rees, D.Z. Childs, and S.P. Ellner, Building integral projection models: a user's guid, Journal of Animal Ecology 83 (2014), pp. 528–545. doi: 10.1111/1365-2656.12178.
- J. Rybicki, N. Abrego, and O. Ovaskainen, Habitat fragmentation and species diversity in competitive communities, Ecol. Lett. 23 (2020), pp. 506–517. doi: 10.1111/ele.13450.
- I.B. Schmidt, L. Mandle, T. Ticktin, and O.G. Gaoue, What do matrix population models reveal about the sustainability of non-timber forest product harvest?: evaluating NTFP harvest sustainability, Journal of Applied Ecology 48(4) (2011 Aug), pp. 815–826. doi: 10.1111/j.1365-2664.2011.01999.x.
- C.E. Seltzer, C.T. Kremer, H.J. Ndangalasi, and N.J. Cordeiro, Seed harvesting of a threatened African tree dispersed by rodents: is enrichment planting a solution?, Global Ecology and Conservation3 (2015), pp. 645–653.
- B. Sinsin and T.A. Sinadouwirou, Valorisation socio-économique et pérennité du Pentadesma butyracea Sabine en galeries forestiéres au Bénin, Cahiers Agricultures 12 (2003), pp. 75–79.
- F.P. Tchobo, A.K. Natta, B. Barea, N. Barouh, G. Piombo, M. Pina, P. Villeneuve, M.M.Soumanou, and D.C.K. Sohounhloue, Characterization of Pentadesma butyracea sabine butters of different production regions in benin, J Amer Oil Chem Soc 84 (2007), pp. 755–760. doi: 10.1007/s11746-007-1102-0.
- T. Ticktin, The ecological implications of harvesting non-timber forest products. Journal of Applied Ecology 41(1) (2004 Feb), pp. 11–21. doi: 10.1111/j.1365-2664.2004.00859.x.
- T. Ticktin, H. Fraiola, and A.N. Whitehead, Non-timber forest product harvesting in alien-dominated forests: effects of frond-harvest and rainfall on the demography of two native Hawaiian ferns, Biodivers. Conserv. 16(6) (2007 Jun), pp. 1633–1651. doi: 10.1007/s10531-006-9030-0.
- USGS, [cited 2021 Nov 08]. Available at https://eros.usgs.gov/westafrica/node/147.
- H. Van der Vossen and G. Mkamilo, Plant resources of tropical Africa 14: vegetable oils, PROTA, Netherlands, 2007, pp. 119–120.
- N.R. Vaughn, G.P. Asner, and C.P. Giardina, Long-term fragmentation effects on the distribution and dynamics of canopy gaps in a tropical montane forest, Ecosphere 6(12) (2015 Dec), pp. art271. doi: 10.1890/ES15-00235.1.
- M. Williamson, Mathematical models of invasion, in Biological invasions: a Global Perspective, J. A. Drake, ed., John Wiley and Sons, 1989.
- J. Zambrano and R. Salguero-Gómez, Forest fragmentation alters the population dynamics of a late-successional tropical tree, Biotropica 46(5) (2014 Sept), pp. 556–564. doi: 10.1111/btp.12144.
Appendix 1: Pentadesma data
We present the data we use to parametrize our model. It consists of census data of 12 populations of Pentadesma butyracea collected in 2016 and 2017. These populations are equally distributed between two climatic regions of Benin, six sites in Sudanian at –
and six sites in Sudano-Guinean at
–
The Sudanian region with an annual rainfall between 900 and 1100 mm is classified as a dry region and is assigned the subscript j = 1 (see Section 3 in the main text). The Sudano-Guinean region with an annual rainfall between 1000 and 1200 mm is is classified as a moist region and is assigned the subscript
The recruitment rate of the Pentadesma tree for each climatic region and habitat are computed from data in Table as follow. For a fixed year and a given site, the value in the column ‘OffSprings’ is divided by the corresponding value in the column ‘Total population’. Then, the recruitment rate for each site is obtained by computing the average of the recruitment rates in years 2016 and 2017. The resulting values are in Table .
Table A1. For each climatic region of Benin and each habitat the following values are provided: the width of the habitat, the harvesting rate implemented, the number of offspring trees in years 2016 and 2017. For each site a single value is given for the total number of trees in the population.
Table A2. The value of the Pentadesma recruitment rate for each habitat within each climatic region.
In Table , we present the experimental data corresponding to the mortality rates of Pentadesma tree in the 12 habitats in 2016 and 2017. It includes the number of death trees per total population per year in 2016 and 2017 for offspring and adult Pentadesma butyracea trees.
Table A3. The values of the mortality rate in the dry (j = 1) and moist (j = 2) region of Benin for offsprings and adult trees. The experimental values are given for 2016 and 2017.
Table A4. The total natural death rate of the Pentadesma tree within each climatic region.
The total mortality rate for each of the 12 sites is computed by summing the mortality rate of offsprings and adults occurring in a given year and then averaging over the two years. The computed average total mortality is given in the last column of Table .
The total natural mortality rate within each climatic region j = 1, 2 is taken as the average of the total mortality rate observed in the site with largest width within a given climatic region j. The values are presented in Table .