
 ?Mathematical formulae have been encoded as MathML and are displayed in this HTML version using MathJax in order to improve their display. Uncheck the box to turn MathJax off. This feature requires Javascript. Click on a formula to zoom.
Abstract
SIRS models capture transmission dynamics of infectious diseases for which immunity is not lifelong. Extending these models by a W compartment for individuals with waning immunity, the boosting of the immune system upon repeated exposure may be incorporated. Previous analyses assumed identical waning rates from R to W and from W to S. This implicitly assumes equal length for the period of full immunity and of waned immunity. We relax this restriction, and allow an asymmetric partitioning of the total immune period. Stability switches of the endemic equilibrium are investigated with a combination of analytic and numerical tools. Then, continuation methods are applied to track bifurcations along the equilibrium branch. We find rich dynamics: Hopf bifurcations, endemic double bubbles, and regions of bistability. Our results highlight that the length of the period in which waning immunity can be boosted is a crucial parameter significantly influencing long term epidemiological dynamics.
1. Introduction
The susceptible-infectious-recovered (SIR) approach has been widely applied in diverse forms to understand the transmission dynamics of communicable diseases. For many infections, immunity is not lifelong, and after some time, recovered individuals may become susceptible again. Prior to that, repeated exposure to the pathogen might boost the immune system, thus prolonging the length of immune period. A very general framework of waning-boosting dynamics has been introduced in [Citation2]. Special cases of that are the SIRWS compartmental models, where W is the collection of individuals whose immunity is waning but can be boosted upon repeated exposure without experiencing the disease again.
SIRWS models formulated as systems of ordinary differential equations were studied in [Citation5,Citation7,Citation10,Citation12,Citation13]. In these models, the immunity period is divided into two parts: upon recovery, previously infected individuals move to R, and from there they may transit to W as time elapses. If they are exposed again while being in W, their immunity can be boosted and they move back R. Otherwise, they eventually lose their immunity, become susceptible again an move back to S. The aforementioned studies model these two phases of the immune period by a symmetric partitioning, by assuming identical rates of transition from R to W and from W to S.
In contrast, our work removes this symmetry constraint, and we analyse how the different partitioning of the immune period into R and W, and varying boosting rates affect the dynamics of the model. First, the existence of equilibria and analytic conditions for their local stability are established. Then, using numerical tools and methods, we observe the emergence of complex phenomena through various bifurcations, such as endemic double bubbles, and multiple regions of bistability.
1.1. Modified SIRWS model
This section describes the SIRWS compartmental model in which the population is divided as follows. The individuals susceptible to infection are placed in S, those currently infectious in I, and those recovered from infection are divided into two compartments based on their immunity level. The fully immune are found in R and those with waned immunity are in W. Figure depicts the flow diagram of our model governed by the system of ordinary differential equations
(1a)
(1a)
(1b)
(1b)
(1c)
(1c)
(1d)
(1d) where β, γ, and μ are referred to as the infection rate, recovery rate, and birth and death rate, respectively.
Figure 1. Flow diagram of the SIRWS system (Equation1a(1a)
(1a) ).
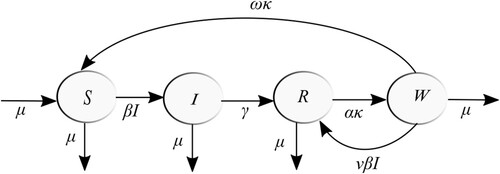
Recovered individuals may lose immunity by the chain of transitions . The average duration of immune protection, that is the average time required to complete both of these transitions is
and, hence, κ is the immunity waning rate. Members of W are still immune to infection and are subject to immune boosting upon re-exposure. The frequency of that re-exposure is modulated by the boosting force ν. In our analysis, hosts going through boosting are not infectious, such as in [Citation2,Citation5,Citation10,Citation12], as opposed to [Citation18].
The population is normalized to 1 that is for all
. Vital dynamics is modelled with the rate μ for birth and death, and disease-induced fatality is not considered.
In former SIRWS model studies, e.g. [Citation5,Citation7,Citation10,Citation12,Citation13], the immune waning rates are the same for individuals who move from the recovered compartment to the waning compartment and for those who transition onward to the susceptible compartment. In contrast, we consider an asymmetric partition of the immunity period by introducing the parameters and
setting the average time spent in R and W to
and
, respectively. Hence,
(2)
(2) Note that the special case
, representing the symmetric partition of immunity period, is what was considered in the aforementioned studies.
By considering various limiting scenarios of boosting for (Equation1a(1a)
(1a) ), it is apparent that the system exhibits SIRS-like dynamics as
and SIR-like dynamics as
. In addition, we observe SIR-like dynamics as
(
) and SIS-like dynamics as
(
).
2. Equilibria and stability
This section first investigates system (Equation1a(1a)
(1a) ) in order to establish the formulae for the equilibria of our SIRWS model. Then, we analyse the transcritical bifurcation where these equilibria exchange stability in Section 2.1. Finally, we derive the Routh–Hurwitz stability criterion in Section 2.2.
We begin by utilizing the relation
to obtain the reduced system
(3a)
(3a)
(3b)
(3b)
(3c)
(3c) Note that the region relevant for our epidemiological setting
is forward invariant.
Now, let us turn our attention to equilibria of (Equation3a(3a)
(3a) ) and seek solutions of the steady state equations
(4a)
(4a)
(4b)
(4b)
(4c)
(4c)
From (Equation4b(4b)
(4b) ), we obtain that either
or
. In the first case,
follows from (Equation4c
(4c)
(4c) ) and, finally,
from (Equation4a
(4a)
(4a) ). Hence we obtain
the disease-free equilibrium (DFE) of (Equation3a
(3a)
(3a) ). In the latter case when
(5)
(5) Equation (Equation4a
(4a)
(4a) ) yields
with
Then, using the formulae for
and
, (Equation4c
(4c)
(4c) ) results in a quadratic equation for
. It is straightforward to verify that the leading term coefficient is positive, hence, the graph of it is an open up parabola with the y-intercept
Moreover, as shown in Appendix A.1, the solutions can be expressed as
(6)
(6) using
given by
Finally, substituting (Equation6
(6)
(6) ) into the formula for
results in
(7)
(7) Hence, we obtained the two remaining equilibria of (Equation3a
(3a)
(3a) ), namely the endemic equilibrium (EE)
Clearly, whenever the square root is real as the inequality is readily satisfied for
(then
) and directly follows from
(8)
(8) when
(then
). Moreover, the condition
is sufficient (but not necessary) for
. Obviously, in the epidemiological setting of this manuscript, solely
may be admissible.
Another important implication of (Equation8(8)
(8) ) is that
Observe that, in the case of equality,
holds. Furthermore, again for
, the parabola for
has a positive y-intercept, thus, both solutions are either positive or negative. Moreover, we have
as
is satisfied and
. These imply the positivity of the other root that is
.
Now, summing (Equation4a(4a)
(4a) ), (Equation4b
(4b)
(4b) ), and (Equation4c
(4c)
(4c) ) results in
hence,
must hold for non-negative
implying
.
Finally, note that the basic reproduction number, see e.g. [Citation2], of the system (Equation3a(3a)
(3a) )– and of (Equation1a
(1a)
(1a) )– is
thus, we may rewrite the condition
as
.
Before continuing the analysis, let us summarize our findings so far.
There is a unique DFE
, which exists for all parameter values in the system.
If
If
2.1. Transcritical bifurcation at
For the stability analysis of the disease-free equilibrium , consider the Jacobian matrix for our SIRWS system (Equation3a
(3a)
(3a) )
(9)
(9) and evaluate at the DFE
Then, the corresponding eigenvalues are
The two eigenvalues
are negative and
iff
. Hence, the DFE is locally asymptotically stable when
and unstable for
.
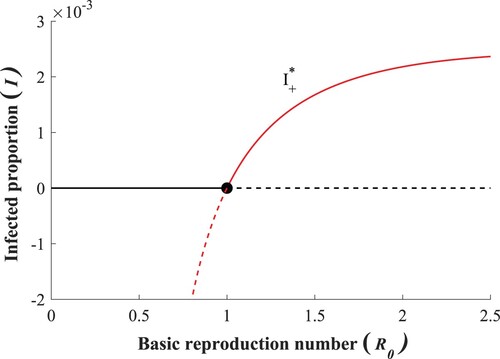
The following Theorem describes the bifurcation associated with this stability change at that is also demonstrated in Figure . The proof relies on Theorem 4.1 of [Citation4] based on centre manifold theory [Citation3,Citation20]. For the sake of completeness, the relevant version of the original theorem is included in Appendix A.2.
Figure 2. Transcritical bifurcation of forward type and the appearance of the LAS endemic equilibrium at
.
Theorem 2.1
A transcritical bifurcation of forward-type occurs at .
Proof.
Fix all parameters but β that will serve as the bifurcation parameter with corresponding to the critical case
.
We show that the conditions of Theorem A.1 are satisfied for the system , where
is obtained by applying the substitutions
and
to Equations (Equation3a
(3a)
(3a) ), (Equation3b
(3b)
(3b) ), and (Equation3c
(3c)
(3c) ), with
The matrix (
with
) has one simple zero eigenvalue and two eigenvalues with negative real part
Now, let us calculate
where w, v are the right and left eigenvectors of A corresponding to the zero eigenvalue.
Note that we may fix as Aw = 0 is underdetermined. Then,
follow. Analogously, we find a left eigenvector
.
As , the sums get reduced to the terms containing
Clearly, the nonzero second order partial derivatives of
at
are
Hence,
As
and
for all parameters, we can apply Theorem A.1 noting that even though
, as the first component of
is positive,
is not required actually.
Translating the statement of the aforementioned Theorem to our original system (Equation3a(3a)
(3a) ), we obtain that when
increases through 1, a transcritical bifurcation of forward type occurs with
losing and
gaining local asymptotic stability (LAS), respectively.
2.2. The Routh–Hurwitz criterion for
This section analyses the stability of the endemic equilibrium for fixed
, and μ, given that
holds.
Local asymptotic stability (LAS) is characterized by all eigenvalues of the Jacobian (Equation9(9)
(9) ) at
having negative real part. Therefore, we consider the matrix
and, in turn, its characteristic polynomial
with
(10)
(10) and
as given in (Equation5
(5)
(5) ), (Equation6
(6)
(6) ), and (Equation7
(7)
(7) ).
Utilizing the Routh–Hurwitz (RH) criterion [Citation15,Citation16] yields that is LAS iff the following inequalities are satisfied
As the positivity of
is trivial, we are led to analyse the sign changes of the function
(11)
(11) for
and
.
2.2.1. Transformation of
The formulae in (Equation7(7)
(7) ) and (Equation10
(10)
(10) ) appear to be (mostly) symmetric with respect to α and ω. Recall that these two parameters are closely related as
directly follows from (Equation2
(2)
(2) ). These considerations suggest to introduce the substitution
(12)
(12) with
and the
case corresponding to
. Nevertheless, in order to apply (Equation12
(12)
(12) ), we need to establish that
in (Equation10
(10)
(10) ) may be considered as a function of η. This holds due to the equality
see Appendix A.3 for details.
Then, one obtains that
with
where
.
Substitution (Equation12(12)
(12) ) reveals an important feature of
, namely, there is a bijection
such that
. In particular, local extrema at
appear in pairs.
Furthermore, using the chain rule, we obtain that
Clearly,
(that is
) is a critical point of
for all immune boosting parameters ν. By Lemma A.2, either all derivatives of
are zero at
or the first non-vanishing derivative is of even order. As
is analytic and not identically zero for any
, the former is not possible, hence,
is a local extremum for all boosting rates ν.
3. Numerical analysis
This section summarizes the results of our numerical stability and bifurcation analysis of system (Equation3a(3a)
(3a) ) with respect to varying waning and boosting dynamics. In the remaining part of the manuscript, all other parameters are considered to be fixed following [Citation10] to model pertussis as
(13)
(13) corresponding to an average infectious period of 21 days, average life expectancy of 80 years and a basic reproduction number
.
First, Section 3.1 discusses how the local stability of changes given (Equation13
(13)
(13) ) with varying α and ν. Then, Section 3.2 analyses these stability changes and the corresponding bifurcations. In addition, using numerical continuation methods, we observe the bistable regions in the
-plane.
3.1. Analysis of the Routh–Hurwitz criterion for
Before carrying out any numerical computations, let us analyse the asymptotic behaviour of (Equation11(11)
(11) ) as
,
,
, and
. The results, shown in Table , are valid for all parametrizations of (Equation3a
(3a)
(3a) ) and do not rely on (Equation13
(13)
(13) ).
Table 1. Limits of ,
, and the sign of
.
As a consequence of these limits, there exists a compact region K in the -plane such that the endemic equilibrium
is LAS for
.
3.1.1. Double bubbles of instability
Section 3.1 has readily established that it is sufficient to consider a compact subset in the -plane for the stability analysis of
. Based on our experiments, we have restricted our attention to
and obtained the heatmap in Figure when studying the positivity of
.
Figure 3. Heatmap of the Routh–Hurwitz criterion capped at
with highlighted zero contour. Figure (b) zooms in on the region close to
.
![Figure 3. Heatmap of the Routh–Hurwitz criterion yν(α) capped at [−1,1] with highlighted zero contour. Figure 3(b) zooms in on the region close to α=1.](/cms/asset/56a28e07-f425-4277-8fc3-30163f35baec/tjbd_a_2109766_f0003_oc.jpg)
It is apparent that, for an interval of α values, is initially positive for small ν, then, as the boosting rate increases the RH criterion becomes negative for an interval of ν values, after which, it turns positive again. Now, let us look at the heatmap from the other direction. Note that for most interesting boosting rates ν, a similar stability switch may be observed over an α-interval. However, the dynamics is clearly more involved close to boosting rates around 14 as Figure suggests the presence of multiple stability switches.
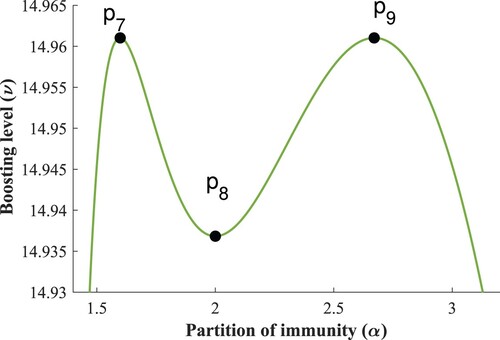
It is straightforward to localize such phenomena by finding local extrema of (as a function of α) whose value is zero. Hence, we looked for intersections of the curves
as shown in Figure together with the positivity analysis of the derivative. Our findings confirm the presence of multiple switches close to
, moreover, they highlight the existence of similar dynamics close to
as well. Note that Figure gives no hint of the latter.
Figure 4. Heatmap of capped at
with highlighted zero contours of
and
. Figure (b) zooms in on the region close to
.
![Figure 4. Heatmap of yν′(α) capped at [−1,1] with highlighted zero contours of yν(α) and yν′(α). Figure 4(b) zooms in on the region close to α=1.](/cms/asset/a0ab25e1-323d-41fd-8627-25ff100c0291/tjbd_a_2109766_f0004_oc.jpg)
Recall from Section 2.2.1 that local extrema of – other than
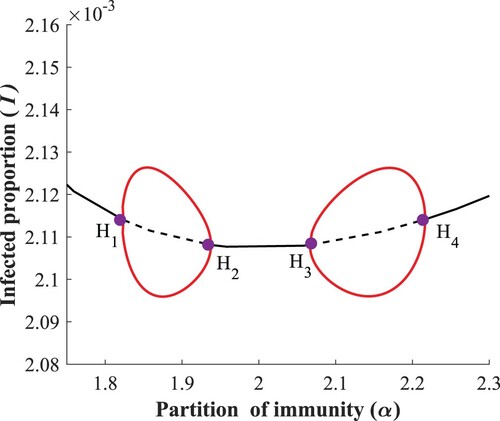
– appear in pairs. Hence, zooming in on these two regions, shown in Figure , reveals double bubbles of instability for certain boosting rates.
Figure 5. Zoomed-in heatmaps of the Routh–Hurwitz criterion with highlighted zero contour over regions of interest in the
-plane. Critical points
on the contour are marked. (a)
. (b)
.
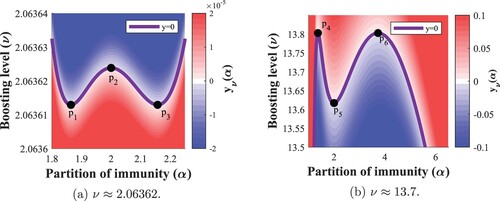
Note that the width of the ν-range where this phenomenon occurs in Figure (a) is less than , thus, it should come as no surprise that it was not observable based on the original heatmap in Figure . The coordinates of the highlighted critical points are given in Table .
3.2. Numerical bifurcation analysis
In the following, we present numerical analysis of one parameter and two parameter
bifurcations of the endemic equilibria branch carried out using MatCont [Citation6]. For a background on bifurcation analysis we refer to [Citation9,Citation19].
Motivated by the results of Section 3.1, in particular the region depicted in Figure (a), we computed the two parameter bifurcation diagram of system (Equation3a
(3a)
(3a) ), see Figure . To fully understand the bifurcation diagram, let us denote by Ω the open domain enclosed by the purple coloured Hopf curve, which is continuous when supercritical (called
) and dashed when subcritical (called
). A stable limit cycle bifurcates from the equilibrium if we cross
from outside to inside Ω, while an unstable cycle appears if we cross
in the opposite direction.
Figure 6. Two-parameter bifurcation diagram.
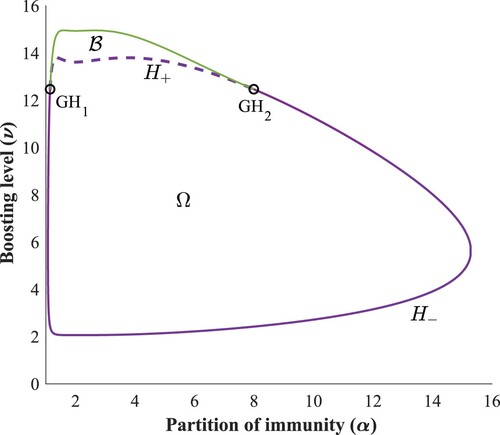
It is apparent that for larger boosting rates (ν between 12 – 15), the local stability analysis of is not sufficient to capture all interesting dynamics.
The two new critical points identified are and
. The approximate coordinates of these generalized Hopf points are listed in Table and they mark the parameter values where the Hopf bifurcation changes from supercritical to subcritical. The branch of the limit points of periodic cycles appears in green, which together with the dashed purple curve
enclose a bistability region
, where there exists a stable periodic solution alongside the LAS endemic equilibrium.
Let us now examine the bifurcation diagram in more detail over regions, characterized by various levels of boosting rate ν, where the dynamics is similar.
In all bifurcation plots that follow, the endemic equilibria branch (particularly the I component) is marked with black curve, solid when LAS and dashed when unstable. Red and blue curves represent branches of stable and unstable limit cycles, respectively, and Hopf bifurcation points are marked with purple dots.
3.2.0.1 Region:
The system has a stable point attractor for all .
3.2.0.2 Region:
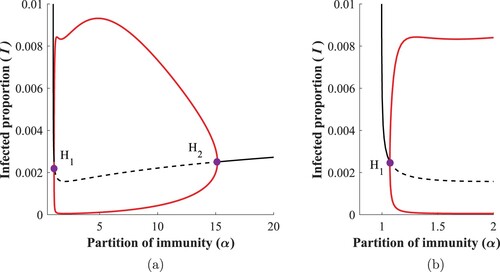
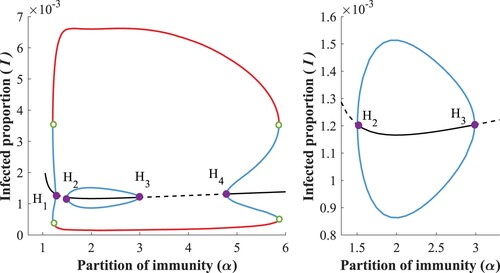
There are four supercritical Hopf bifurcation points on the endemic equilibria branch, see Figure for a typical setting. Continuation of (the I-component of) limit cycles with respect to α starting from two Hopf bifurcation points, and
, forms an endemic bubble (the two branches of stable limit cycles coincide), see [Citation14] for the origin of this concept. The same happens for the
pair.
Figure 7. Bifurcation diagram w.r.t. α, when .
Recall that these double bubbles of instability (endemic bubbles) were readily observed in Figure (a). Such double bubbles have been conjectured in a delay differential model for waning and boosting [Citation1]. For an overview of similar phenomena, the reader is referred to [Citation8,Citation11,Citation17].
3.2.0.3 Region:
As the boosting rate increases, the middle supercritical Hopf points and
(observed in the previous region) get closer to each other, finally collide and we obtain a single endemic bubble, Figure .
Figure 8. (a) Bifurcation diagram w.r.t. α, when ; (b) Zoom of (a) close to the vertical line
.
3.2.0.4 Region:
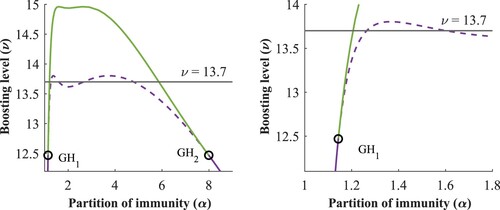
As ν continues to grow in the two-parameter plane in Figure , two generalized Hopf points, and
, appear. They separate branches of sub- and supercritical Hopf bifurcations in the parameter plain. The stable limit cycles survive when we enter region
. Crossing the subcritical Hopf boundary
creates an extra unstable cycle inside the first one, while the equilibrium regains its stability. Two cycles of opposite stability exist inside the bistable region
and disappear at the green curve.
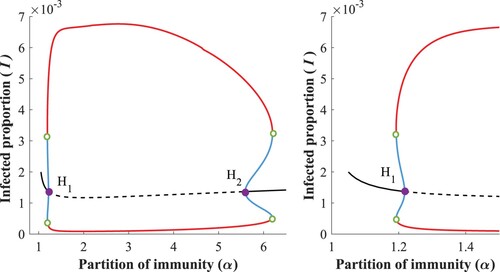
When we pass the generalized Hopf points and fix a ν in this region, then Figure shows a typical bifurcation w.r.t. α. Observe here the two small α-parameter ranges of bistability where the EE and the larger amplitude periodic solution are both stable. The points marked with green circle are limit points of periodic orbits. The stable and unstable cycles collide and disappear on the green curve in Figure , corresponding to a fold bifurcation of cycles.
Figure 9. Bifurcation diagram w.r.t α, with (left) and zoom into the bistable region around
(right).
3.2.0.5 Region:
As we increase the boosting value, the dynamics is changing, as observed on the shape of the subcritical Hopf curve in Figure and the heat map in Figure (b).
Figure 10. Two-parameter bifurcation diagram, bistability region.
In Figure , the bifurcation diagram confirms the existence of four subcritical Hopf bifurcation points. Here a small bubble appears inside the region of stable oscillations, which leads to an additional bistable region compared to the previous case.
Figure 11. Bifurcation diagram w.r.t α, with (left) and zoomed into the bubble (right).
When we increase the boosting in this region, i.e. still intersecting the subcritical Hopf curve, the Hopf points and
as well as
and
move closer to each other, resulting in larger bistability regions, see also the heatmap Figure (b).
3.2.0.6 Region:
As we enter this region we leave and do not intersect any Hopf branches, hence, the continuation method utilized so far leaves us with a single stable equilibrium, Figure .
Figure 12. There are no bifurcations of equilibria when .
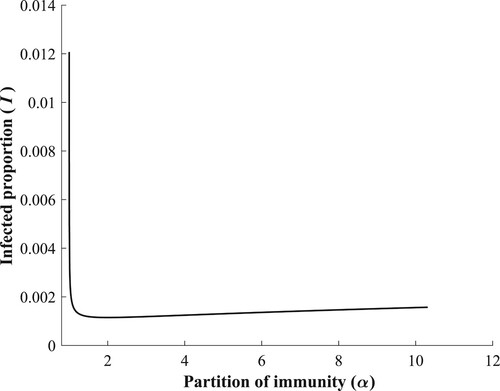
There is however, a range of ν values in this region that belong to , as observed in Figure . For a better demonstration of the shape of the limit cycle branch, see Figure . The coordinates of the critical points can be found in Table .
Figure 13. Branch of the limit points of periodic solutions.
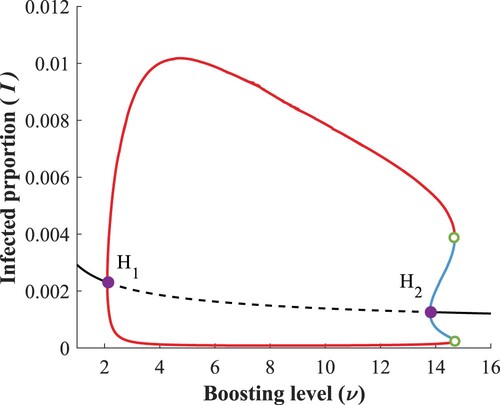
Considering the heatmaps in Figure , it was natural to investigate regions in the two parameter plane where ν is constant and look at bifurcations with respect to α. To capture the extension of the bistability region in the ν direction we can investigate the dynamics for α fixed and consider the boosting rate ν as the bifurcation parameter. For a typical setting see Figure .
Figure 14. Bifurcation diagram w.r.t. ν, when .
4. Conclusions
We generalized previous compartmental SIRWS models of waning and boosting of immunity by allowing different expected durations for individuals being in the fully immune compartment R and being in the waning immunity compartment W, from where their immunity can still be restored upon re-exposure. We proposed an asymmetric division of the immunity period in the SIRWS model to these two phases, characterized by a newly introduced bifurcation parameter. Other parameters were chosen to mimic pertussis. We observed and established a new symmetry in these divisions around the critical case of equal partitioning when analysing the stability criterion of the endemic equilibrium. This, combined with numerical bifurcation methods, enabled us to characterize the model dynamics for a relevant range of parameter values. We composed global bifurcation diagrams, and found complex and rich dynamics where stability switches, Hopf bifurcations, folds of periodic branches appeared, forming interesting structures in the parameter space. We found double endemic bubbles as well as regions of bistability. Note that in our model (similarly to most previous waning-boosting models [Citation5,Citation18]), the interesting dynamics occurs in the case , which corresponds to the assumption that the probability of a partially immune person getting boosted is larger than that of a susceptible person contracting the infection.
This study confirmed that simple looking SIRWS ODE models can have very intricate dynamics. Our analysis highlighted that the division of the immunity period into maximally immune and boostable phases is a key parameter, which significantly determines the dynamics of the system. As a consequence, future epidemiological studies should attempt to estimate this quantity to have a better description of the influence of waning-boosting mechanisms on epidemic outcomes.
Disclosure statement
No potential conflict of interest was reported by the author(s).
Additional information
Funding
References
- M.V. Barbarossa, M. Polner and G. Röst, Stability switches induced by immune system boosting in an SIRS model with discrete and distributed delays, SIAM J. Appl. Math. 77(3) (2017), pp. 905–923.
- M.V. Barbarossa and G. Röst, Immuno-epidemiology of a population structured by immune status: A mathematical study of waning immunity and immune system boosting, J. Math. Biol. 71(6) (2015), pp. 1737–1770.
- J. Carr, Center manifold, Scholarpedia 1 (2006), pp. 1826.
- C. Castillo-Chavez and B. Song, Dynamical models of tuberculosis and their applications, Math. Biosci. Eng. 1(2) (2004), pp. 361–404.
- M.P. Dafilis, F. Frascoli, J.G. Wood and J.M. McCaw, The influence of increasing life expectancy on the dynamics of SIRS systems with immune boosting, The ANZIAM J. 54(1–2) (2012), pp. 50–63.
- A. Dhooge, W. Govaerts and Y.A. Kuznetsov, MATCONT: A Matlab package for numerical bifurcation analysis of ODEs, SIGSAM Bull. 38(1) (2004), pp. 21–22.
- H. Jardón-Kojakhmetov, C. Kuehn, A. Pugliese and M. Sensi, A geometric analysis of the SIR, SIRS and SIRWS epidemiological models, Nonlinear Anal.: Real World Appl. 58 (2021), pp. 103220.
- T. Krisztin and E. Liz, Bubbles for a class of delay differential equations, Qual. Theory Dyn. Syst. 10 (2011), pp. 169–196.
- Y.A. Kuznetsov, Elements of Applied Bifurcation Theory, Springer, New York, 2004.
- J.S. Lavine, A.A. King and O.N. Bjørnstad, Natural immune boosting in pertussis dynamics and the potential for long-term vaccine failure, PNAS. 108(17) (2011), pp. 7259–7264.
- V.G. LeBlanc, A degenerate Hopf bifurcation in retarded functional differential equations, and applications to endemic bubbles, J. Nonlinear Sci. 26 (2016), pp. 1–25.
- T. Leung, P.T. Campbell, B.D. Hughes, F. Frascoli and J.M. McCaw, Infection-acquired versus vaccine-acquired immunity in an SIRWS model, Infect. Dis. Model. 3 (2018), pp. 118–135.
- T. Leung, B.D. Hughes, F. Frascoli and J.M. McCaw, Periodic solutions in an SIRWS model with immune boosting and cross-immunity, J. Theor. Biol. 410 (2016), pp. 55–64.
- M. Liu, E. Liz and G. Röst, Endemic bubbles generated by delayed behavioral response – global stability and bifurcation switches in an SIS model, SIAM J. Appl. Math. 75(1) (2015), pp. 75–91.
- J.D. Murray, Mathematical Biology: I. An Introduction, Springer, New York, 2002.
- E.J. Routh, A Treatise on the Stability of a Given State of Motion: Particularly Steady Motion, Macmillan and Co., London, 1877.
- N. Sherborne, K.B. Blyuss and I.Z. Kiss, Bursting endemic bubbles in an adaptive network, Phys. Rev. E. 97(4) (2018), pp. 042306.
- L.F. Strube, M. Walton and L.M. Childs, Role of repeat infection in the dynamics of a simple model of waning and boosting immunity, J. Biol. Syst. 29(2) (2021), pp. 303–324.
- S. Wiggins, Introduction to Applied Nonlinear Dynamical Systems and Chaos, Springer, New York, 2003.
- S. Wiggins, Global Bifurcations and Chaos: Analytical Methods, Springer, New York, 2013.
Appendices
A.1. Derivation of the formula for
We now derive the formula for used in Section 2. As we have seen, substituting the formulae for
and
into (Equation4c
(4c)
(4c) ), we obtain the quadratic equation
with coefficients
The y-intercept C may be simplified as
Then, the solution formula gives
(A1)
(A1) We split (EquationA1
(A1)
(A1) ) into two parts and evaluate them separately.
Then, the other term in (EquationA1
(A1)
(A1) ) is
with
Hence,
Recombining the two terms yields the formula
A.2. Transcritical bifurcation of forward type
For the sake of completeness, we include a slightly adjusted version of Theorem 4.1. from Castillo–Chavez and Song [Citation4].
Theorem A.1
Let and consider the system of ordinary differential equations
with b as a parameter. Assume that
is an equilibrium point, i.e.
for all
. In addition, assume the following:
| (i) | The linearization of the system at | ||||
| (ii) | The matrix A has a non-negative right eigenvector w and a left eigenvector v corresponding to the zero eigenvalue. | ||||
Let be the k-th component of f and define
If
and
, then as b changes from negative to positive, the equilibrium
changes its stability from stable to unstable. At the same time, a negative unstable equilibrium becomes positive and locally asymptotically stable. Hence, a forward bifurcation occurs at b = 0.
A.3. Transformation of
The alternative, simpler form of , used in Section 2.2.1, is obtained as follows.
We now present two Lemmas on derivatives of function compositions. The first is a version of the classical result by Faà di Bruno generalizing the chain rule.
Lemma A.1
Faà di Bruno
Let and
be analytic functions, where
are connected subsets. Consider the Taylor expansions
centred at
with
and
centred at
for
. Then, the composite function
attains the Taylor expansion
centred at
with the coefficients
where
and
are nonnegative integers.
Using the results of Lemma A.1 and assuming that the inner function has a vanishing first derivative and the outer function has a cascade of vanishing derivatives, the following Lemma establishes a similar property for the composite function.
Lemma A.2
Assume that f and g are as in Lemma A.1 and that . Then,
| (a) |
| ||||
| (b) | if | ||||
| (c) | if | ||||
Proof.
The claims directly follow from Lemma A.1 by noting that in the formula of , for terms with
, the inequality
must hold, hence, any such term must evaluate to zero.
A.4. Asymptotic behaviour of equilibria
The analytic computations of the behaviour of the equilibria of SIRWS system for large and small boosting (ν)
Here, we consider the behaviour of the equilibria as
and
As a remark, the limit as
and as
are the same.
and lastly,
A.5. Numerical values of marked bifurcation points
Table A1. Critical points on the contour as marked in Figure and critical points on the limit cycles branch as marked in Figure .
Table A2. Critical GH points as marked in Figure .