
 ?Mathematical formulae have been encoded as MathML and are displayed in this HTML version using MathJax in order to improve their display. Uncheck the box to turn MathJax off. This feature requires Javascript. Click on a formula to zoom.
Abstract
Diabetes mellitus is a noncommunicable disease, which is a serious threat to human health around the world. In this paper, we propose a simple glucose–insulin model with Michaelis–Menten function as insulin degradation rate to mimic the pathogenic mechanism of diabetes. By theoretical analysis, a unique positive equilibrium of model exists and it is globally asymptotically stable. The four strategies are designed for diabetes patients based on the sensitivity of parameters, including insulin injection and medicine treatments. Numerical simulations are given to support the theoretical results.
Keywords:
1. Introduction
Diabetes mellitus is a chronic and complex metabolic illness characterized by high blood glucose level for long duration, which is one of the prevalent diseases affecting millions of persons around the world nowadays. Long-term hyperglycemia also leads to many other problems of organs of the body, such as cardiovascular disease, diabetes feet, cataract, nephropathy and neuropathy and so on. By the World Health Organization (WHO) and the International Diabetes Federation (IDF) criterion, there are four types: Type 1 diabetes (T1DM), Type 2 diabetes (T2DM), gestational diabetes and other specific types of diabetes, in which the T1DM and T2DM account for above 95%. T1DM is considered to be an autoimmune disorder because the β cells in the pancreas are damaged and cannot secrete insulin. T2DM is considered to be the result of insulin resistance, which the β cells cannot produce enough insulin relatively or the secreted insulin has no ability to decompose glucose correctly [Citation1]. In view of large proportion of T1DM and T2DM, we only focus on the two types in the paper.
How to judge a person to get the diabetes mellitus? Generally speaking, early typical symptoms include polyuria, thirst, more food and weight loss. The common glucose diagnostic tests in clinical practice are intravenous glucose tolerance test (IVGTT) and oral glucose tolerance test (OGTT). IVGTT is a test in which glucose is injected intravenously and blood samples are collected following the glucose injection [Citation2], and OGTT is a test in which glucose is given orally and blood samples are collected over 2 hours following the glucose infusion [Citation3]. If fasting blood glucose value is greater than 7 and the value is higher than 11.1
2 hours after meals, it can be identified as diabetes mellitus. From these tests, doctors can obtain some indexes, such as insulin sensitivity, glucose effectiveness, insulin action, β cells function and so on, which can be used to diagnose disease and give some treatment measures. The current therapies are mainly hypodermic insulin injections and oral hypoglycemic drugs, which could be used to treat the symptoms, but the character of diabetes dynamics is still not fully understood. Therefore, the work of studying diabetes is necessary and urgent.
In the last several decades, many mathematical models about glucose-insulin regulatory system have been developed and analysed, and some good results have been obtained [Citation4–10]. Bolie [Citation4] is considered as the pioneer to study glucose–insulin dynamics. He developed a minimal model to mimic blood glucose regulation. The model was written as
where x and y represent the deviation in insulin and glucose concentration from mean physiological value, α denotes the sensitivity of insulinase activity to elevate insulin concentration, β denotes the sensitivity of pancreatic insulin to elevate glucose concentration, δ and γ represent the combined sensitivity of liver glycogen storage and tissue glucose utilization to elevate insulin and glucose concentration respectively. The author studied the model and evaluated the values of four coefficients and their biological variations, and the results were used to manage the diabetes.
Based on Bolie's work, a lot of different kinds of mathematical models have appeared for studying the glucose–insulin regulatory system. Gaetano and Arino [Citation5] proposed a ‘dynamical model’ with delay. They studied the stability of unique equilibrium and gave the positive and bounded of solutions. The dynamical model overcame the limitations of coupled minimal model and was more attractive physiologically because of delay. [Citation6–10] also studied the glucose–insulin models with delay and obtained some good conclusions. Lombarte et al. [Citation11] developed a glucose–insulin model for the homeostasis of glucose in diabetic rats. They obtained corresponding parameters from the values of glucose and insulin in blood and urine. For more related studies, see [Citation12–14] and references therein.
Lots of good progress have been made in studying the glucose–insulin regulatory systems, but there are still some shortcomings. For example, some parameters are not identifiable or fit to experimental data poorly [Citation15]. Generally speaking, once diagnosed with diabetes, the patients will be advised to inject the insulin for controlling the level of glucose. However, how doctors decide the level of insulin injection? There is no uniform available formula. To solve this problem, many works were done for searching suitable strategies. For example, Maianti et al. [Citation16] hypothesized using insulin degradation enzyme to improve glucose tolerance for T2DM. Huard et al. [Citation17] studied a deterministic nonlinear model with two delays and explored four strategies for restoring healthy regulation. In this paper, we expect to find some methods to maintain glucose in normal level by mathematical models and obtain more efficient and economic therapies for diabetics.
This paper is organized as follows: in Section 2, the model about glucose and insulin will be proposed. In Section 3, the basic properties of the model will be given, such as positivity and boundedness of solutions. The conditions of local and global stability of equilibrium are established applying characteristic roots and Lyapunov function in Section 4. The sensitivity of parameters is studied in Section 5 and four corresponding strategies are proposed in Section 6. In the last section, we discuss our results and make a brief summary.
2. Model
As well known, the typical exogenous infusions of glucose come from carbohydrate in daily life, which include cereals and meat ingestion and so on. They afford energy to maintain all kinds of complex life activities. The consumption ways of glucose have two aspects: one is insulin-independent glucose consumers, such as brain, another is insulin-dependent glucose consumers, such as muscle and so on. The insulin includes synthetic insulin and secreted by β cells in pancreas. The raised blood glucose level stimulates β cells in the pancreas to secret insulin which helps the decomposition of glucose. In this paper, we use denotes plasma glucose concentration (mg/dl) and
denotes plasma insulin concentration (μU/ml).
and
denote the glucose intake rate and the exogenous insulin infusion rate which are all constants, respectively.
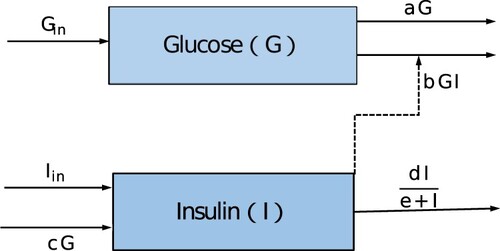
In existing glucose–insulin models, the response functions of insulin clearance are assumed to be proportional to insulin concentration [Citation7–10]. The assumption may be inadequate for looking for more appropriate diagnosis and cure strategies. As pointed out in [Citation10], the change rate increases with the increasing resource but does not increase indefinitely even if the resource is excess. So they considered an enhanced modelling of the glucose–insulin system, in which the insulin degradation rate is Michaelis–Menten function , where d is the maximum insulin clearance rate and e is the half-saturation value. It is more realistic than linear rate. Motivated by the work of [Citation10], a glucose–insulin model is built. The model structure is shown in Figure , and the complete model is given as follows.
(1)
(1) with initial conditions
. The meaning of parameters is showed in Table .
Table 1. The state variables for model (Equation1(1)
(1) ).
Figure 1. The glucose–insulin system diagram.
3. The basic properties of model (1)
In view of the biological meaning, the variables of the model (Equation1(1)
(1) ) must be positive for all time. In the following, the positivity and boundedness of solutions of model (Equation1
(1)
(1) ) will be given.
To study the properties of the steady state of model (Equation1(1)
(1) ), the equilibria of system should be determined first. Let the right of model (Equation1
(1)
(1) ) is equal to zero, that is
(2)
(2) When
, there exists a unique positive equilibrium
, where
and
Lemma 3.1
For model (Equation1(1)
(1) ), all solutions with initial conditions are positive; furthermore, all solutions are bounded for t>0 if
and
.
Proof.
Let is the solution of model (Equation1
(1)
(1) ). If
, then there exists a
such that
and
.
But
this is a contradiction. So
for t>0. By the same argument,
for t>0.
From model (Equation1(1)
(1) ), we have
so
if
, that is
is bounded for all t>0.
The second equation of model (Equation1(1)
(1) ) is changed as
Obviously, if
, then
. In fact, by Lemma 2.2 in [Citation10], with the condition
, we can get
therefore
is bounded for all t>0. The proof is complete.
4. The stability of equilibrium
In this section, the local and global stabilities of equilibrium of model (Equation1(1)
(1) ) will be established.
Suppose is an arbitrary equilibrium of model (Equation1
(1)
(1) ), then the Jacobian matrix of model (Equation1
(1)
(1) ) at
is
the corresponding characteristic equation of the model (Equation1
(1)
(1) ) at
is
then
It is easy to obtain that two characteristic roots have negative real parts, then the unique positive equilibrium
is locally asymptotically stable if
.
Next, we will establish the global asymptotical stability of equilibrium under the existence condition by constructing a suitable Lyapunov function.
Theorem 4.1
The positive equilibrium of model (Equation1
(1)
(1) ) is globally asymptotically stable if
.
Proof.
Define a Lyapunov function as follows:
then we calculate the derivative of
along the solution of model (Equation1
(1)
(1) ).
It is obvious that
holds if and only if
and
, then the unique positive equilibrium
is globally asymptotically stable if
.
5. The sensitivity of parameters
Sensitivity of parameters is a useful tool to study the variations of parameters qualitatively and quantitatively. To find out the effect of parameters on the equilibrium , we first discuss the relationships of parameters
and equilibrium
. The method is differentiating implicitly Equation (Equation2
(2)
(2) ) with respect to
and d, respectively. We always denote the derivative x with respect to t as
.
5.1. The relationships of b, c, d and 
that is
Since
, then
The result indicates
and
will decrease with increased b, which implies that improving the insulin-dependent utilization rate could reduce the glucose
and insulin
.
that is
Since
, then
It is obvious that
decreases with increased c, and
increases with increased c. The result indicates if the secretion ability of insulin enhances, then the insulin level must increase and the glucose level becomes less.
that is
Since
, then
According to the direct calculation, the level of
will increase with increased d, but
will increase with decreased d. Therefore, increasing the maximum insulin clearance rate can improve the glucose concentration
and reduce the insulin concentration
.
5.2. Sensitivity indices of
In the subsection, we discuss the sensitivity indices of to parameters
by the method of [Citation18,Citation19]. The sensitivity indices can be used to measure the relative change of a state variable as a parameter changes.
Definition 5.1
The normalized forward sensitivity index of a variable u that depends differentiable on a parameter p is defined as
Now, we calculate the normalized forward sensitivity indices as follows:
where
. By direct calculation, it is easy to obtain
The results show that the size of the increase in
will lead to a smaller size of the decrease in
.
is more sensitive to change d than b, and
is more sensitive to change c than b. In view of the absolute values, we can get the size of changing
is larger than
with changing the same proportion of d as well as c.
6. The strategies and numerical stimulations
The purpose of this paper is to attempt to control the glucose level G in normal range by changing some parameters, and we hope to find some treatments which could be applied clinically according to our model. For diabetic patients, the plasma glucose is higher than healthy persons, then a natural advice is to eat less carbohydrates, i.e. the is decreased. Relative to insulin-independent utilization rate a, we are more concerned about other parameters b, c and d, which can affect the state of glucose level. Then we always fix parameter a as a constant. In addition, we are also concerned about the effect of insulin dose on blood glucose. In the following, we always adopt the glucose standards announced by WHO (1999) that the value of normal glucose range is
after fasting and below
after postprandial 2 hours [Citation20]. To illustrate the theoretical results, some numerical simulations are displayed in Figures and . Some of the values of parameters are taken in the reference [Citation10,Citation15], and the units of the parameters are converted as needed. Four strategies are designed as follows.
Figure 2. The glucose level is affected by insulin dose injected, insulin resistance, insulin secretion and clearance rate. (a) The glucose level changes with the insulin injection when fixing parameters . (b) The glucose level changes with the insulin resistance if no insulin injection and c = 0.2298, d = 1500. (c) The glucose level changes with the insulin secretion if no insulin injection and
. (d) The glucose level changes with the insulin clearance rate if no insulin injection and
.
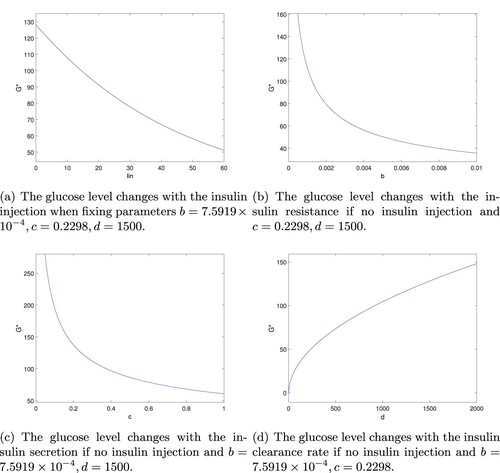
Figure 3. Solution trajectories of the model (Equation1(1)
(1) ) with respect to the subjects data [Citation15]. (a) The glucose level changes with different dose insulin injection for subject Female 3:
. (b) The glucose level changes with different dose insulin for mean of five subjects:
.
![Figure 3. Solution trajectories of the model (Equation1(1) {dGdt=Gin−aG−bGI,dIdt=Iin+cG−dIe+I,(1) ) with respect to the subjects data [Citation15]. (a) The glucose level changes with different dose insulin injection for subject Female 3: a=0.0002,b=7.5919×10⁻⁴,c=0.2298. (b) The glucose level changes with different dose insulin for mean of five subjects: a=0.0309,b=1.6089×10⁻⁴,c=0.452725.](/cms/asset/daf100d0-a99d-4aff-8c79-4a289a32e137/tjbd_a_2146769_f0003_oc.jpg)
Strategy 1: Adjust the dose of insulin injections.
For T1DM, because their damaged β cells secret insulin hardly, the artificial insulin injection will stay with them for the rest of their lives to help decomposing glucose, as well as some T2DM are also recommended to inject insulin in current cure process. So we first consider how to adjust the dose of insulin injection to obtain the normal glucose range. For fixed , we can obtain
from first equation of (Equation2
(2)
(2) ) and substitute it into second equation of (Equation2
(2)
(2) ), we have
The result indicates that
is able to keep in normal range by adjusting the injection dose of
(see Figure a). The profile shows
decreases as the insulin dosage
increases.
For T2DM, their β cells secret insulin, but there are two cases that the glucose cannot be broken down properly. One is the secreted insulin is not enough, another is the insulin resistance occurs unusually through there are enough insulin (even excess). Therefore, under the condition of no insulin injection, we focus on the situation and design three strategies for T2DM.
Strategy 2: Control the insulin resistance.
Suppose there is no insulin injection, i.e. , for fixed
, it is easy to see
In combination with the relationship of b and
in Section 5, it indicates that improving the ability of insulin resistance b could help decreasing the concentration of
(see Figure b). Currently, the main drug used to improve insulin sensitivity is metformin and analogue.
Strategy 3: Stimulate insulin secretion.
Suppose there is no insulin injection, i.e. , for fixed
, we have
The structure of the formula shows the insulin secretion rate c could affect the glucose
. If the rate c can be adjusted, then the level of
can be controlled in normal value (see Figure c). Glimepiride is used to stimulate insulin secretion widely, as well as gliclazide and so on.
Strategy 4: Adjust the insulin clearance rate.
From the second equation of (Equation2(2)
(2) ), we have
. Still consider there is no insulin injection, i.e.
, and substitute it into the first equation of (Equation2
(2)
(2) ), it is easy to get
The result indicates that can be controlled in normal value by adjusting the maximum insulin clearance rate d (see Figure d).
To illustrate the effects of dosage insulin injected on plasma glucose, we take the data from subject Female 3 and mean of five subjects for example [Citation15]. We set . In Figure (a), take the data of subject Female 3
, and give
, then the corresponding
is 128.052, 117.526, 107.912, 91.2907. Obviously, if there is no insulin injected,
is above the normal glucose. Once given insulin, the level of glucose will be controlled in proper range. In Figure (b), we take
, and still give
respectively, then the corresponding
is
. To sum up, the insulin plays an important part in decreasing the level of glucose. Clinically, measuring diabetics patient's insulin index value and determining the dose of extracorporeal insulin will contribute to adjust glucose more precisely.
Remark: For the patients with T1DM, they only have a quite small portion of intact β cells, which lead to very little insulin secreted. Then it is reasonable to assume the insulin secretion rate c is close to zero. Based on this case, to keep glucose G in the normal range, insulin injection has become the preferred therapy for T1DM so far clinically. For T2DM, the insulin secreted by β cells is not enough to help decomposing glucose, so the secretion rate [Citation10,Citation21]. Under the circumstances, the early T2DM patients can take some medicines such as melbine, gliclazide and glimepiride and so on, which is able to help secreting insulin or increasing insulin sensitivity. Once those medicines are out of action, they need to inject insulin for controlling glucose in the desirable range.
7. Summary and discussion
For diabetics patients, the main aim is to adjust the glucose level in normal range without changing the life style of patients. As well known, the current therapies are mainly insulin injections and oral hypoglycemic drugs, such as metformin, gliclazide and so on. The treatment mechanisms of these medicines are different. With the help of artificial insulin, we can control the glucose level easily, but hypoglycemia and hyperglycemia appear if the dose of insulin is not right. Therefore, it is very important that how to regulate insulin better in the treatment of diabetes. Undoubtedly, patients with type 1 diabetes need to inject insulin daily because of deficient insulin production absolutely. The insulin pump is the most advanced way of insulin administration for T1DM currently. Patients with type 2 diabetes are called non-insulin-dependent because the pancreas does not produce enough insulin or the body cannot use the secreted insulin effectively. For early T2DM, some of them are always advised to inject insulin in current clinical practice. Is the insulin injection unique and best way? Actually, lots of experiments show that the level of plasma glucose could be affected by individual diabetics patient factors, such as weight, age, food-intake, exercise and sensitivity to insulin. In addition, for individual patient, the time taken to absorb one-half of an injected dose of insulin also may change by 25–50% [Citation22]. For them, if there are some treatments that do not use insulin injection, then the financial burden and physiological pain are both alleviated. In [Citation10], authors considered and
were positive periodic functions and mimicked pancreatic insulin secretion by exogenous insulin infusions. Their results illustrated the preprandial insulin could better control the postprandial glucose level. But they did not mention other factors affecting glucose control. Nevertheless, who are suitable for insulin injections and who are suitable for oral medicines, there is no uniform standard. Therefore, it is especially important to design personalized treatments for different individuals. With proper insulin treatments, patients can maintain plasma glucose within a normal range but hypoglycemia and hyperglycemia could not happen. In the paper, we attempt to design optimal therapies which could help the patients to reduce pain and achieve the best hypoglycemic effect. A glucose–insulin regulatory model (Equation1
(1)
(1) ) with Michaelis–Menten function as insulin degradation rate is studied analytically and numerically. We have shown that it is generally possible to individually alter these parameters b, c and d to stabilize average glucose levels except injecting insulin
for T2DM. Therefore, they can avoid the pain of subcutaneous insulin injections daily before their β cells loss functions completely. According to different situations, the doctors could choose one of above four strategies or a combination of treatments discussed in Section 6 for serious diabetic patients. We also point out that the liver provides glucose when the hypoglycemia happens. This is a more complex dynamic which is worth studying in our future work.
Disclosure statement
No potential conflict of interest was reported by the author(s).
Additional information
Funding
References
- NHS, 2014 (accessed 11th December 2015). NHS Choices – Health A-Z – Diabetes. Available at http://www.nhs.uk/Conditions/Diabetes/Pages/Diabetes.aspx
- R.N. Bergman, Y.Z. Ider, C.R. Bowden, and C. Cobelli , Quantitative estimation of insulin sensitivity, Am. J. Phys. 236 (1979), pp. 667–677.
- E. Ackerman, J.W. Rosevear, and W.F. McGucking, A mathematical model of the glucose tolerance test, Phys. Med. Biol. 9 (1964), pp. 203–213.
- V.W. Bolie, Coefficients of normal blood glucose regulation, J. Appl. Physiol. 16 (1961), pp. 783–788.
- A. De Gaetano and O. Arino, Mathematical modelling of the intravenous glucose tolerance test, J. Math. Biol. 40 (2000), pp. 136–168.
- J. Yang, S. Tang, and A. Robert, The regulatory system for diabetes mellitus: Modeling rates of glucose infusions and insulin injections, Commun. Nonlinear Sci. Numer. Simul. 37 (2016), pp. 305–325.
- J. Li, Y. Kuang, and C. Mason, Modeling the glucose-insulin regulatory system and ultradian insulin secretory oscillations with two time delays, J. Theor. Biol. 242 (2006), pp. 722–735.
- B. Topp, K. Promislow, G. Devries, R.M Miura, and D.T Finegood, A model of β-cell mass, insulin, and glucose, J. Theor. Biol. 206 (2000), pp. 605–619.
- H. Wang, J. Li, and Y. Kuang, Mathematical modeling and qualitative analysis of insulin therapies, Math. Biosci. 210 (2007), pp. 17–33.
- H. Wang, J. Li, and Y. Kuang, Enhanced modelling of the glucose-insulin system and its applications in insulin therapies, J. Biol. Dyn. 3(1) (2009), pp. 22–38.
- M. Lombarte, M. Lupo, L. Fina Brenda, G. Campetelli, A.R. Buzalaf Marilia, M. Basualdo, and A. Rigalli, In vivo measurement of the rate constant of liver handling of glucose and glucose uptake by insulin-dependent tissues, using a mathematical model for glucose homeostasis in diabetic rats, J. Theor. Biol. 439 (2018), pp. 205–215.
- B. Huard, J. Easton, and M. Angelova, Investigation of stability in a two-delay model of ultradian oscillations in glucose-insulin regulation, Commun. Nonlinear Sci. Numer. Simul. 26 (1–3) (2015), pp. 211–222.
- I.M. Tolic, E. Mosekilde, and J. Sturis, Modeling the insulin-glucose feedback system: The significance of pulsatile insulin secretion, J. Theor. Biol. 7(2000), pp. 361–375.
- K. Engelborghs, V. Lemaire, J. Bélair, and D. Roose, Numerical bifurcation analysis of delay differential equations arising from physiological modeling, J. Math. Biol. 42(4) (2001), pp. 361–385.
- M. Pitchaimani, P. Krishnapriya, and C. Monica, Mathematical modeling of intravenous glucose tolerance test model with two discrete delays, J. Biol. Syst. 23(4) (2015), pp. 1550031.
- J.P. Maianti, A. McFedries, Z.H. Foda, R.E. Kleiner, X.Q. Du, M.A. Leissring, Wei-Jen Tang, M.J.Charron, M.A. Seeliger, A. Saghatelian, and D.R. Liu, Anti-diabetic activity of insulin-degrading enzyme inhibitors mediated by multiple hormones, Nature 511 (7507) (2014), pp. 94–98.
- B. Huard, A. Bridgewater, and M. Angelova, Mathematical investigation of diabetically impaired ultradian oscillations in the glucose-insulin regulation, J. Theor. Biol. 418 (2017), pp. 66–76.
- N. Chitnis, J.M. Hyman, and J.M. Cushing, Determining important parameters in the spread of malaria through the sensitivity analysis of a mathematical model, B. Math. Biol. 70 (2008), pp. 1272–1296.
- L. Arriola and J. Hyman, Lecture notes, forward and adjoint sensitivity analysis: with applications in dynamical systems, Linear Algebra Optim. Math. Theor. Biol. Inst., 2005, Summer
- Chinese Diabetes Society, Guideline for the prevention and treatment of type 2 diabetes mellitus in China (2020 edition). Chin. J. Diabetes Mellitus 13 (4) (2021), pp. 320
- J.A. Mayfield and R.D. White, Insulin therapy for type 2 diabetes: Rescue, augmentation, and replacement of β-cell function, Am. Fam. Physician 70 (2004), pp. 489–500.
- I.B. Hirsch, Type 1 diabetes mellitus and the use of flexible insulin regimens, Am. Fam. Physician 60 (1999), pp. 2343–2352. 2355–2356.