
ABSTRACT
Automated trading, which is also known as algorithmic trading, is a method of using a predesigned computer program to submit a large number of trading orders to an exchange. It is substantially a real-time decision-making system which is under the scope of Enterprise Information System (EIS). With the rapid development of telecommunication and computer technology, the mechanisms underlying automated trading systems have become increasingly diversified. Considerable effort has been exerted by both academia and trading firms towards mining potential factors that may generate significantly higher profits. In this paper, we review studies on trading systems built using various methods and empirically evaluate the methods by grouping them into three types: technical analyses, textual analyses and high-frequency trading. Then, we evaluate the advantages and disadvantages of each method and assess their future prospects.
1. Introduction
Automated trading system is a kind of decision-making systems based on the massive amounts of enterprise information. The dependability and performance of such a system is highly related to the efficiency of big data analysis and modelling. Predicting price movements in stock, commodity and other derivative markets has always been a challenging task that draws great interest from researchers and investors and is affected by myriads of factors ranging from macroeconomics to the participant’s sentiment. Models have been built to solve the problem of future price predictions to guide investments, and these models can be classified as two types: fundamental analysis and technical analysis. Fundamental analysis is concerned with the intrinsic value of corporate stocks (Lev and Thiagarajan Citation1993) and considers the past performance and future expectation of a specific corporation as well as the political climate and economic environment. Technical analysis tends to neglect fundamental information and concentrates simply on exploiting past market data, especially price and volume data. The technical analysis method assumes that history will repeat itself; therefore, the main principle is to transform the data into certain technical indicators, chart patterns or other statistical features and then generate specific trading rules for purchases or sales, including time and price. The academic finance community indicates that the efficiency of technical analysis (Lo, Mamaysky, and Wang Citation2000) is low compared with that of fundamental analysis. Controversies are still ongoing, and diverse opinions have been reached (Park and Irwin Citation2007). Regardless, technical analysis has been adopted by most of the automated trading systems in practical use. For convenience, we consider all exchange data-oriented strategies to be under the umbrella term ‘technical analysis’.
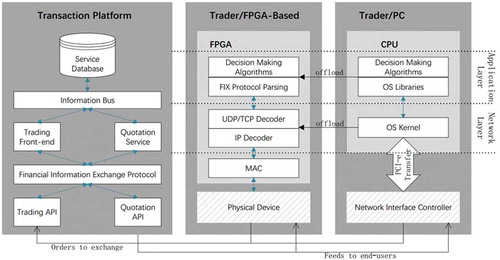
Figure 2. Exchange transaction platform (left), FPGA-based trading systems (middle) and unoptimized PC trading systems(right). Offloading the application layer and network layer from CPU to FPGA will largely reduce the latency.
In this paper, we present an overview of trading strategies and systems in various branches. The remainder of our paper is organized as follows. Section 2 reviews studies of technical analysis-based trading systems, and we consider classical methods based on recent findings and highlight the application of machine learning algorithms. Section 3 reviews studies of fundamental analysis-based trading systems, and we emphasize the systems that focus on textual analysis since most of the influential news information is transmitted in the form of a text data stream. Beyond that, textual analysis plays an important role in the scope of behavioral finance which attempts to measure the market irrationality from angles of participants’ psychology, beliefs and preferences (Barberis and Thaler Citation2003). In most cases, textual methods work as an effective supplementary factor and are generally integrated into a comprehensive trading system. Different models within different contexts will be briefly discussed. Section 4 discusses high-frequency trading (HFT), which is not a specific strategy or algorithm but refers mainly to a set of techniques that primarily involve telecommunication and hardware acceleration to enable the systems to trade with ultralow latency, even for large order demands. Section 5 presents the conclusions and future work.
2. Systems based on technical analysis
The concept of automated trading originated in the 1970s shortly after the introduction of the Designated Orders Turnaround (DOT) system (Grossman Citation1988). Earlier technical analysis-based algorithms were built by simply replicating human trading behavior using traditional technical indicators, such as the Moving Average (MA), Relative Strength Index (RSI), and Bollinger bands (BOLL). These indicators can provide incremental information (Lo, Mamaysky, and Wang Citation2000) for a trading system and are still effective and widely used today. Nevertheless, these indicators have obvious defects due to their instability, large drawdown, poor generalization ability and susceptibility to environmental change. Yu et al. (Citation2013) demonstrated that simple technical trading rules are less profitable as markets become more efficient. Advanced techniques have been developed to improve performance, and the PairS Trading (PST) and machine learning strategies are the two branches that receive the most attention, and they will be discussed in detail in this article. In addition, technical analysis methods, such as regression analysis, are commonly used for data mining and preprocessing to explore the relationship between multiple factors and the asset price (Chen and Fang Citation2013).
2.1. Pairs trading
The concept of PST is very simple and is characterized as a statistical arbitrage. Univariate PST is conducted by a two-step process. The first step is the formation period, in which a pair of financial instruments is identified whose prices maintained a comoving relationship over a certain historical period of performance. The second step is the trading period; in this period, as the two prices diverge abnormally and the spread reaches a predefined threshold, short the outperforming price, long the underperforming price, hold the positions in opposite directions simultaneously, and then close the positions when the prices converge to the equilibrium. Univariate PST could be extended to multivariate PST by focusing one set of financial instruments against another.
A majority of available academic papers are related to pairs identification. The distance method, i.e. simple/naive pairs trading, is regarded as the classical baseline of PST. In this method, trading pairs are formed by selecting stocks at a minimum Euclidean distance. A systematic study on the method was conducted by Gatev, Goetzmann, and Geert Rouwenhorst (Citation2006), who applied it to US equities using the CRSP (The Center for Research in Security Prices) dataset over a time range from 1962 to 2002 and yielded an 11% average annualized excess return. However, Do and Faff (Citation2010) assessed Gatev’s work using an extended period from 2002 to 2009 and reported that a distinct decrease in profitability has occurred since the 1990s. Until 2009, although the strategy showed a positive return overall, the main profit was mostly derived during bear markets from 2000 to 2002. In 2012, Do and Faff further found that the strategy earned limited profits when the transaction costs were included (Do and Faff Citation2012). These results are largely due to increasing nonconverged pairs as well as the growing realization of arbitrage opportunities. The deficiency of distance method in forming pairs is explained for lack of capability to find the optimal solution: pairs featured by strong mean-reverting meanwhile large spread volatility (Krauss Citation2017). The selection technique based on distance fails the latter. More sophisticated selections are based on cointegration and copula. The idea of applying cointegration in PST frameworks was first proposed by Vidyamurthy (Citation2004). Cointegration measures the long-term comoving relationship in prices and allows for short periods of low correlation. Huck and Afawubo (Citation2015) examined cointegrated pairs using data sampled from the S&P 500 from 2000 to 2011 and considered both risk factors and transaction costs. The research generated a high and robust alpha and confirmed that the cointegration performed much better in terms of profitability compared with the distance method and was able to select trading pairs with larger spread volatility and lower nonconvergence risk. The use of copula in the PST was introduced by Liew and Wu (Citation2013) and exhibits promising prospects because it breaks the limitation of traditional pair formation, provides an approach to interpreting nonlinear dependencies between financial assets, and hence helps to explore extra trading opportunities. Rad, Low, and Faff (Citation2016) concluded that the copula-based method produces a steady frequency of trading opportunities, although it generates relatively weak profitability compared with traditional methods. This method is still far from maturity and deserves further attention.
The PST strategy is widely applied by professional and institutional investors, especially by hedge funds, and its profit value is believed to be generated from different price movements raised by different information diffusion speeds. Therefore, a more inefficient market corresponds to a greater likelihood of gaining potential profits (Broussard and Vaihekoski Citation2012). The market-neutral aspect of the strategy is considered the most prominent characteristic, and it means that profits are made regardless of the market direction, i.e. bearish, bullish or sideways; thus, the strategy is conducive to generating abnormal returns. Although the above studies above are mostly concerned with long-term investments, PST can be effectively employed in short time windows and is an important member of HFT (Angel and McCabe Citation2013). A small number of high-frequency PST studies are compared in Nath (Citation2003); Bowen, Hutchinson, and Niall (Citation2010); Miao (Citation2014); and Salvatierra and Patton (Citation2015).
2.2. Machine learning
Time series data in financial markets are highly nonlinear, nonstationary and noisy in nature. Traditional models based on statistical methods, such as the Autoregressive Moving Average (ARMA) model, Autoregressive Integrated Moving Average (ARIMA) model, and General Autoregressive Conditional Heteroskedasticity (GARCH) model, suffer from limitations due to their linearity assumption. However, emerging machine learning algorithms provide a set of powerful tools for addressing the issue of trading system design. Among these algorithms, Artificial Neural Networks (ANNs) and Support Vector Regressions (SVRs) have been extensively researched. The universal approximation property (Park and Sandberg Citation1991) of ANNs and the nonlinear kernel within SVRs make these algorithms essentially suitable for fitting a nonlinear environment. Typical and representative works for trading systems in the surveyed papers will be discussed based on the following aspects.
2.2.1. Input and output data
In general, input variables can be classified into three major types. The first type is the raw data of a specific financial instrument. These raw data may include fine-grained data that contain extremely detailed information about orders being handled by the exchange (Kearns and Nevmyvaka Citation2013), or these data may include less-detailed data, such as opening, closing, highest, and lowest prices and transaction volumes over a certain time window. The importance of volume is discussed in Zhu et al. (Citation2008). The second and most common type consists of the diverse technical indicators calculated from raw data. Achelis (Citation2001) made a systematic list of technical indicators for common use. The development of sensitive and effective novel technical indicators is a major concern for practitioners because they are crucial for the timely discovery of trading opportunities. The last type consists of economic indicators, which are basically a price or index that has a broad influence on our perception of the entire economic environment (e.g. gold price, USD/CNY exchange rate, and NASDAQ Composite Index) (Thawornwong and Enke Citation2004). Other types of input are also observed. Shi, Da Xu, and Liu (Citation1999) and Shi, Xu, and Liu (Citation1996) proposed a nonlinear combined forecasting system using results from different forecasting models as inputs to improve the forecast accuracy.
The total number of input variables varies over a large range, whereas the output is relatively simple and is classified via BUY, SELL, HOLD or BUY, SELL trading signals or the predicted price over a fixed period of time (e.g. closing price 3 days after).
2.2.2. Evolutionary computation
Evolutionary Computation (EC) refers to a group of algorithms inspired by biological evolution and represents a subfield of artificial intelligence. The EC technique has become a popular research subject in quantitative trading since it shows great efficacy in discovering trading rules and optimizing global parameters. Specific algorithms adopted in our surveyed trading systems mainly include Genetic Algorithm (GA), artificial bee colony algorithm (Hsieh, Hsiao, and Yeh Citation2011; Brasileiro et al. Citation2013), ant colony optimization (Cai et al. Citation2015) and swarm intelligence (Wang, Philip, and Cheung Citation2014), with GA the most popular. In Kwon and Moon (Citation2007), a 2-D encoding GA was utilized to optimize the weight matrix of a one-layer Recurrent Neural Network (RNN) trading system, which was then tested to ensure that the performance was far superior to that of the ‘Buy-and-Hold’ (BH) strategy. Jiang et al. (Citation2009) employed an algorithm based on GA to select potential factors that influence a company’s future financial performance. In the research of de Brito and Oliveira (Citation2014), GA was used to optimize the parameters of technical indicators. Hu et al. (Citation2015) introduced a novel method combining a GA-originated evolutionary learning method called XCS (Wilson Citation1995) with multiple classical trading strategies to discover appropriate trading rules corresponding to the contemporary market environments. This method can obtain excess returns with a high Sortino ratio after accounting for the transaction cost.
2.2.3. Order execution
Learning in trading systems is not merely limited to generating trading signals and predicting future price. The optimization of order execution is another important research field and especially vital for HFT strategies (Guilbaud and Pham Citation2015; Kirilenko et al. Citation2011). Here, optimization indicates a strategy by which a system can execute a specified (large) volume of orders, which should have been traded within a certain period of time, in multiple small trades to achieve the minimum expenditure. The solution is affected by multiple factors, such as the execution size, limit order book structure, order type (market order or limit order), etc. When multiple trading venues are available for the same stock, the problem of Smart Order Routing (SOR) is observed for optimal order allocation across these venues. Additional influential factors include different transaction fees and rebates for different exchanges, order fill rates, etc. (Cont and Kukanov Citation2017). The order execution problem is generally studied by stochastic control and dynamic programming. As for machine learning, a reinforcement learning and supervised learning method were proposed by Kearns and Nevmyvaka (Citation2013) and Cont and Kukanov (Citation2017), respectively.
3. Systems based on textual analysis
Price movements in financial markets are essentially driven by chunks of information. Academic results show that a subtle relationship occurs between news and stock performance. Quick access or an adequate response to the information will lead to a competitive edge. The value for incorporating news in a trading system stems from enabling a response to new information in advance before it is absorbed by the market price. Currently, information is mainly transmitted in streams of textual data. Text mining techniques represent an estimable viewing angle for addressing the problem of applying fundamental info to trading strategies. Compared with the use of market data in technical analyses, the exploitation of unstructured fundamental text data is more challenging.
In general, research on text-based frameworks can be roughly segmented into two camps depending on whether they address quantitative or qualitative information. Quantitative information is mostly concerned with formative numeric data published by periodic disclosures by corporations or reports from government departments at a prescheduled time, such as the release of quarterly earnings or gross domestic product (GDP), respectively. One situation, i.e. jump, needs special consideration. Jump refers to discontinuities in asset price that are frequently caused by unanticipated financial data releases. Jump and cojump are highly related to macro announcements (Lahaye, Laurent, and Neely Citation2011), and this phenomenon is especially widespread in futures markets of gold, bonds, treasuries and foreign exchanges (FOREX) (Chatrath et al. Citation2014). Flash jump is used to predict the lead-lag relationship among information-receiving agents in an environment of milliseconds. Orders arriving in a leading position at the exchange will rapidly secure a large amount of money. Undoubtedly, a higher speed corresponds to a greater number of shares that can be traded. Scholtus, van Dijk, and Frijns (Citation2014) studied the S&P 500 and NASDAQ from 2009 to 2011 in terms of high frequency trading based on macroeconomic news releases, and they indicated that a delay of 300 milliseconds could significantly reduce the return by 3.08%. As such, low-latency systems have been developed to enable immediate responses the instant news enters the market. Such systems require an extremely short time to process event content, generate trading instructions and accomplish the order matching process at the exchange (Hasbrouck and Saar Citation2013). Few studies have provided specific details for low-latency event triggered system design. For a theoretical framework, we may refer to Acharya and Sidnal (Citation2016), where an HFT architecture with complex event identification and processing is proposed.
Qualitative information addresses concepts of behavioral finance and attempts to overcome the difficulties encountered by analyses performed using the traditional paradigm and establish a model for discerning less rational factors (Barberis and Thaler Citation2003). Behavioral economists treat price as a synthetic product derived from the cognitions and perceptions of all market participants. Intuitively, price is prone to being overestimated since people are as a whole excessively optimistic. Market anomalies, such as the heavy-tail distribution of asset return generated by the group herd effect, will produce many profitable opportunities (Lux Citation1995; Cont and Bouchaud Citation2000).
In such cases, subjective information preserved in text, such as emotion, sentiment and opinions, is detected using content analysis techniques. Nearly all trading systems introduced in this area of research are constructed under a generic framework displayed in . Among these systems, the approaches mainly differ with respect to the object textual data, content analysis method and machine learning algorithm. summarizes the typical related work we reviewed according to the three aspects.
Table 1. Textual analysis based trading methods and systems.
Figure 1. A generic framework for textual-analysis based systems.
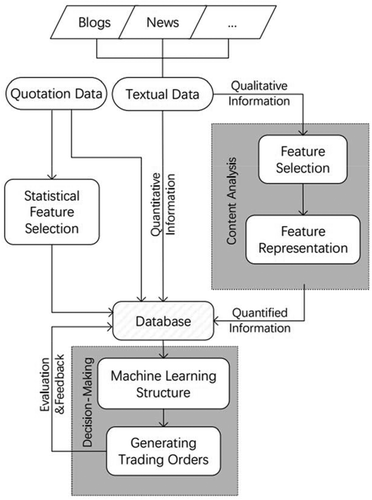
In this framework, both market and textual data are used as input. At the output end, decision-making is fulfilled by a machine learning algorithm. The researched texts bases are derived from blogs, forums, news, social media and corporation filings. Before qualitative information can be used, the framework performs feature selection and feature representation to transform the text into a readable format that indicates a certain category of sentiment. An appropriate categorization methodology is crucial for acquiring sufficiently correct outputs. The most commonly used method is the dictionary-based method, whose baseline approach is known as the ‘bag-of-words’ algorithm, in which each single word of a given text is classified regardless of the order based on predesigned dictionary categories (weights) (Manning and Sch¨Utze et al. Citation1999). Further developed approaches, such as noun phrases, named entities and n-grams, are harnessed to categorize special patterns of word combinations or word sequences (Kazemian, Zhao, and Penn Citation2014; Schumaker and Chen Citation2009). Several studies have used machine learning to score the nature of the text, and supervised learning, i.e. SVM and Naive Bayes (NB), has been used to train predictive models based on a specially designated training corpus in which each word or phrase and the whole sentiment of articles were manually classified. Although the introduction of machine learning programs did improve the results, these programs were time consuming (Kearney and Liu Citation2014). However, the general accuracy presented in studies of financial qualitative information classification is not satisfying. As alluded to by Hagenau, Liebmann, and Neumann (Citation2013), this research area is still in its infancy, and few studies have demonstrating correct ratios higher than 70%, with most under 60%, which is slightly above the probability of tossing a coin. Such low accuracy should inspire a greater focus on risk prevention in real practice, and it explains why pure text-based systems are rarely used in practice. An interesting exception is the research submitted by Preis, Moat, and Stanley (Citation2013), who only used the search volume of a single word in Google Trends and achieved a remarkable return from 2004 to 2011.
4. High-frequency trading
refers to a type of algorithmic trade in financial instruments with a very high speed. To capture fleeting liquidity imbalances and pricing inefficiencies, HFT strategies are generally designed based on statistical arbitrage, liquidity provisions or liquidity detection (Chlistalla Citation2012). Often, traders will hold positions for just a short period of time and earn their profits by accumulating tiny gains on a large number of transactions. In fact, research has shown that HFT traders hold an underlying asset for just 22 seconds on average (Brogaard, Citation2010). The volume of HFT in total equity trading has been growing rapidly since the beginning of the 21st century at a rate of approximately 70% at the peak, although this growth seems to have leveled off since 2010 (Kaya, Schildbach, and AG Citation2016). Nonetheless, the competition for market shares among HFT firms has intensified.
In the scope of HFTs, the speeds for data acquisition, processing and delivery are crucial factors for generating profits. Low latency exerts considerable influence on those trades based on cross-market arbitrage, risk management, short-lived information and breaking news. According to the research conducted by Matthew Baron, Brogaard, Hagströmer, and Kirilenko (Forthcoming), relative latency rather than nominal latency helps to explain the differences in performance across HFTs, with relative latency indicating how much faster an HFT can perform compared with the speed of others. This finding explains why a small number of the fastest HFT systems, especially the fastest one, earned disproportionally and substantially more than others. Consequently, an arms race to be nanoseconds faster appears to be the new norm. For the same reason, HFT strategies often present surprisingly concise and simple programming, which is usually developed based on linear reversion.
Information on trades taking place in the market is transmitted by the exchange, and bid and ask orders are matched following the principle of time precedence and price precedence. Data such as the latest transaction price, volume, open-interest and outstanding orders are broadcast to the market participants through a data stream called the feed. The feed is transmitted under the Financial information exchange Adapted for Streaming (FAST) protocol (Fixprotocol.org Citationn.d.), which has been adopted by most exchanges around the world. Before the market data are prepared for the end-user application to process and generate orders, the data are transmitted through the network stack, which generally consists of an Ethernet Layer, an IP Layer, a UDP Layer and a FAST layer.
In addition to the algorithm optimization strategy, an important method for reducing system latency is to alleviate the latency generated by the operating system protocol stack. We can achieve this goal by using customized Network Interface Cards (NIC) embedded with specified software that bypass the OS kernel and network stack and improve the latency from 15–20 µs (Morris, Thomas, and Luk Citation2009) on a half round trip across the stack within an unoptimized system to 4 µs (Subramoni et al. Citation2010). This method is also known as a standard software solution, and it dramatically lowers the latency by almost 90 percent. Better methods are implemented on hardware-based systems, typically via the usage of Application-Specific Integrated Circuits (ASICs), Graphic Processing Units (GPUs), or Field-Programmable Gate Arrays (FPGAs). GPUs demonstrate great strengths in meeting the needs of strategies that demand complex parallel computing and large throughput, although GPUs fail to supply sufficient low latency because of the deep pipelines (Lockwood et al. Citation2012). ASIC may lack flexibility and is always accompanied with a much higher cost in terms of long design cycles and expensive expert labor. Among the devices mentioned above, FPGA is the most promising option to date, as shown in Figure 2. The advantages of FPGA include a reconfigurable framework, shorter time-to-market, lower engineering cost, and high throughput; thus, FPGA has led to great performance in the acceleration of financial applications. Most of the earlier work on FPGA acceleration (Morris, Thomas, and Luk Citation2009; Herrmann et al. Citation2009) was concentrated on UDP/IP handling because this procedure is responsible for most of the latency in ordinary PC-based systems generated by CPU interrupts and unpredictable PCIe transfers. In Leber, Geib, and Litz (Citation2011), a microcode engine was proposed to decode multiple templates of the FAST protocol distributed by different exchanges, and this engine offloads both UDP/IP and FAST decoding to the FPGA and decreases the half-round latency from 4.1 µs to 2.6 µs. Lobo et al. (Citation2012) introduced a library of prebuilt FPGA IP blocks provided by Algo-Logic and observed a round-trip latency of only 1 µs with a trading algorithm built inside. The library is intended for protocol optimization to allow clients to build their applications without having to consider the total fundamental infrastructure. This method has shortened the development cycle to an extent. Tang et al. (Citation2016) presented a scalable FPGA-based architecture to accelerate Chinese A-share data processing.
Although we provided considerable detail on the internal latency of trading systems, when compared with external communication delays, internal latency seems trivial. For trade strategies in a single market, the problem of external delays can be solved by purchasing the colocation service, which allows HFTs to deploy their trading servers in close proximity to the exchange. However, for other strategies, such as cross-market arbitrage, the delay caused by physical distance becomes an inevitable problem. HFT firms with adequate cash flow are willing to invest huge amounts of money to solve such problems. In 2010, Spread Networks spent $300 million constructing an optic fiber cable between New York and Chicago, and this cable is aimed primarily at HFT customers and decreases the round-trip transmission time from 16 ms to 13 ms. Unfortunately, this project was soon surpassed by microwave communication techniques, which sharply reduced the round-trip time to approximately 8.1 ms according to Budish, Cramton, and Shim (Citation2015), and the time delay is still decreasing. For most recent news, Jump Trading bought a 31-acre plot of land for $14 million for the purpose of placing a microwave antenna as close as possible to the Chicago Mercantile Exchange (CME) servers located across the street (Bloomberg.com Citationn.d.). However, high-speed methods are often met with discussions of unfairness (Angel and Douglas Citation2013), liquidity crises (Hendershott, Jones, and Menkveld Citation2011), abnormal volatility (Chaboud et al. Citation2014), etc. Because of the infamous ‘Flash Crash’ on 6 May 2010, HFTs became the target of public criticism (Kirilenko et al. Citation2011; Jones Citation2013).
5. Conclusions and future work
This work presented an overview of the construction of an automated trading system based on the required algorithms and hardware implementations. With respect to the algorithms, we began by dividing them into technical and textual analysis-based systems. We introduced the most problematic and valuable research areas in subdivisions of these two types, in which the statistical method PST, machine learning applications and textual analysis were highlighted. Because competition in today’s trading has increasingly high demands for speed, we also discussed the field of HFT, where hardware acceleration is required to achieve extremely low system delays. We also noticed that a number of problems remain to be solved and certain areas still in their infancy; therefore, further studies are required. We hoped that this paper could provide insights to researchers and practitioners about the various approaches to current trading system designs as well as inspiration for their related research.
As financial market is heavily correlated with various sources of information, a research direction lies on the system fusion for multi-information processing. An integrated EIS is aimed at fulfilling the intelligent decision-making with as much as possible useful information taken into consideration. In order to meet the real-time trade demand, dedicated hardware is to be implemented to ensure accelerated computation and secure communication in a real-time manner. Meanwhile, the system will also be improved by increased sophistication in detailed subarea, including the development of more sensitive indicators, fine-grained analytical methods in information extraction etc. In future, for the purpose of data safety, techniques such as network encryption security should therefore be further explored and exploited.
Disclosure statement
No potential conflict of interest was reported by the authors.
Additional information
Funding
Related Research Data
References
- Acharya, A., and N. S. Sidnal. 2016. “High Frequency Trading with Complex Event Processing.” In High Performance Computing Workshops (HiPCW), 2016 IEEE 23rd International Conference on, 39–42. IEEE.
- Achelis, S. B. 2001. Technical Analysis from A to Z. New York: McGraw Hill.
- Angel, J. J., and M. Douglas. 2013. “Fairness in Financial Markets: The Case of Highfrequency Trading.” Journal of Business Ethics 112 (4): 585–595. doi:10.1007/s10551-012-1559-0.
- Barberis, N., and R. Thaler. 2003. “A Survey of Behavioral Finance.” Handbook of the Economics of Finance 1: 1053–1128.
- Bloomberg.com. n.d.. “Trading Fortunes Depend on a Mysterious Antenna in an Empty Field.” https://www.bloomberg.com/news/articles/2017-05-12/mysterious-antennas-outside-cme-reveal-traders-furious-land-war
- Baron, M. D., Brogaard, J., Hagströmer, B., and Kirilenko, A. A. Forthcoming. "Risk and Return in High-Frequency Trading." (November 14, 2017). Journal of Financial and Quantitative Analysis. Available at SSRN: https://ssrn.com/abstract=2433118 or http://dx.doi.org/10.2139/ssrn.2433118
- Bowen, D., M. C. Hutchinson, and O. Niall. 2010. “High-Frequency Equity Pairs Trading: Transaction Costs, Speed of Execution, and Patterns in Returns.” The Journal of Trading 5 (3): 31–38. doi:10.3905/jot.2010.5.3.031.
- Brasileiro, R. C., V. L. F. Souza, B. J. T. Fernandes, and A. L. I. Oliveira. 2013. “Automatic Method for Stock Trading Combining Technical Analysis and the Artificial Bee Colony Algorithm.” In Evolutionary Computation (CEC), 2013 IEEE Congress on, 1810–1817. IEEE.
- Brogaard, Jonathan. 2010. “High Frequency Trading and Its Impact on Market Quality.” Northwestern University Kellogg School of Management Working Paper 66.
- Broussard, J. P., and M. Vaihekoski. 2012. “Profitability of Pairs Trading Strategy in an Illiquid Market with Multiple Share Classes.” Journal of International Financial Markets, Institutions and Money 22 (5): 1188–1201. doi:10.1016/j.intfin.2012.06.002.
- Budish, E., P. Cramton, and J. Shim. 2015. “The High-Frequency Trading Arms Race: Frequent Batch Auctions as a Market Design Response.” The Quarterly Journal of Economics 130 (4): 1547–1621. doi:10.1093/qje/qjv027.
- Cai, Q., D. Zhang, W. Zheng, and S. C. H. Leung. 2015. “A New Fuzzy Time Series Forecasting Model Combined with Ant Colony Optimization and Auto-Regression.” KnowledgeBased Systems 74: 61–68.
- Chaboud, A. P., B. Chiquoine, E. Hjalmarsson, and C. Vega. 2014. “Rise of the Machines: Algorithmic Trading in the Foreign Exchange Market.” The Journal of Finance 69 (5): 2045–2084. doi:10.1111/jofi.12186.
- Chatrath, A., H. Miao, S. Ramchander, and S. Villupuram. 2014. “Currency Jumps, Cojumps and the Role of Macro News.” Journal of International Money and Finance 40: 42–62. doi:10.1016/j.jimonfin.2013.08.018.
- Chen, X., and Y. Fang. 2013. “Enterprise Systems in Financial Sector-An Application in Precious Metal Trading Forecasting.” Enterprise Information Systems 7 (4): 558–568. doi:10.1080/17517575.2012.698022.
- Chlistalla, M. 2012. “High-Frequency Trading: Better than Its Reputation? Research Briefing, Deutsche Bank Research.”
- Cont, R., and J.-P. Bouchaud. 2000. “Herd Behavior and Aggregate Fluctuations Infinancial Markets.” Macroeconomic Dynamics 4 (2): 170–196. doi:10.1017/S1365100500015029.
- Cont, R., and A. Kukanov. 2017. “Optimal Order Placement in Limit Order Markets.” Quantitative Finance 17 (1): 21–39. doi:10.1080/14697688.2016.1190030.
- de Brito, R. F. B., and A. L. I. Oliveira. 2014. “Sliding Window-Based Analysis of Multiple Foreign Exchange Trading Systems by Using Soft Computing Techniques.” In Neural Networks (IJCNN), 2014 International Joint Conference on, 4251–4258. IEEE.
- Do, B., and R. Faff. 2010. “Does Simple Pairs Trading Still Work?” Financial Analysts Journal 66 (4): 83–95. doi:10.2469/faj.v66.n4.1.
- Do, B., and R. Faff. 2012. “Are Pairs Trading Profits Robust to Trading Costs?” Journal of Financial Research 35 (2): 261–287. doi:10.1111/jfir.2012.35.issue-2.
- Feuerriegel, S., and R. Fehrer. 2016. “Improving Decision Analytics with Deep Learning: The Case of Financial Disclosures.” In ECIS, Research-in.
- Feuerriegel, S., and H. Prendinger. 2016. “News-Based Trading Strategies.” Decision Support Systems 90: 65–74. doi:10.1016/j.dss.2016.06.020.
- Fixprotocol.org. n.d. “FIX Adapted for STreaming(SM) FAST Protocol(SM).” http://www.fixprotocol.org/fast
- Gatev, E., W. N. Goetzmann, and K. Geert Rouwenhorst. 2006. “Pairs Trading: Performance of a Relative-Value Arbitrage Rule.” The Review of Financial Studies 19 (3): 797–827. doi:10.1093/rfs/hhj020.
- Grossman, S. J. 1988. “Program Trading and Market Volatility: A Report on Interday Relationships.” Financial Analysts Journal 44 (4): 18–28. doi:10.2469/faj.v44.n4.18.
- Groth, S. S., and J. Muntermann. 2011. “An Intraday Market Risk Management Approach Based on Textual Analysis.” Decision Support Systems 50 (4): 680–691. doi:10.1016/j.dss.2010.08.019.
- Guilbaud, F., and H. Pham. 2015. “Optimal High-Frequency Trading in a Pro Rata Microstructure with Predictive Information.” Mathematical Finance 25 (3): 545–575. doi:10.1111/mafi.2015.25.issue-3.
- Hafezi, R., J. Shahrabi, and E. Hadavandi. 2015. “A Bat-Neural Network Multiagent System (BNNMAS) for Stock Price Prediction: Case Study of DAX Stock Price.” Applied Soft Computing 29: 196–210. doi:10.1016/j.asoc.2014.12.028.
- Hagenau, M., M. Liebmann, and D. Neumann. 2013. “Automated News Reading: Stock Price Prediction Based on Financial News Using Context-Capturing Features.” Decision Support Systems 55 (3): 685–697. doi:10.1016/j.dss.2013.02.006.
- Hasbrouck, J., and G. Saar. 2013. “Low-Latency Trading.” Journal of Financial Markets 16 (4): 646–679. doi:10.1016/j.finmar.2013.05.003.
- Hendershott, T., C. M. Jones, and A. J. Menkveld. 2011. “Does Algorithmic Trading Improve Liquidity?” The Journal of Finance 66 (1): 1–33. doi:10.1111/j.1540-6261.2010.01624.x.
- Herrmann, F., G. Perin, J. P. Jos´e de Freitas, R. Bertagnolli, and J. B. D. S. Martins. 2009. “An UDP/IP Network Stack in FPGA.” Electronics, Circuits, and Systems (ICECS).
- Hsieh, T.-J., H.-F. Hsiao, and W.-C. Yeh. 2011. “Forecasting Stock Markets Using Wavelet Transforms and Recurrent Neural Networks: An Integrated System Based on Artificial Bee Colony Algorithm.” Applied Soft Computing 11 (2): 2510–2525. doi:10.1016/j.asoc.2010.09.007.
- Hu, Y., B. Feng, X. Zhang, E. W. T. Ngai, and M. Liu. 2015. “Stock Trading Rule Discovery with an Evolutionary Trend following Model.” Expert Systems with Applications 42 (1): 212–222. doi:10.1016/j.eswa.2014.07.059.
- Huck, N., and K. Afawubo. 2015. “Pairs Trading and Selection Methods: Is Cointegration Superior?” Applied Economics 47 (6): 599–613. doi:10.1080/00036846.2014.975417.
- Jiang, Y., X. Lida, H. Wang, and H. Wang. 2009. “Influencing Factors for Predicting Financial Performance Based on Genetic Algorithms.” Systems Research and Behavioral Science 26 (6): 661–673. doi:10.1002/sres.967.
- Jones, C. M. 2013. “What Do We Know about High-Frequency Trading?” doi:10.2139/ssrn.2236201.
- Kaya, O., J. Schildbach, and D. B. Ag. 2016. “High-Frequency Trading.” https://www.dbresearch.com/PROD/RPS_ENPROD/PROD0000000000454703/Research_Briefing%3A_High-frequency_trading.pdf
- Kazemian, S., S. Zhao, and G. Penn. 2014. “Evaluating Sentiment Analysis Evaluation: A Case Study in Securities Trading.” In WASSA ACL, 119–127. doi:10.1016/j.jecp.2013.08.005.
- Kearney, C., and S. Liu. 2014. “Textual Sentiment in Finance: A Survey of Methods and Models.” International Review of Financial Analysis 33: 171–185. doi:10.1016/j.irfa.2014.02.006.
- Kearns, M., and Y. Nevmyvaka. 2013. “Machine Learning for Market Microstructure and High Frequency Trading.” In High Frequency Trading: New Realities for Traders, Markets and Regulators. Risk Books, edited by David Easley, Marcos Lopez de Prado, and Maureen O’Hara . http://riskbooks.com/book-high-frequency-trading
- Kirilenko, A., A. S. Kyle, M. Samadi, and T. Tuzun. 2011. “The Flash Crash: The Impact of High Frequency Trading on an Electronic Market.” Available at SSRN 1686004.doi:10.2139/ssrn.1686004.
- Krauss, C. 2017. “Statistical Arbitrage Pairs Trading Strategies: Review and Outlook.” Journal of Economic Surveys 31 (2): 513–545. doi:10.1111/joes.2017.31.issue-2.
- Kwon, Y.-K., and B.-R. Moon. 2007. “A Hybrid Neurogenetic Approach for Stock Forecasting.” IEEE Transactions on Neural Networks 18 (3): 851–864. doi:10.1109/TNN.2007.891629.
- Lahaye, J., S. Laurent, and C. J. Neely. 2011. “Jumps, Cojumps and Macro Announcements.” Journal of Applied Econometrics 26 (6): 893–921. doi:10.1002/jae.1149.
- Leber, C., B. Geib, and H. Litz. 2011. “High Frequency Trading Acceleration Using FPGAs.” In Field Programmable Logic and Applications (FPL), 2011 International Conference on, 317–322. IEEE.
- Lev, B., and S. R. Thiagarajan. 1993. “Fundamental Information Analysis.” Journal of Accounting Research 190–215. doi:10.2307/2491270.
- Li, F. 2010. “The Information Content of Forward-Looking Statements in Corporate filingsA Na¨Ive Bayesian Machine Learning Approach.” Journal of Accounting Research 48 (5): 1049–1102. doi:10.1111/j.1475-679X.2010.00382.x.
- Liew, R. Q., and W. Yuan. 2013. “Pairs Trading: A Copula Approach.” Journal of Derivatives & Hedge Funds 19 (1): 12–30. doi:10.1057/jdhf.2013.1.
- Lo, A. W., H. Mamaysky, and J. Wang. 2000. “Foundations of Technical Analysis: Computational Algorithms, Statistical Inference, and Empirical Implementation.” The Journal of Finance 55 (4): 1705–1765. doi:10.1111/0022-1082.00265.
- Lobo, N., V. Malik, C. Donnally, S. Jahne, and H. Jhaveri. 2012. "Evaluating the Latency Impact of IPv6 on a High Frequency Trading System." Master degree, University of Colorado.
- Lockwood, J. W., A. Gupte, N. Mehta, M. Blott, T. English, and K. Vissers. 2012. “A Low-Latency Library in FPGA Hardware for High-Frequency Trading (HFT).” In High-Performance Interconnects (HOTI), 2012 IEEE 20th Annual Symposium on, 9–16. IEEE.
- Lux, T. 1995. “Herd Behaviour, Bubbles and Crashes.” The Economic Journal 881–896. doi:10.2307/2235156.
- Manning, Christopher D, Hinrich Sch¨Utze. 1999. Foundations of Statistical Natural Language Processing. Vol. 999. London: MIT Press.
- Miao, G. J. 2014. “High Frequency and Dynamic Pairs Trading Based on Statistical Arbitrage Using a Two-Stage Correlation and Cointegration Approach.” International Journal of Economics and Finance 6 (3): 96. doi:10.5539/ijef.v6n3p96.
- Morris, G. W., D. B. Thomas, and W. Luk. 2009. “FPGA Accelerated Low-Latency Market Data Feed Processing.” In High Performance Interconnects, 2009. HOTI 2009. 17th IEEE Symposium on, 83–89. IEEE.
- Nath, P. 2003. “High Frequency Pairs Trading with Us Treasury Securities: Risks and Rewards for Hedge Funds.” (November 2003). Available at SSRN: https://ssrn.com/abstract=565441 or https://doi.org/10.2139/ssrn.565441
- Nuij, W., V. Milea, F. Hogenboom, F. Frasincar, and U. Kaymak. 2014. “An Automated Framework for Incorporating News into Stock Trading Strategies.” IEEE Transactions on Knowledge and Data Engineering 26 (4): 823–835. doi:10.1109/TKDE.2013.133.
- Park, C.-H., and S. H. Irwin. 2007. “What Do We Know about the Profitability of Technical Analysis?” Journal of Economic Surveys 21 (4): 786–826. doi:10.1111/j.1467-6419.2007.00519.x.
- Park, J., and I. W. Sandberg. 1991. “Universal Approximation Using Radial-Basisfunction Networks.” Neural Computation 3 (2): 246–257. doi:10.1162/neco.1991.3.2.246.
- Preis, T., H. S. Moat, and H. E. Stanley. 2013. “Quantifying Trading Behavior in Financial Markets Using Google Trends.” Scientific reports 3: srep01684. doi:10.1038/srep01684.
- Rad, H., R. K. Y. Low, and R. Faff. 2016. “The Profitability of Pairs Trading Strategies: Distance, Cointegration and Copula Methods.” Quantitative Finance 16 (10): 1541–1558. doi:10.1080/14697688.2016.1164337.
- Ranco, G., D. Aleksovski, G. Caldarelli, M. Grˇcar, and I. Mozetiˇc. 2015. “The Effects of Twitter Sentiment on Stock Price Returns.” PloS One 10 (9): e0138441. doi:10.1371/journal.pone.0138441.
- Salvatierra, I. D. L., and A. J. Patton. 2015. “Dynamic Copula Models and High Frequency Data.” Journal of Empirical Finance 30: 120–135. doi:10.1016/j.jempfin.2014.11.008.
- Scholtus, M., D. van Dijk, and B. Frijns. 2014. “Speed, Algorithmic Trading, and Market Quality around Macroeconomic News Announcements.” Journal of Banking & Finance 38: 89–105. doi:10.1016/j.jbankfin.2013.09.016.
- Schumaker, R. P., and H. Chen. 2009. “Textual Analysis of Stock Market Prediction Using Breaking Financial News: The AZFin Text System.” ACM Transactions on Information Systems (TOIS) 27 (2): 12. doi:10.1145/1462198.1462204.
- Shi, S. M., L. Da Xu, and B. Liu. 1999. “Improving the Accuracy of Nonlinear Combined Forecasting Using Neural Networks.” Expert Systems with Applications 16 (1): 49–54. doi:10.1016/S0957-4174(98)00030-X.
- Shi, S., L. D. Xu, and B. Liu. 1995. “Artificial Neural Network for Combining Forecasts.” Journal of Systems Engineering and Electronics 6 (2): 58–64.
- Shi, S., L. D. Xu, and B. Liu. 1996. “Applications of Artificial Neural Networks to the Nonlinear Combination of Forecasts.” Expert Systems 13 (3): 195–201. doi:10.1111/j.1468-0394.1996.tb00119.x.
- Shynkevich, Y., T. Martin McGinnity, S. Coleman, and A. Belatreche. 2015. “Predicting Stock Price Movements Based on Different Categories of News Articles.” In Computational Intelligence, 2015 IEEE Symposium Series on, 703–710. IEEE.
- Subramoni, H., F. Petrini, V. Agarwal, and D. Pasetto. 2010. “Streaming, Low-Latency Communication in On-Line Trading Systems.” In Parallel & Distributed Processing, Workshops and Phd Forum (IPDPSW), 2010 IEEE International Symposium on, 1–8. IEEE.
- Tang, Q., M. Su, L. Jiang, J. Yang, and X. Bai. 2016. “A Scalable Architecture for Low-Latency Market-Data Processing on FPGA.” In Computers and Communication (ISCC), 2016 IEEE Symposium on, 597–603. IEEE.
- Thawornwong, S., and D. Enke. 2004. “The Adaptive Selection of Financial and Economic Variables for Use with Artificial Neural Networks.” Neurocomputing 56: 205–232. doi:10.1016/j.neucom.2003.05.001.
- Vidyamurthy, G. 2004. Pairs Trading: Quantitative Methods and Analysis. Vol. 217. New York: John Wiley & Sons.
- Wang, F., L. H. Philip, and D. W. Cheung. 2014. “Combining Technical Trading Rules Using Particle Swarm Optimization.” Expert Systems with Applications 41 (6): 3016–3026. doi:10.1016/j.eswa.2013.10.032.
- Wilson, S. W. 1995. “Classifier Fitness Based on Accuracy.” Evolutionary Computation 3 (2): 149–175. doi:10.1162/evco.1995.3.2.149.
- Yu, H., G. V. Nartea, C. Gan, and L. J. Yao. 2013. “Predictive Ability and Profitability of Simple Technical Trading Rules: Recent Evidence from Southeast Asian Stock Markets.” International Review of Economics & Finance 25: 356–371. doi:10.1016/j.iref.2012.07.016.
- Zhu, X., H. Wang, X. Li, and L. Huaizu. 2008. “Predicting Stock Index Increments by Neural Networks: The Role of Trading Volume under Different Horizons.” Expert Systems with Applications 34 (4): 3043–3054. doi:10.1016/j.eswa.2007.06.023.