
ABSTRACT
This paper proposes that high value on the work-life balance, compensation, career opportunity and fitness of culture and management style would improve job satisfaction. A turnover risk prediction model based on the random forest is constructed to understand the turnover risk feature and identify risk. Using a sample of 17,724 online reviews of employees from Glassdoor, the positive effect of antecedents, the job satisfaction variable as a mediator, and the unemployment rate variable as a moderator is verified. Finally, job satisfaction is identified as the most important feature for predicting turnover based on the random forest algorithm.
1. Introduction
For companies, the cost of spending on employee turnover is considerably high, and this cost is positively influenced by the working years or other characteristics of the actively resigning employee. Some costs of turnover are direct and computable. For example, the replacement cost, which contains recruiting, selecting and training new employees fees, is astonishing (Stamolampros et al. Citation2019). According to Huning and Thomson (Citation2011), this expenditure is twice the annual salary of a departing employee, which is even as high as $10,000 per hourly employee. In addition, some costs are indirect and imponderable. For example, the costs caused by disruption of work, loss of organisational memory, pressure on remaining staff and decreasing service quality are invisible and difficult to evaluate (Allen, Bryant, and Vardaman Citation2010; Huning and Thomson Citation2011). For the Internet industry, the turnover rate is high in the top internet countries, like America and China, due to the rapid development and talent competition in the Internet industry. As to Internet companies, Barslund and Busse (Citation2016) pointed out that as of 2016, the Internet has maintained rapid talent growth, although the global economy is still in the process of recovery. The rapid development of these companies needs support from talents and causes fierce talent competition between Internet companies. Moreover, a talent report reveals that Internet talent growth in Seattle and the Bay Area reached 26% and 21%, respectively (Barslund and Busse, Citation2016). This positive external employment environment creates opportunities for job-hopping for Internet employees. Thus, it is meaningful to understand the determinants that drive individuals’ voluntary turnover decisions and know the mechanism of turnover decision processes.
In current turnover studies, the relevant research areas have formed into a mature system and scholars periodically compile meta-analyses to summarise this volume of research. March and Simon (Citation1958) inaugurated the first formal turnover theory and proposed that employees’ turnover intentions were influenced by their job (dis-)satisfaction. Via a meta-analysis study, Griffeth, Hom, and Gaertner (Citation2000) identified that personal characteristics, satisfaction with the overall job and job facets, work experience, external environment factors, employees’ behaviour (e.g. lateness, absenteeism, performance) and cognitive factors (e.g. organisation commitment, withdrawal cognitions) could predict employees intention to quit. In sum, many researchers have focused on exposing the individual, organisation and social factors, such as the growth opportunity of job resources, which will negatively affect the separation (Carlson et al. Citation2017). But the main concern of these references is the tendency to leave a company rather than the actual turnover state. Additionally, the majority of them focus on one kind of factor without comparison. Moreover, most voluntary turnover research was testified by subjective survey or experimental data, but few of them have obtained support from objective data and real resignation cases. Furthermore, these research projects are more concerned with industries in high contact with consumers, such as the medical industry. However, for the Internet industry, there should be more attention. That is, the main purpose of this paper is to take advantage of the data mining strategy from the perspective of big data to explore and testify to the real predictors, mechanisms and conditional boundaries of the US internet employees’ actual turnover.
In the field of turnover risk prediction, researchers mainly use supervised learning methods, such as Naive Bayes, to build the best prediction models. But research on the Internet sector is not common. The research questions of this paper will focus on four aspects. First, what are the determinants of employees’ voluntary turnover? Second, will job satisfaction have a mediating effect on the above predictive relationship? Third, is there any moderating effect of macroeconomic factors? Finally, will the turnover risk identification be resolved based on data mining technologies? In order to answer these research questions, we carried out data mining based on the amount of objective data from the perspective of big data. All data are collected from Glassdoor, the second-largest workplace community for corporate reviews and job searches in US. Reviewers could post their ratings and comments on the website for the current or former companies. This is an objective data set to meet the 4 V features of big data, volume, variety, velocity and value.
From a theoretical point of view, this paper will discover all results based on the real sample data with a great volume collected from the Internet sector. From a practice point of view, the human resources managers, head hunters and job seekers will know what the employees in top Internet companies are enjoying and what these employees are unsatisfied with from this paper. Besides, it is worthy for recruiters in the Internet sector to pay attention to the factors driving individuals’ turnover decisions and turnover risk for stabilising the turnover rate. This would help supplement existing theories from an industry-wide perspective. Besides, the outcome variable will be the real turnover decision rather than a turnover intention, and this would be better to reveal the factors that influence employee turnover.
2. Literature review
2.1 Social exchange theory
Behaviour in the workplace can be regarded as social exchange behaviour, and social exchange theory is also applicable in the workplace. Social exchange behaviour refers to the phenomenon that the exchanging act only occurs when someone responds in a reciprocated reflection and the action stops when someone no longer responds with the rewards (Bierstedt and Blau Citation1965; DeLamater and Ward Citation2013). Social exchange theory holds that the expected return of individuals is the motivator for them to work voluntarily and the return is actually obtained from others (Bierstedt and Blau Citation1965). It reveals that the fundamental of human interaction is the exchange of social and material resources. Not all human behaviour is guided by rewards precondition, and social exchange is only part of human behaviour. Theory X believes that employees are lazy and their labour efforts are passive in the work placement. The return that employees pursue is the core to motivate the productivity of employees. Therefore, the relationship between employees and the company is aligned with the conditions of social exchange theory. Besides, in the workplace, the exchange behaviour is also a reciprocal interaction between individuals and organisations or supervisors, which keeps balance by adjusting expected rewards and employees’ performance of both parties. The interaction would be broken once one side reduces in the long term (Bierstedt and Blau Citation1965; El Akremi, Vandenberghe, and Camerman Citation2010). For example, the employment relation tends to be removed when negative behaviours, like lack of career advancement opportunity, exist for a long time if employees look forward to further development within the organisation (Biron and Boon Citation2013). In the study of Nayak, Jena, and Patnaik (Citation2021), they consider personal beliefs about reciprocal obligations between individuals and organisations as psychological contracts and corporate governance mechanisms (monitoring and rewarding) as knowledge contracts. They studied these two contracts using data from the IT sector in northern India. The psychological contract has been found to mediate the relationship between the knowledge contract and employee satisfaction and employee retention.
2.2 Turnover, job satisfaction and its antecedents
Staff turnover represents the break of a reciprocal relationship; at least, the relationship will be inactive. Turnover refers to the departure act when employees leave the officially participating company (Olubiyi et al., Citation2019). The antecedents of turnover are complex, and there is a multi-factor process from negative factors to turnover decisions. On the one hand, a certain number of researches focus on the impact of external environmental factors on turnover. Like most of the traditional models proposed by researchers in the early stage, an influential turnover model proposed by March and Simon is a participant decision model and this took the macroeconomic environment into consideration (March and Simon Citation1958). Similarly, recent research supports that the positive economic and political factors from society attract them to resign (Ramlawati et al., Citation2021). The possibility of getting an alternative external opportunity makes employees tend to leave their organisation. This is an issue depending on external environmental factors, such as job availability and the rate of unemployment (Abdullah Al Mamun Citation2017). On the other hand, job satisfaction is considered an intermediary variable between complex antecedents and turnover intention or decision (Kim et al. Citation2017). Kabungaidze et al. (Citation2013) applied descriptive, inferential statistical analysis to turnover intention research and reported a negative relationship between job satisfaction and turnover intention in the education industry. Calecas (Citation2019) employed multiple linear regression to study the relationship between job satisfaction, employee engagement and turnover intention in US federal employment using a secondary dataset (Federal Employee Viewpoint Survey), which contains 598,003 samples, although in different sectors, they also found a significant relationship between job satisfaction and turnover intention. Price confirmed that demographic factors are associated with turnover through job satisfaction and impact other factors like organisational commitment. Price (Citation2001) considered job satisfaction as the mediating variable that negatively influences turnover and exists between exogenous variables, like promotion opportunity and turnover. Stamolampros et al. (Citation2019) focused on both demographic and decomposed job satisfaction attributes based on ordered logistic regression on 297,933 samples and the results show that cultural values and leadership are the motivators of job satisfaction in this study. The behaviours of job searching and the intention to leave are associated with job satisfaction, and there are stages between dissatisfaction and turnover. In addition to the study of job satisfaction and turnover, Hong and Xu (Citation2021) also discovered that job satisfaction was positively related to personal responsibility and both factors further positively influenced information security policy compliance (ISPC). Job satisfaction is generally described as a kind of feel or attitude towards employees’ current jobs and is divided into two aspects, job satisfaction and job dissatisfaction. Its definition from different researchers is similar, and there is no authoritative version. The former refers to a sense of accomplishment towards their job (AZIRI, Citation2011), while dissatisfaction reflects the reverse attitude, which is unfavourable (Spector et al., Citation2007). Furthermore, according to Castro and Martins (Citation2010) and Price (Citation2001), job satisfaction is subjective and affectively oriented psychological perception influenced by the work environment and is measurable. Kim (Citation2019) discovered from the data of 1,646 workers employed in Korean workplaces that the use of SNS influences job satisfaction and partially mediates the relationship between extraversion and neuroticism in the Big Five personality and job satisfaction. The expectation for the job is different for individuals, and the factors influencing their satisfaction and turnover decision are also multi-dimensional. The following presents the relevant research results in recent years.
As for employees, LMX is part of the criteria to judge management style fitness within an enterprise. LMX, leader-member exchange, refers to the quality of the relationship between a manager and an employee (Gerstner and Day Citation1997; Liden and Maslyn Citation1998). Drawing from social exchange theory, a series of favourable behaviours for the employees to remain in offices, such as strong commitment, loyalty and trust, would be reciprocated by managers when they are supported and trusted by managers (Blau, Citation1968). Hajizadeh, Makvandi, and Amirnejad (Citation2022) investigated effective coaching factors for business managers in motivating human resources in Persian Gulf Petrochemical Company. According to their study, managers’ competencies and skills as part of the coaching strategy positively and significantly influence employee motivation, teamwork and job satisfaction. However, the lack of certain features swaying employees’ management style fitness, like respect and trust, would result in the low reciprocation of subordinates (Rurkkhum Citation2018). Any of these aversive work environments would lead to undesirable employee behaviours, such as leaving. The latest research shows a negative relation between LMX and turnover intention for front-line employees (Wang, Kim, and Milne Citation2017). The relation between leader emotional intelligence and employee turnover intention is mediated by leader-member exchange (Clarke and Mahadi Citation2017). Biron and Boon (Citation2013) proposed that the high quality of LMX enhances the negative relation between performance and turnover intention. The relation between leader-member exchange (leader trust) and job satisfaction (Zou, Citation2015)) believed that the degree of leader trust is positively related to job satisfaction, strengthening the reciprocal relationship of social exchange behaviour.
In terms of job demand, physical overexertion and fatigue, unfavourable work environment and work–life conflict has been quite often noted as sources of job demands (Bakker and Demerouti Citation2007). In recent research, Carlson et al. (Citation2017) verified the positive effect of job overload on job tension, affecting job tension on job satisfaction and job satisfaction negatively impacts turnover intention. Furthermore, Carlson et al. (Citation2017) also proved the mediating effect of job satisfaction on the relation between job overload and turnover intention is true. Like imbalanced work and life, quantitative demands positively affect turnover intention (Bon and Shire Citation2017). In terms of job resources, career opportunities, including advancement opportunities and growth opportunities, like skills training opportunities, are job resources when they are not locked in the workplace (Bon and Shire Citation2017). The results of the studies reported on the relationship between career opportunities and turnover intention or decision is discrepant. Bin Mohd Rosli (Citation2016) confirmed no relation between career advancement opportunities and turnover intention. However, Weer and Greenhaus (Citation2017) revealed that as an antecedent of engaging in workplace behaviours, growth opportunities have an effect on the decision to stay or resign. Zito et al. (Citation2018) verified that the relation between job resources (supervisors’ support) and turnover is not significant, while job resources (job autonomy and emotional dissonance) are positively and negatively influential on job satisfaction, respectively, their effect on the turnover intention is inverse. Besides, the relation between job satisfaction and turnover intention is also true in this model (Zito et al. Citation2018).
Distributive justice is one of the dimensions of organisational justice used to evaluate the resources distribution within an organisation, and compensation distribution justice is one of the determinants of turnover. According to organisational justice, the outcome, like compensation, is compared with the input, like time, knowledge and employee efforts in a workplace (Kim Citation2017). According to the social exchange theory, the balanced relationship between employees and organisations is governed by the reciprocity law (El Akremi, Vandenberghe, and Camerman Citation2010; Gouldner Citation1960). Unfair relationships would break it from a fair organisational perspective. The perception of fairness influences the social exchange relationship between employees and organisations or supervisors (Rupp and Cropanzano Citation2002). A positive relation between distributive justice and job satisfaction has been identified in recent research (Haran and Niederman Citation2022; Kim Citation2017). The imbalance of this process would make employees feel inequitable and result in input reduction and even stoppage (Haran and Niederman Citation2022; Kim et al. Citation2017). For Millennial public accountants, both poor distributive justice and procedural justice tend to lead to a high turnover intention, controlling for gender and job tenure. When the strength of procedural justice is stronger than distributive justice (George and Wallio Citation2017), Nadiri & Tanova (Citation2010) verified the significant relation between distributive justice and job satisfaction and even turnover intention based on hierarchical regression and correlation analysis. In addition to research on organisational justice, Haran and Niederman (Citation2022) also studied another social context of turnover and found that the influence of peers and family can also affect turnover intentions and actual turnover behaviour.
Organisational culture is a set of beliefs, shared values and norms that affect how employees feel, think and behave in the workplace. It is fundamental to retain talent. From recent research, the enterprise culture is one of the predictors of turnover (Zhang Citation2016). Ryu et al. (Citation2020) also employed logistic regression to study the moderating effect of organisational climate on the association between emotional labour and turnover intention and found a significant relationship among Korean firefighters. In the study of Nguyen Ngoc et al. (Citation2022), Vietnamese Generation Z was found to be more concerned with the company’s office atmosphere or workplace ethics and was considered intangible attributes rather than physical conditions.
There are also some research projects considering multiple antecedents of turnover comprehensively in one research. Stamolampros et al. (Citation2019) investigated the service and medical industry and focused on demographic and decomposed job attributes based on ordered logistic regression and online data. The results show that compensation & benefits and work–life balance are regarded as hygienic factors that adversely influence job satisfaction when the ratings on these factors are low. However, a high rating for them will not lead to high satisfaction. It also reveals that career opportunity is the most influential factor that impacts employees’ decision to quit the tourism industry. In the Internet industry, five dimensions, including workload, organisation, career opportunities, colleagues, and compensation and benefits, are calculated into the turnover model in research conducted by (Lei 2019). This confirmed that workload, colleagues, and compensation and benefits are closely related to turnover.
2.3 Data mining and turnover risk prediction
Data mining is defined as a process of uncovering and identifying the latent but valid pattern from a great volume of data stored in the data warehouse or other information repositories based on machine learning technologies and advanced algorithms (Fayyad Citation1996). Data mining aims to identify the pattern from data and take advantage of the law to realise the prediction function. It is one of the application subjects of machine learning (ML). As a synthetic science that integrates computer science, mathematics and statistics, machine learning can simulate and learn from human behaviour and then acquire new knowledge and techniques in the process (Zhenyuan Citation2018).
Data mining has been applied in various fields, like medical science, biology, finance, manufacturing and so on (Strohmeier and Piazza Citation2013; Zhao et al. Citation2019). Taking the semiconductor industry in the manufacturing domain, Choudhary, Harding, and Tiwari (Citation2009) point out that classification algorithms improved the yield by classifying the defects and identifying corresponding patterns significantly. As for human resources, data mining science has been effective in different human resources management activities, including selecting candidates, making decisions on managerial promotion and forecasting functions, like turnover risk prediction and employee performance evaluation (Strohmeier and Piazza Citation2013). The relevant technologies and algorithms have been developed to a practical stage, and the existing relevant research is based on various employee features with sufficient evaluation criteria (Strohmeier and Piazza Citation2013; Zhao et al. Citation2019). For example, Lockamy and Service (Citation2011) revealed and identified the top 5 significant determinants of employee promotion based on the Bayesian network. Furthermore, based on the general preference learning model, a support vector machine is proposed to help employers select highly matched candidates (Aiolli, De Filippo, and Sperduti Citation2009). In particular, the major and meaningful data mining applications are predicting turnover within an organisation and identifying the risk of employee turnover in advance. Kang, Croft, and Bichelmeyer (Citation2021) employed an ML algorithm, Classification and Regression Tree (CART), to predict the turnover intention of US federal employees and identify the most significant variables affecting turnover intention. They analysed a public dataset of 598,003 samples from the Federal Employee Viewpoint Survey. The results show that job satisfaction is the most significant predictor of turnover intention and six at-risk subgroups. Based on an employee turnover dataset from Kaggle, Chakraborty et al. (Citation2021) trained several classical ML algorithms to predict turnover and evaluated them through a confusion matrix. The results show that Random Forest outperformed other algorithms and identified job position, overtime and work level affected turnover most significantly. Their dataset has only 1470 samples, which was considered a limitation by the authors. Different from the above studies, Zhao et al. (Citation2019) paid more attention to the ML algorithms and data size for employee turnover prediction. Using the sampling method, they employed two primary HR datasets with different sizes and numbers of attributes and augmented these datasets to 10 sub-datasets. In this way, they can evaluate the effectiveness of different ML algorithms on different datasets. Their results indicated that small datasets are likely to contain great randomness and variance, suggesting that users should pay more effort to assess the data quality and choose the appropriate classifier in a heuristic way. On the other hand, a more reliable model can be built on medium and large datasets as the data variance decreases and requires less data preparation. The ensemble algorithms (XGB, GBT and RF) showed better performance on the datasets they used.
Recent research outputs focusing on turnover risk identification are listed in .
Table 1. Related work.
3. Hypotheses development
3.1 Job satisfaction and turnover
The recent research listed above acquired turnover intention rather than actual turnover decision or action as the dependent variables and verified the relationship between job satisfaction and turnover intention. This paper will focus on the antecedents of turnover decision (Kim et al. Citation2017; Kabungaidze et al., Citation2013; Zito et al. Citation2018) and therefore hypothesis 1 is proposed:
H1: Job satisfaction will negatively influence turnover in the Internet sector in the US.
3.2 Job satisfaction antecedents
The literature above verified the effect of LMX (Gill, 2008), job demand (Carlson et al. Citation2017; Bon and Shire Citation2017), job resources (Bon and Shire Citation2017; Zito et al. Citation2018), distributive justice (Haran and Niederman Citation2022; Kim Citation2017) and corporate culture (Zhang Citation2016) on job satisfaction and turnover. This paper proposes five corresponding variables, including management style fitness (Gerstner and Day Citation1997; Liden and Maslyn Citation1998), work–life balance (Bakker and Demerouti Citation2007), career opportunity (Bon and Shire Citation2017), compensation & benefits (Kim Citation2017) and culture fitness, as the antecedents of satisfaction and focuses on how they are relevant to job satisfaction in the Internet industry based on the online data. Among them, career development includes promotion opportunities and growth opportunities. Five hypotheses between antecedents and job satisfaction are proposed as follows:
H2: Work–life balance will positively influence job satisfaction.
H3: Culture fitness will positively influence job satisfaction.
H4: Career opportunities will positively influence job satisfaction.
H5: Compensation & benefit will positively influence job satisfaction.
H6: Management style fitness will positively influence job satisfaction.
3.3 Mediating effect of job satisfaction
Existing works have recognised the mediating effect of job satisfaction between certain antecedents and job satisfaction separately (Price, Citation2001; Gill, 2008; Carlson et al. Citation2017; Nadiri & Tanova, Citation2010; Zito et al. Citation2018). This paper focuses on how job satisfaction affects the relationship between the five factors of this paper and turnover. The hypotheses are as follows:
H7: Job satisfaction will mediate the negative relation between Work–life balance and turnover.
H8: Job satisfaction will mediate the negative relation between Culture fitness and turnover.
H9: Job satisfaction will mediate the negative relation between Career opportunity and turnover.
H10: Job satisfaction will mediate the negative relation between compensation & benefit and turnover.
H11: Job satisfaction will mediate the negative relation between Management style fitness and turnover.
3.4 Moderating effect of macro factors
The psychology of dissatisfaction provokes the thinking of quitting employees, and the evaluation of the career environment and self-working ability would be followed (Xie & Wang, 1999; March and Simon Citation1958; Abdullah Al Mamun Citation2017; Lei, 2019). Verbruggen and van Emmerik (Citation2020) believe that employees who are thinking of leaving will weigh up whether to stay or leave based on the external job opportunities available to them to make a decision that they will regret less. As such, this part controls for the macro variables, including GDP or unemployment rate factors and the moderating effect will be measured. The hypothesis:
H12: GDP will moderate the negative relationship between job satisfaction and turnover decision.
H13: The unemployment rate will moderate the negative relationship between job satisfaction and turnover decision.
4. Method
4.1 Methodology
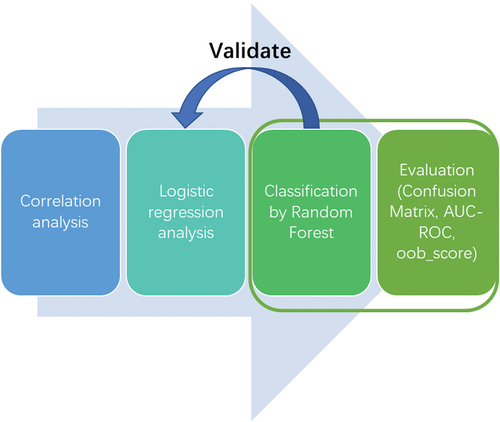
This study employs a hybrid model that integrates statistical methods and a machine learning algorithm. The methodology framework is shown in . Firstly, the relationship between the five independent variables and job satisfaction is tested by correlation analysis and presented by the correlation matrix. Then, we employ regression analysis to evaluate the mediating effect, moderating effect and relation between job satisfaction and turnover decision. As the turnover decision is a binary variable, logistic regression is adopted. The reasons are explained in section 4.1.2. In order to predict the turnover risk, this study also employs one of the machine learning techniques, Random Forest, to learn the relationship between the features and the turnover decision and conduct the classification task. To evaluate the classifier, we employed the confusion matrix, the area under the receiver operating characteristic (ROC) curve (AUC-ROC) and the out-of-bag score (oob_score). In addition, the trained classifier can also rank the importance of each feature, thereby validating the results of regression analysis.
Figure 1. The framework of the hybrid model.
4.1.1 Correlation analysis
Correlation analysis is employed to answer hypotheses 2–6 and analyse the relationship between the five independent variables and job satisfaction in this dataset (Taylor Citation1990). Correlation coefficient r, in the range of [−1, +1], reflects the positive or negative relation and the strength between them. In general, 0<|r|≤0.3 represents the weak correlation, 0.3<|r|≤0.5 represents the moderate correlation, 0.5<|r|≤0.8 represents the significant correlation, 0.8<|r|≤1 represents the strong correlation (Geng Citation2014).
4.1.2 Regression analysis
Regression models are applied to test the mediating effect, moderating effect and relation between job satisfaction and turnover decision in this paper. The data characteristic in a data set and the research objective can influence the choice of regression and model. There are four available models for the data with the binary variable as the dependent variable: discriminant analysis, probit regression, OLS and logistic regression. The latter two models are the most popular methods applied to research work (Pohlmann & Leitner, Citation2003). Pohlmann & Leitner (Citation2003) revealed that the significance test results of OLS are the same as that of logistic regression on the categorical dataset. This proves that the two models are not superior when the only relationship between the target variables is focused – however, logistic regression performance is better than OLS when the accuracy of the probability of classification is improved. Besides, to research the influence effect of dependent variables on independent variables, it is more practicable and reasonable to explain the logit model results than OLS. Thus, the logistic regression model is applied to the models with turnover as the dependent variable. However, a transformation for logistic regression is conducted in the following models to improve the accuracy of results and avoid shortages resulting from a possible breakdown of logistics regression.
4.1.3 Data mining and random forest
A classification process could be structured as a tree is defined as a decision tree (Alao and Adeyemo Citation2013). This is one of the supervisor algorithms with a serious rule based on the logic of ‘if-then’ syntax in each node within a tree for classifying the data into each class. The understandable principle, intuitive results, and the high tolerance for the missing value of the dataset are the advantages of the decision tree. However, a moderate change in the input dataset strongly affects the results. It would be easy to result in over-fitting problems and reduce the generalisation ability of the model. A random forest algorithm is a way to address this defect. A random forest is defined as an ensemble and classification algorithm combined with a group of decision trees (BREIMAN Citation2001; Zhao et al. Citation2019). Ensemble means that the forest is randomly grouped by the decision trees based on the bagging method, sampling with replacement and bootstrap aggregating. This mechanism improves the generalisation ability and reduces the overfitting risk of random forest. Besides, there are more reliable and less variable random forest classification results since this algorithm computes the results of each decision tree based on voting to assign the outcome classification to the random tree and all these trees are independent of one another. This reveals the core concept of random forest, which combines weak learners and decision trees into strong learners. Furthermore, the importance of each feature, such as satisfaction, work–life balance, culture fitness, career opportunity, management fitness and compensation, could be measured after the model is trained. This helps identify the predictors that affect employee departures. However, one shortage for the random forest is like a ‘black box’ since the decision trees combined into the random forest cannot be visualised. This means that node selection details cannot be acquired, resulting in the difficulty of parameter adjustment.
4.2 Data source and data cleaning
According to the existing theories and current research situation of employee turnover and satisfaction, this paper collects the potential determinants of satisfaction and turnover from the aspects of subjective and objective, which contain cultural fitness and manage style fitness as the subjective factors, and work–life balance, compensation and career opportunity as objective factors. Besides, macroeconomic variables, GDP and the unemployment rate of the corresponding region are employed as the indexes to represent the macro-career environment. Finally, six top companies, including Amazon, Apple, Facebook, Google, Microsoft and Netflix, in the Internet industry are selected in the first dataset since the targeted industry of this research is the Internet industry of the US. These companies cover different segments of the Internet industry, such as mobile internet, internet media, electronic commerce and so on.
Two data sources are employed in this paper to collect the above determinants. The first source is a dataset containing employees’ career information collected from Glassdoor, and the second source is based on the US workplace community for corporate reviews and job searches (Glassdoor website Citation2019). Both data sources have been integrated into a combined dataset for better data analysis. The interface for collecting comments from employees on the website is shown in in Appendix A. Reviewers could post their comments and rates about the companies they worked for on this website. In terms of rate, reviewers could rate given aspects of the company, like compensation, based on their work experience. The rating ranges from 1 to 5 and 0.5 as an interval. In terms of comments, all positive and negative experiences and suggestions to managers could be reported by reviewers on the online questionnaire in text form. Besides, reviewers are also required to fill in tenure information (current or former), and this is the source of this paper to differentiate the former and current employees. 1 is assigned to the former employees in the input dataset and 0 represents the current employee group. Location, position and work year information are also required to fill in. The second dataset records the macro-economic index, GDPFootnote1 and unemployment rate,Footnote2 and these are collected from a world data website, KNOEMA, which is available for downloading all the economic data (Knoema, Citation2019).
The first comment data sourceFootnote3 covers the reviews and ratings from 2008 to 2018 and 67,516 individuals either posted a comment or rated in this dataset. The numbers of samples from Amazon, Apple, Facebook, Google, Microsoft and Netflix are 26,422, 12,949, 1589, 7818, 17,928 and 810, respectively. In order to ensure the validity of the data used to analyse and the accuracy of the results, the data cleaning process is necessary. Firstly, the null value, like the reviews without ratings, is removed. Then, the reviews with the zero ‘helpful count’, which is an index to calculate how many viewers agree with this review, are removed from the dataset. This could improve the quality of every piece of valid data. Finally, there are 17,724 reviews left after cleaning, and 40% of them are former employees. The data situation is listed in and the questionnaire to collect judgement information is attached in Appendix A. A summary of the variables studied in this research is presented in Appendix B.Footnote4
Table 2. Data presentation.
4.3 Model
4.3.1 Model for hypotheses 2–6
Correlation analysis is conducted to identify the relevance between job satisfaction and work–life balance, culture fitness, career opportunity, compensation & benefits, and management style fitness. In order to understand the factors that former or current employees are most concerned about, the model based on correlation analysis is extended into three forms as follows. This would mine the information about why individuals choose to leave and what factors attract existing employees to stay from the perspective of numeric data. This model is conducted by STATA and here, three models are conducted.
Model 1: former model with only former employees as the observations;
Model 2: current model with only current employees as the observations;
Model 3: full model with all employees as the observations.
4.3.2 Models for hypotheses 7-13
The relevance between the five antecedents and job satisfaction has been verified in the previous part. The models in this part aim to find the mediating variables and moderating variables influencing the turnover action of employees. They are conducted using SPSS to verify the mediating effect and STATA for regression.
Mediating test for job satisfaction
According to the models proposed by March and Simon and Price, job satisfaction is the mediating variable between workplace experience factors, like work–life balance and turnover action.
For testing the mediating effect, detecting the regression coefficient, in turn, is a traditional method (Judd & Kenny, Citation1981; Baron & Kenny, Citation1986). For the model, which is mixed with continuous and categorical variables, logistic regression should be employed on the categorical outcome variable (Iacobucci, Citation2012). Thus, model A and model C should be computed based on logistic regression in this paper. The test for the effect of job satisfaction is conducted, so that job satisfaction can be measured by the overall rating of A, B and C in .
Figure 2. Mediating effect test model.
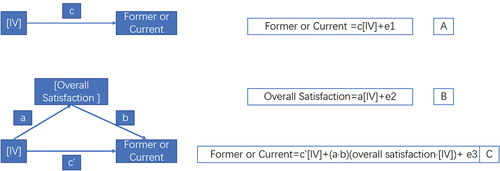
shows the visualisation of the mediating effect test process. The [X] represents a collection of determinants influencing turnover rate, including work–life balance, culture fitness, career opportunity, compensation and benefit and management style fitness. All the effects among the five factors, job satisfaction and turnover, are measured separately to investigate their relationship clearly.
Models to test the moderating effect
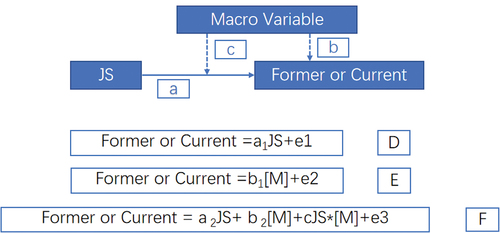
According to Fang et al. (Citation2019), the variables without mean centring have no impact on the performance of moderating effect test, even though there would be bias in the significance and coefficients of the main effects. Thus, any transformation of the data is not conducted, and the model for the moderator test model is shown in .
Figure 3. Moderating effect test model.
5. Results
5.1 Descriptive analysis
Descriptive analysis results are shown in to better understand the distribution of this dataset and the rating situation from employees of the Internet industry workplace environment, represented by top US Internet companies.
Table 3. Descriptive analysis results.
Mean value and variance data in illustrate that talent in the American Internet sector is most satisfied with compensation & benefits and then culture fitness. However, the variation of culture fitness is the highest among the five factors ratings. This means that there is a certain-level gap in corporate culture fitness. Some employees cannot match with corporate, but some others could adapt to it well. As for compensation, employees are generally satisfied with the high mean value and low variance. The details of ratings for each company are shown in the second tale, and the real workplace environment of each enterprise could be exposed based on a big data perspective. In the comparison between companies with a similar distribution of employee status, the poor performance on the antecedents of satisfaction and turnover of Amazon is identified. Based on almost identical distributions of employees’ status, ratings for antecedents of Amazon are below the industry average. At the same time, Google is rated above the industry average and ahead of all companies except Facebook. Besides, all but very few career opportunities rating for antecedents of Amazon is at the bottom of the sample.
5.2 Turnover and satisfaction antecedents
supports hypothesis 1 and reveals that the relationship between job satisfaction and turnover decisions is significant. Furthermore, job satisfaction (−0.19, p < 0.001) leads to a negative influence on turnover.
Table 4. Relation between JS and turnover.
Correlation analysis results in , and prove a positive relationship between all the antecedents and job satisfaction in the three models, and hypotheses from 2 to 6 are true. The three tables represent the results of the subsample with only former employees, the subsample with only current employees, and the whole observations, respectively. The correlation results in the three models are virtually the same. Similarly, the correlation coefficient of culture fitness (range from 0.77 to 0.8, p < 0,001) is the highest in all three models, and then management style (range from 0.73 to 0.77, p < 0,001) is the second significant factor. However, the correlation coefficient of culture fitness (0.77, p < 0.001) is smaller than 0.8 and reaches 0.8 in the other two models for the former employees.
Table 5. Former employee model of correlation analysis.
Table 6. Current employee model of correlation analysis.
Table 7. Full model of correlation analysis.
5.3 Mediating effect of job satisfaction
The mediating variable should be significant when the five variables in the main effect are controlled and these five variables should also be influential on the dependent variable (Wen et al., 2004). , and list the statistical results of each model.
Table 8. Mediating results of model A.
Table 9. Mediating effect results of model B.
Table 10. Mediating test results of model C.
In terms of coefficients [c] in model A, they are all significant and influential on turnover rate (ranging from −0.18 to −0.09, p < 0.001). In terms of the coefficients [a], which represent the relation between all the five antecedent factors and job satisfaction, where model B verifies their significance (ranging from 0.62 to 0.74, p < 0.1). Thus, all five factors, Work–life balance, value fitness, career opportunity, compensation and management style fitness, are the determinants of satisfaction and turnover. The effect of turnover is negative and positive on job satisfaction. Model C is the last part of the mediating variable, and the result is conducted based on the PROCESS package in SPSS. Results in support the hypotheses from 7 to 11. The statistically significant mediating effect of job satisfaction on the negative relation between work–life balance and turnover (−0.0267 (−0.340, −0.0202)), culture fitness and turnover (−0.625 (−0.0788, −0.0467)), career opportunity and turnover (−0.0438 (−0.1484, −0.0809)), compensation and turnover (−0.0213 (−0.0275, −0.0158)) and management style fitness −0.0366 (−0.0462, −0.0272) are verified. The mediating effect is also negative.
5.4 Moderating effect of macro factors
represents the process of the moderator test for GDP and unemployment rate. Coefficients of job satisfaction and product between satisfaction and each macro factor should be significant when the moderator effect hypothesis is true. lists the test results of hypothesis 12 and hypothesis 13 and the results reveal the moderator effect of the unemployment rate is true. The interaction between the unemployment rate and job satisfaction (−0.01, p < 0.01) has a negative effect on the turnover decision. presents the negative relationship between job satisfaction and the turnover decision that changed lightly when unemployment increased from low to high. The slope change is also slight from low moderator to high moderator under either low level of job satisfaction or high level of satisfaction.
Figure 4. Two-way interaction effects between job satisfaction and unemployment rate on turnover decision.
Table 11. Moderating test result.
Table 12. Confusion matrix of random forest.
Table 13. Secondary indicators based on a confusing matrix.
5.5 Turnover risk prediction model
5.5.1 Random forest algorithm implementation
0 represents employee status as current and 1 is former. In the results, the negative class represents turnover = 0 and the positive class represents turnover = 1.
In this matrix, C00, C01, C10 and C11 represent prediction results: true negative, false positive, false negative and true positive, respectively. For example, true negative refers to the observations, which are turnover = 0 and the predicted value is also 0, that is, the current employee. The status of 4,417 observations can be correctly identified based on this random forecast model.
Confusion Matrix shows the classification results in an absolute value and some relative indicators shown in are developed based on these values as the second measurement criteria. AUC is calculated from the receiver operating characteristic (ROC), which plots the tradeoff between precision and recall, and AUC represents the area of the ROC curve. Based on ROC, AUC is compatible with the imbalanced dataset, which has a gap in count between different categories (Olson Citation2015). ACC, accuracy, reflects the percentage of correct classification observations among all test datasets. Based on the random forecast, 63% of the observations’ status could be predicted correctly. What is worth mentioning is that this value would be overestimated when the data set is imbalanced and the probability of former employees is smaller than 50% (Sexton et al. Citation2005; Sikaroudi and EsmaieeliSikaroudi Citation2015; Zhao et al. Citation2019). Therefore, accuracy cannot be considered the only index, and measuring the performance in a comprehensive view is necessary. RCL, recall, is defined as the number of true positive classifications divided by the sum of true positive and false negatives. This reflects how many positive classifications (turnover = 1) are predicted correctly. Here, less than 30% of true former employees could be predicted correctly. PRC, precise, refers to the percentage of true positive classification for true positive and false positives. This reveals there above 55% of observations in positive predictions are true positive. This index is also well balanced in test and training sets. The performance of this model is well balanced even though their scores are not greater than 0.8 and the performance of recall, 0.28 on the test dataset and 0.29 on the training dataset, is not perfect.
Feature importance measurement is one of the byproducts of a random forecast algorithm or decision tree, which assigns a relative value about feature importance to each feature (Liaw and Wiener Citation2002). Breiman and Cutler (Citation2002) proposed four methods to conduct feature importance measurement and one of them is employed in this paper. It is calculated based on how much contribution to the impurity decreases the feature made (scikit learn Citation2017). This is also called Gini importance (the higher, the more important the feature) and Gini represents the impurity of each feature.
The importance of each feature employed in the best random forecast model is reported in and . The most important predictor is job satisfaction, contributing a score of 0.51 to reduce the purity of random forests. The three lowest predictors are compensation, culture fitness and work–life balance.
Figure 5. Feature importance of visualisation.
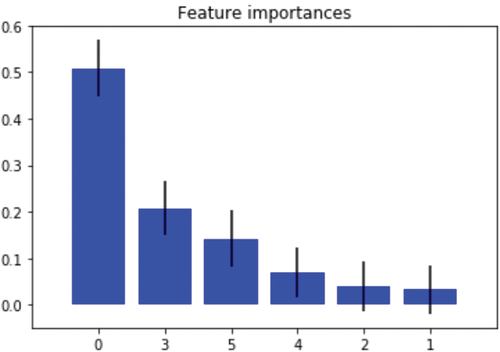
Table 14. Provides details of feature importance.
5.5.2 Random forest algorithm evaluation
The first evaluation for the random forest is the measurement of the upper limit performance of the algorithm. GridSearchCV is applied to find the hyper-parameter for the algorithm model. It refers to a parameter optimisation algorithm that exhaustively searches over specified parameter values for an estimator within the range of a predefined parameter (Pedregosa et al. Citation2011). CV represents cross-validation which detects the over-fitting problems and guarantees the generalisation ability of models. The GridSearchCV package in Python is employed to search for the best parameters for all models in this paper.
Then, the judgement of the bias caused by an imbalanced dataset is conducted here. A dataset is judged as an imbalanced dataset if the probability of each category is not approximately the same (Chawla et al. Citation2002). shows the imbalanced distribution of employees’ status in the training dataset and holdout dataset, respectively. The probability distribution is a bias towards the output variable = 1, that is, the probability of former employees in both train and test data sets. Random forest is a cost-sensitive algorithm, and the imbalanced dataset would increase the bias of classification results (Chawla et al. Citation2002; Zhao et al. Citation2019). Employing the ROC curve, AUC and comprehensively measuring the performance is the practical solution to avoid the measurement error even though the imbalanced problem is not solved (Chawla et al. Citation2002). Apart from AUC and the comprehensive index, the confusion matrix is also used in this paper to evaluate the classification performance and identify the error. Comparing the reasonable and regular value of PRC, the low value of recall is caused by the huge number of observations in the false-negative group, which should be a positive classification. However, PRC presents that the observations in the false-positive group are less than in the false-negative group. This reveals that random forecasts in this data set tend to predict a higher probability of negative classification. More than half of the observations are negatively labelled in either training or test datasets. This is why the random forest is a negatively biased algorithm in this dataset.
Table 15. Distribution of the dataset.
Finally, generalisation ability is the most important aspect of evaluating the quality of algorithm models. Besides, the over-fitting problem should also be eliminated from the model to improve practicability. Breiman (Citation1996), Tibshirani (Citation1996) and Wolpert and Macready (Citation1996) verified that it is accurate to measure the generalisation error of models based on out-of-bag data. Bagging data and its score are employed to evaluate the relevant performance. The dataset is divided into three parts: train data, test data and validation data. Validation data is generated from the missing data, which is omitted during the sampling with the replacement process. In bagging, predictors are constructed using bootstrap samples from the training set and then aggregated to form a bagged dataset. Thirty-seven per cent of the data are not included in the sample or not used to grow the tree during this bagging process. They are treated as a validation dataset to verify the generalisation capability of the model. The oob_score shown in eliminates the appearance of overfitting the model since the score does not decrease on the validation dataset, which did not participate in model training, hyper-parameter finding and testing.
Table 16. Results of the out-of-bag score.
6. Discussion
6.1 Satisfaction and turnover antecedent analysis
The results of the assumptions are in line with expectations, and the main effect of each antecedent is consistent with current works. In contrast, this paper compared the effects of each antecedent and aimed to find the most important factor. Firstly, low job satisfaction tends to result in employee turnover decisions. This is not discrepant with Kabungaidze et al. (Citation2013)’s research in the education industry and Calecas (Citation2019)’s in government, but this paper takes the real work status (being on the job or not) as the dependent variable. Then, in terms of the antecedents influencing employees’ turnover decisions, all of them positively affect job satisfaction and have a negative impact on turnover. It is worth noting that our findings on the relationship between career opportunities and turnover are consistent with Weer and Greenhaus (Citation2017), while Bin Mohd Rosli (Citation2016) and Zito et al. (Citation2018) indicated that the relationship is not significant. However, our results agree with Zito et al. (Citation2018)’s on the significant relation between career opportunities and job satisfaction. By comparing their importance, employee fitness of management styles is the most influential factor for Internet employees in the US. However, for distributive justice, as the factor that American Internet employees are most satisfied with (with the highest mean value of 3.76 in ), compensation has the most moderate effect on turnover. As for the job demand for work–life balance, job resources of career development and corporate culture fitness, their impact on the turnover decision is scarcely less than that of management style fitness. Overall, the three most related variables are job satisfaction, management style, fitness and career opportunity. Their effects are balanced in terms of the determinants of job satisfaction. Among the limited gaps, employees’ satisfaction is most influenced by their fitness in corporate culture. From , the average rating for this factor, 3.35, is second only to the rating of compensation, 3.76. However, the highest variance (2.18) shows that the evaluation of this indicator from the employees in US Internet companies is mixed. There are various factors impacting the fitness of culture. Racial discrimination and sexism are the one phenomenon of unfair treatment which would estrange employees from the workplace (Roscigno Citation2019). The data set for this paper comes from the representative and multinational Internet corporations where all cultures are blended here. The poor fusion of cultural differences and unequal attitudes negatively impacts corporate culture, creating a sense of estrangement among employees, especially non-local employees, and even making them feel disrespected. Regression results show that corporate culture fitness can significantly influence job satisfaction and turnover decisions. Thus, one suggestion for human resources managers is to strengthen the construction of a non-discriminatory and equal corporate culture. This influence of culture fitness is also in line with the correlation analysis results, which disclose that culture fitness and job satisfaction have the highest correlation, especially for current employees. However, Boston Consulting (Citation2016) pointed out that compensation and benefits, work–life balance and corporate culture that respect personal development are the top three factors American Internet employees are concerned about. This is somewhat inconsistent with this paper, which verified compensation as the least influential factor in the decision.
Our findings on the mediating effect of job satisfaction on the relationship between each antecedent and turnover decision are the same as the previous research (Price, Citation2001; Kim et al. Citation2017; Carlson et al. Citation2017; Zito et al. Citation2018). For all antecedents this paper investigates, job satisfaction mediates the relation between them and turnover decisions. For another effect that would moderate the turnover model, macro-employment factors are also tested. The unemployment rate, more correlated with the employment environment than GDP, is verified as the moderator between job satisfaction and turnover, but GDP is not. The high level of unemployment rate would make turnover tend to be equal to 0, that is, retention status, but the effect is slight. This finding is consistent with Abdullah Al Mamun (Citation2017) and Verbruggen and van Emmerik (Citation2020). In a situation of high unemployment and a lack of externally available jobs, the choice made by employees to leave is highly likely to leave them without a job for some time, prompting them to accept the current situation and choose to stay so as not to regret leaving. The minor changes found that under the low level of job satisfaction, the stabilisation of turnover resulting from high unemployment is relatively more significant than under the high level of job satisfaction.
6.2 Turnover risk prediction results analysis
According to , among all the features, job satisfaction, management style fitness and career opportunity are the three most significant variables to predict turnover risk, which validates the results of the regression analysis. In addition, job satisfaction has the greatest influence on turnover decision prediction.
A new criterion proposed in this paper is the recall value for the negative class, defined as the number of true negative observations divided by true negative and false-positive observations. This would reveal how many employees in the current group (negative class) could be identified. Based on the number listed in , the value is equal to 0.85, which means that 85% of the current employees could be identified correctly in the random forecast model. This stability of employees is an adverse aspect of understanding the turnover risk of an organisation. The great classification performance demonstrates that Random Forest can be employed to identify the current employees with high turnover risk not only in the banking industry (Zhao et al. Citation2019) but also in the Internet sector. With more data samples collected in the future, the performance of the classifier can be further improved.
7. Contribution and limitation
7.1 Contribution
The majority of research intends to drop the dependent variable rather than the actual withdrawal decision since it is difficult to collect the judgement from the employees who have resigned for the purpose of the research. Besides, the respondents tend to conceal part of the true evaluation, which would negatively impact their careers when the information was gathered by distributing questionnaires to businesses for data collection. However, this research collects data from a public website where respondents can answer anonymously. We employed a data mining algorithm, random forest, to make the analysis easy and straightforward, utilising multiple data analysis methods applied to the online review database. This helps researchers find the most significant contributing factor to job satisfaction and turnover and eventually identify the turnover risk. Moreover, high turnover rates can have significant impacts on a business, not only in terms of increased hiring and training costs but also in terms of productivity in the workplace and long-term growth strategies. This research shows how human resource managers can use machine learning methods to more effectively, efficiently and accurately predict turnover and identify the most important factors affecting it. In this way, companies can take timely action to retain employees or reduce losses.
7.2 Limitations and future work
The first limitation originates from the shortage of online reviews, in which the quality of reviewers is difficult to control. For example, someone is not an employee of this company but posts a review, which would influence data accuracy. However, this impact is depressed by removing the reviews without any support or with a null value. Besides, minimal mistakes have rarely been influenced by a great volume dataset. Thus, the bias caused by the quality of the comments is reduced.
Besides, there is a lack of demographic data, like gender, which is one of the determinants influencing job satisfaction and turnover action. Thus, the difference acquired from gender, family status or other demographic factors cannot be distinguished. Besides, this lack of information also decreases the potential precision of data mining results since the influential factor is not concluded in the trained model and the model cannot identify the demographic influence on other datasets.
Finally, as to the model based on a random forest algorithm, 60% of the accuracy conducted in this paper is not perfect. The- possible reason for limiting accuracy is the volume of the dataset. However, the weak prediction power of the positive class is another reason for this accuracy. Thus, the data size of former employees should be enlarged in the future work to eliminate the imbalanced influence. Machine learning could contribute to turnover risk identification if the text content in online reviews could be recognised. One of the analysis values and features of online review from Glassdoor is the textual judgement for companies from actual employees and an impartial view.
8. Conclusion
This paper mainly employs notions from social exchange theory to generate hypotheses about the antecedents of job satisfaction and turnover decision. The factors impacting turnover are complicated and sometimes difficult to measure. However, this paper splits the turnover process into multiple steps and compares the effect of each factor, respectively. Besides, different data analysis methods are used in this real data set on factors of employee satisfaction and turnover decisions. The results of data analysis can contribute to both theory and practice.
The dataset is collected from the employees who worked in Internet companies and all the ratings are based on their work experience. This is favourable for reflecting the actual workplace environment of the Internet sector in the US, and the conclusion is from the perspective of the whole industry rather than a specific company. Besides, the online review is timely updated, and the latest employee evaluation trends in each industry are available at any time. Individuals in both industries and companies can get the latest employee reviews from such big data regarding human resources.
Furthermore, based on the two characteristics, volume and velocity of big data, the data is more representative than the small dataset is the first advantage of big data.
Our contribution includes developing a data mining and random forest algorithm for building the turnover risk-prediction model and multiple data analysis methods. Our innovative method makes critical analysis, much easier. In this paper, for employees who tend to remain in office, 85% of them can be identified even though the turnover risk identification ability is mediocre. The design of the questionnaire by human resource managers reveals that data privacy and confidentiality can be further enhanced for future data analysis.
Acknowledgments
This work is partly supported by VC Research (VCR 0000155).
Disclosure statement
No potential conflict of interest was reported by the author(s).
Correction Statement
This article has been corrected with minor changes. These changes do not impact the academic content of the article.
Additional information
Funding
Notes
4. There is a video talk for this paper https://www.youtube.com/watch?v=VQEdH7A0efA.
References
- Abdullah Al Mamun, C. 2017. “Factors Affecting Employee Turnover and Sound Retention Strategies in Business Organization: A Conceptual View.” Problem Perspecting Management 15: 1120–1152. doi:10.21511/ppm.15(1).2017.06.
- Aiolli, F., M. De Filippo, and A. Sperduti, 2009. Application of the Preference Learning Model to a Human Resources Selection Task, in: 2009 IEEE Symposium on Computational Intelligence and Data Mining. Presented at the 2009 IEEE Symposium on Computational Intelligence and Data Mining (CIDM), IEEE, Nashville, TN, USA, pp. 203–210. 10.1109/CIDM.2009.4938650
- Alao, D., and A. B. Adeyemo, 2013. Analyzing Employee Attrition Using Decision Tree Algorithms.pdf.
- Allen, D. G., P. C. Bryant, and J. M. Vardaman. 2010. “Retaining Talent: Replacing Misconceptions With Evidence-Based Strategies.” In Academy of management Perspectives 24(2), 48–64.
- Aziri, B. 2011. ”Job Satisfaction: A Literature Review.” Management Research & Practice 3 (4).
- Bakker, A. B., and E. Demerouti. 2007. “The Job Demands‐Resources Model: State of the Art.” Journal of Managerial Psychology 22 (3): 309–328. doi:10.1108/02683940710733115.
- Baron, R. M., & Kenny, D. A. 1986. ”The moderator–mediator variable distinction in social psychological research: Conceptual, strategic, and statistical considerations”. Journal of personality and social psychology 51 (6): 1173.
- Barslund, M., and M. Busse 2016. ”How mobile is tech talent? A case study of IT professionals based on data from LinkedIn. A Case Study of It Professionals Based on Data from LinkedIn (June 30, 2016).” CEPS. Special Report, (140).
- Bierstedt, R., and P. M. Blau. 1965. “Exchange and Power in Social Life.” American Sociological Review 30 (5): 789. doi:10.2307/2091154.
- Bin Mohd Rosli, M. A., 2016. Intention to Leave Manufacturing organisation_A Study of the Automotive Industry in Malaysia.pdf.
- Biron, M., and C. Boon. 2013. “Performance and Turnover Intentions: A Social Exchange Perspective.” Journal of Managerial Psychology 28 (5): 511–531. doi:10.1108/JMP-09-2011-0054.
- Blau, P. M. 1968. ”Social exchange“. International encyclopedia of the social sciences 7 (4): 452–457.
- Bon, A. T., and A. M. Shire. 2017. “The impact of job demands on employees’ turnover intentions: A study on telecommunication sector.“ International Journal of Scientific and Research Publications 7 (5): 406–412.
- Breiman, L. 1996. “OUT-OF-BAG Estimation 13“. Tech. rep., Statistics Department, University of California.
- BREIMAN, L. 2001. “Random Forests.“ Machine learning 45 (1): 3–52.
- Breiman, L., and A. Cutler, 2002. “Random Forests - Classification Manual [WWW Document].” accessed 12. 11.19. https://www.stat.berkeley.edu/~breiman/RandomForests/cc_manual.htm#c5
- Calecas, K. J. 2019. “Job Satisfaction, Employee Engagement, and Turnover Intention in Federal Employment.“ https://scholarworks.waldenu.edu/cgi/viewcontent.cgi?article=8257&context=dissertations
- Carlson, J. R., D. S. Carlson, S. Zivnuska, R. B. Harris, and K. J. Harris. 2017. “Applying the Job Demands Resources Model to Understand Technology as a Predictor of Turnover Intentions.” Computers in Human Behavior 77: 317–325. doi:10.1016/j.chb.2017.09.009.
- Castro, M. L., and N. Martins. 2010. “The Relationship between Organisational Climate and Employee Satisfaction in a South African Information and Technology Organization.” SA Journal of Industrial Psychology 36: 1–9.
- Chakraborty, R., K. Mridha, R. N. Shaw, and A. Ghosh (2021, September). Study and Prediction Analysis of the Employee Turnover Using Machine Learning Approaches. In 2021 IEEE 4th International Conference on Computing, Power and Communication Technologies (GUCON), Kuala Lumpur, Malaysia (pp. 1–6). IEEE.
- Chawla, N. V., K. W. Bowyer, L. O. Hall, and W. P. Kegelmeyer, 2002. SMOTE_ Synthetic Minority over-sampling Technique.pdf.
- Choudhary, A. K., J. A. Harding, and M. K. Tiwari. 2009. “Data Mining in Manufacturing: A Review Based on the Kind of Knowledge.” Journal of Intelligent Manufacturing 20 (5): 501–521. doi:10.1007/s10845-008-0145-x.
- Clarke, N., and N. Mahadi, 2017. Differences between Follower and Dyadic Measures of LMX as Mediators of Emotional Intelligence and Employee Performance, well-being, and Turnover Intention.pdf.
- Consulting, B., 2016. LinkedIn Talent Report Library [WWW Document]. URL https://business.linkedin.com/zh-cn/talent-solutions/s/sem-report-resources ( accessed 12.15.19).
- DeLamater, J. D., and A. Ward, edited by. 2013. “ Handbook of Social Psychology. ”Handbooks of Sociology and Social Research. Second, p. 571. New York: Springer, Dordrecht.
- El Akremi, A., C. Vandenberghe, and J. Camerman. 2010. “The Role of Justice and Social Exchange Relationships in Workplace Deviance: Test of a Mediated Model.” Human Relations 63 (11): 1687–1717. doi:10.1177/0018726710364163.
- Fang, J., Z. Wen, and K. T. Hau. 2019. “Mediation effects in 2-1-1 multilevel model: evaluation of alternative estimation methods.“ Structural Equation Modeling: A Multidisciplinary Journal 26 (4): 591–606.
- Fayyad, U., 1996. From Data Mining to Knowledge Discovery in Databases 18.
- Geng, P., 2014. SDXH Pharmaceutical Company Employee Satisfaction Study.
- George, J., and S. Wallio. 2017. “Organizational Justice and Millennial Turnover in Public Accounting.” Employee Relations 39 (1): 112–126. doi:10.1108/ER-11-2015-0208.
- Gerstner, C. R., and D. V. Day, 1997. Meta-analytic Review of leader-member Exchange Theory Correlates and Construct Issues.pdf.
- Glassdoor website. 2019. Accessible on 31 (March): 2021. https://www.glassdoor.co.uk/Salaries/index.htm.
- Gouldner, A. W. 1960. “The Norm of Reciprocity: A Preliminary Statement.” American Sociological Review 25 (2): 161–178. doi:10.2307/2092623.
- Griffeth, R. W., P. W. Hom, and S. Gaertner. 2000. “A meta-analysis of Antecedents and Correlates of Employee Turnover: Update, Moderator Tests, and Research Implications for the Next Millennium.” Journal of Management 26 (3): 463–488. doi:10.1177/014920630002600305.
- Hajizadeh, H., F. Makvandi, and G. Amirnejad. 2022. “The Effective Coaching Factors in Operational Managers of Persian Gulf Petrochemical Company in Motivation of Human Resources.” International Journal of Engineering Business Management 14: 18479790211037222. doi:10.1177/18479790211037222.
- Haran, V. V., and F. Niederman. 2022. “Social Context of Turnover-Mixed Methods Study of Indian IT Professionals.” Journal of Global Information Management (JGIM) 30 (1): 1–24. doi:10.4018/JGIM.299320.
- Hong, Y., and M. Xu. 2021. “Autonomous Motivation and Information Security Policy Compliance: Role of Job Satisfaction, Responsibility, and Deterrence.” Journal of Organizational and End User Computing (JOEUC) 33 (6): 1–17. doi:10.4018/JOEUC.20211101.oa9.
- Huning, T. M., and N. F. Thomson, 2011. An Empirical Examination of the Impact of Performance Attributions and Job Satisfaction on Turnover Intentions.pdf.
- Iacobucci, D. 2012. ”Mediation analysis and categorical variables: The final frontie.“Journal of Consumer Psychology 22 (4): 582–594.
- Judd, C. M., and D. A. Kenny. 1981. ”Process analysis: Estimating mediation in treatment evaluations.”Evaluation review 5 (5): 602–619.
- Kabungaidze, T., N. Mahlatshana, and H. Ngirande. 2013. ”The Impact of Job Satisfaction and Some Demographic Variables on Employee Turnover Intentions.” International Journal of Business Administration 4 (1): 53–65.
- Kang, I. G., B. Croft, and B. A. Bichelmeyer. 2021. “Predictors of Turnover Intention in US Federal Government Workforce: Machine Learning Evidence that Perceived Comprehensive HR Practices Predict Turnover Intention.” Public Personnel Management 50 (4): 538–558. doi:10.1177/0091026020977562.
- Kim, S. 2017. “Perceived Organizational Support as a Mediator between Distributive Justice and Sports Referees’ Job Satisfaction and Career Commitment.” Annals of Leisure Research 20 (2): 169–187. doi:10.1080/11745398.2016.1147363.
- Kim, H. 2019. “Investigating the Mediating Role of Social Networking Service Usage on the Big Five Personality Traits and on the Job Satisfaction of Korean Workers.” Journal of Organizational and End User Computing (JOEUC) 31 (1): 110–123. doi:10.4018/JOEUC.2019010106.
- Kim, S., L. Tam, J.-N. Kim, and Y. Rhee. 2017. “Determinants of Employee Turnover Intention: Understanding the Roles of Organizational Justice, Supervisory Justice, Authoritarian Organizational Culture and organization-employee Relationship Quality.” Corporate Communications: An International Journal 22 (3): 308–328. doi:10.1108/CCIJ-11-2016-0074.
- KNOEMA. 2019. ”World Data Atlas. Ukraine - Global gender gap index”. Retrieved from https://knoema.com/atlas/Ukraine/topics/World-Rankings/World-Rankings/Global-gendergap-index
- Liaw, A., and M. Wiener. 2002. “Classification and Regression by random Forest.“ R news 2 (3): 18–22.
- Liden, R. C., and J. M. Maslyn. 1998. “Multidimensionality of Leader-Member Exchange: An Empirical Assessment through Scale Development.” Journal of Management 24: 43–72. doi:10.1177/014920639802400105.
- Lockamy, A., and R. W. Service. 2011. “Modeling Managerial Promotion Decisions Using Bayesian Networks: An Exploratory Study.” Journal of Management Development 30 (4): 381–401. doi:10.1108/02621711111126846.
- March, J. G., and H. A. Simon. 1958. Organizations. NewYork: Wiley.
- Nadiri, H., and C. Tanova. 2010. ”An investigation of the role of justice in turnover intentions, job satisfaction, and organizational citizenship behavior in hospitality industry.” International journal of hospitality management 29 (1): 33–41.
- Nayak, S., D. Jena, and S. Patnaik. 2021. “Mediation Framework Connecting Knowledge Contract, Psychological Contract, Employee Retention, and Employee Satisfaction: An Empirical Study.” International Journal of Engineering Business Management 13: 18479790211004007. doi:10.1177/18479790211004007.
- Nguyen Ngoc, T., M. Viet Dung, C. Rowley, and M. Pejić Bach. 2022. “Generation Z Job Seekers’ Expectations and Their Job Pursuit Intention: Evidence from Transition and Emerging Economy.” International Journal of Engineering Business Management 14: 18479790221112548. doi:10.1177/18479790221112548.
- Olson, R. S., 2015. “Python Machine Learning - Sebastian Raschka - Gfsoso [WWW Document].” accessed 12. 10.19. https://c.glgoo.top/books?hl=zh-CN&id=GOVOCwAAQBAJ&oi=fnd&pg=PP1&dq=Python+Machine+Learning&ots=NceBGgXOTH&sig=xHKjphYXE15HBzy83W5XFUBYN58#v=onepage&q=Python%20Machine%20Learning&f=false
- Olubiyi, O., G. Smiley, H. Luckel, and R. Melaragno. 2019. ”A Qualitative Case Study of Employee Turnover in Retail Business.” Heliyon 5 (6): e01796.
- Pedregosa, F., G. Varoquaux, A. Gramfort, V. Michel, B. Thirion, O. Grisel, M. Blondel, et al. 2011. “Scikit-learn: Machine Learning in Python.” In Mach. Learn. PYTHON (Vol.12, pp. 2825–2830).
- Pohlmann, J. T., and D. W. Leitner. 2003. ”A comparison of ordinary least squares and logistic regression (1).”The Ohio journal of science 103 (5): 118–126.
- Price, J. L. 2001. ”Reflections on the Determinants of Voluntary Turnover.” International Journal of Manpower 22 (7): 600–624.
- Punnoose, R., and P. Ajit. 2016. “Prediction of Employee Turnover in Organizations Using Machine Learning Algorithms.” International Journal of Advanced Research in Artificial Intelligence 5 (9). doi:10.14569/IJARAI.2016.050904.
- Ramlawati, R., E. Trisnawati, N. Yasin, and K. Kurniawaty. 2021. ”External Alternatives, Job Stress on Job Satisfaction and Employee Turnover Intention.” Management Science Letters 11 (2): 511–518.
- Roscigno, V. J. 2019. “Discrimination, Sexual Harassment, and the Impact of Workplace Power.” Socius: Sociological Research for a Dynamic World 5: 2378023119853894. doi:10.1177/2378023119853894.
- Rupp, D. E., and R. Cropanzano. 2002. “The Mediating Effects of Social Exchange Relationships in Predicting Workplace Outcomes from Multifoci Organizational Justice.” Organizational Behavior and Human Decision Processes 89 (1): 925–946. doi:10.1016/S0749-5978(02)00036-5.
- Rurkkhum, S. 2018. “The Impact of person-organization Fit and leader-member Exchange on Withdrawal Behaviors in Thailand.” Asia-Pacific Journal of Business Administration 10: 114–129. doi:10.1108/APJBA-07-2017-0071.
- Ryu, H. Y., D. S. Hyun, D. Y.Jeung, C. S. Kim, and S. J. Chang. 2020. ”Organizational Climate Effects on the Relationship Between Emotional Labor and Turnover Intention in Korean Firefighters.” Safety and Health at Work 11 (4): 479–484.
- scikit learn, 2017. sklearn.tree.DecisionTreeRegressor — Scikit-learn 0.22 Documentation [WWW Document]. accessed 12. 11.19. https://scikit-learn.org/stable/modules/generated/sklearn.tree.DecisionTreeRegressor.html#sklearn.tree.DecisionTreeRegressor.
- Sexton, R. S., S. McMurtrey, J. O. Michalopoulos, and A. M. Smith. 2005. “Employee Turnover: A Neural Network Solution.” Computers & Operations Research 32 (10): 2635–2651. doi:10.1016/j.cor.2004.06.022.
- Sikaroudi, A. M. E., and A. EsmaieeliSikaroudi. 2015. “A Data Mining Approach to Employee Turnover Prediction (Case Study: Arak Automotive Parts Manufacturing).“ Journal of industrial and systems engineering 8 (4): 106–121.
- Spector, P. E., T. D. Allen, S. A. Poelmans, L. M. Lapierre, C. L. Cooper, O. D. Michael, J. I. Sanchez et al, 2007. ”Cross‐national Differences in Relationships of Work Demands, Job Satisfaction, and Turnover Intentions with Work–family Conflict.” Personnel Psychology 60 (4): 805–835.
- Stamolampros, P., N. Korfiatis, K. Chalvatzis, and D. Buhalis. 2019. “Job Satisfaction and Employee Turnover Determinants in High Contact Services: Insights from Employees’Online Reviews.” Tourism Management 75: 130–147. doi:10.1016/j.tourman.2019.04.030.
- Stamolampros, P., N. Korfiatis, K. Chalvatzis, and D. Buhalis. 2019. ”Job satisfaction and employee turnover determinants in high contact services: Insights from Employees’ Online reviews.”Tourism Management 75: 130–147.
- Strohmeier, S., and F. Piazza. 2013. “Domain Driven Data Mining in Human Resource Management: A Review of Current Research.” Expert Systems with Applications 40 (7): 2410–2420. doi:10.1016/j.eswa.2012.10.059.
- Taylor, R., 1990. Interpretation of the Correlation Coefficient_A Basic Review.pdf.
- Tibshirani, R., 1996. Bias, Variance and Prediction Error for Classi Cation Rules 17.
- Verbruggen, M., and H. van Emmerik. 2020. “When Staying Is Dissatisfying: Examining When and Why Turnover Cognitions Affect Stayers’ Career Satisfaction.” Journal of Management 46 (4): 530–559. doi:10.1177/0149206318801998.
- Wang, P. Q., P. B. Kim, and S. Milne. 2017. “Leader–Member Exchange (LMX) and Its Work Outcomes: The Moderating Role of Gender.” Journal of Hospitality Marketing & Management 26: 125–143. doi:10.1080/19368623.2016.1185989.
- Weer, C. H., and J. H. Greenhaus, 2017. Managers’ Assessments of Employees’ Organizational Career Growth Opportunities: The Role of Extra-Role Performance, Work Engagement, and Perceived Organizational Commitment [WWW Document]. accessed 12. 13.19. https://journals.sagepub.com/doi/abs/10.1177/0894845317714892.
- Wolpert, D. H., and W. G. Macready, 1996. An Efficient Method To Estimate Bagging’s Generalization Error 15.
- Zhang, Y., 2016. A Review of Employee Turnover Influence Factor and Countermeasure. https://doi.org/10.4236/jhrss.2016.42010
- Zhao, Y., M. K. Hryniewicki, F. Cheng, B. Fu, and X. Zhu. 2019. “Employee Turnover Prediction with Machine Learning: A Reliable Approach”. In Intelligent Systems and Applications. Springer International Publishing, Cham, edited by K. Arai, S. Kapoor, and R. Bhatia, 737–758. Cham, Germany:Springer.
- Zhenyuan, W. 2018. Machine Learn: Practice of Python. Beijing, China: Electronic Industry Publishing House.
- Zito, M., F. Emanuel, M. Molino, C. G. Cortese, C. Ghislieri, L. Colombo, and N. Georgantzis. 2018. “Turnover Intentions in a Call Center: The Role of Emotional Dissonance, Job Resources, and Job Satisfaction.” PLOS ONE 13 (2): e0192126. doi:10.1371/journal.pone.0192126.
- Zou, M. 2015. Gender, work orientations and job satisfaction. Work, employment and society 29 (1): 3–22.
Appendices
Appendix A
Figure A1. Data collection.
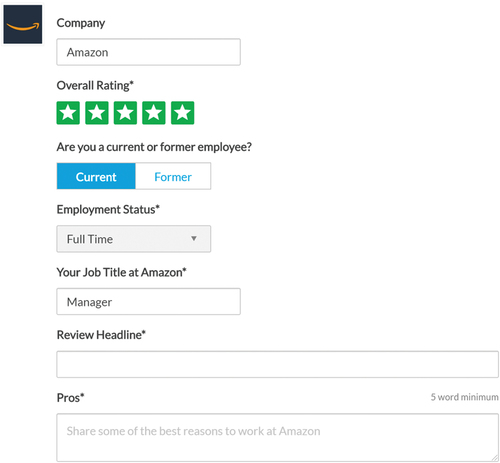
Figure A1. (Continued).
Appendix B.
Summary of variables.
