Abstract
The influence of reaction conditions (yield, excess of stoichiometric reagent, molecular weights of reagents, and mass of auxiliary materials and solvents) on the values of several green chemistry mass metrics (E-factor, mass intensity, atom utilization, relative mass efficiency, and element efficiency), for reactions with 1:1 and 1:3 stoichiometries, has been analyzed, as well as relationships between the metrics. The theoretical behavior of these, when visualized by three-dimensional graphic representations, e.g. surfaces of metric = f(yield, excess), together with the experimental values, facilitates the management of its improvement – changes in conditions in successive experiments should follow the directions shown by the graph. The study shows that there are practical limitations to the greenness increase due to the complex nature of the chemistry but confirms that it is worthwhile to pay more attention to the effort of obtaining quantitative details of the laboratory syntheses to acquire information to assess greenness.
Introduction
Metrics are of paramount importance in green chemistry, because they are essential for sound evaluation of the greenness of reactions and synthetic pathways in the laboratory and of processes in industrial chemistry Citation1. Greenness is a complex concept with a variety of components, which may be tentatively grouped as follows: (1) atom productivity Citation2–6 – incorporation of the atoms of the reagents in the product, instead of wasting them in residues; this component is dealt with by the two first of the 12 Principles of Green Chemistry Citation7 and is covered by a variety of the so called mass metrics which have been introduced under different contexts (see below); (2) toxicity/environmental metrics, required by several of the 12 principles, are essential to assess the health and environmental compatibility of compounds and manufacturing processes Citation8; (3) energy metrics (6th principle), very important because the chemical industry is a voracious consumer of energy, the fossil energy it uses has negative effects on the environment and carbon fuels approach exhaustion Citation9; and (4) safety metrics (12th principle), because the industrial implementation of chemistry involves a large variety of risks which are difficult to control on the whole – although industrial disasters have been decreasing in number and disastrous consequences since Flixborough Citation10, Bophal Citation11, etc., thanks to the intensive efforts of chemical and safety engineers Citation12 Citation13. The numerous and varied activities in the field of chemistry still originate safety incidents/accidents of different types almost every day, as informally but impressively shown in an Internet site of the Chemical Health and Safety Division of ACS Citation14. The previous list shows the complexity of greenness and of its evaluation, which requires system thinking and holistic metrics to deal with its various components simultaneously.
Although the systemic nature of green chemistry has been recognized almost since its inception Citation15, its exploration has been limited, probably due to the traditional reductionist attitude of the chemical education and academic practice of chemistry, in which its different aspects are considered separately, often ignoring their inter-relationships – this situation creates difficulties to the scale-up of reactions and industrial process development, which are systemic tasks. We have recently devised a holistic green chemistry metric, the Green Star Citation16, which has been applied in our efforts to teach green chemistry in this Department Citation17–19 and is currently under further evaluation for improvement. In this effort, for comparison purposes, a lot of data on several other metrics described in the literature Citation3–6 has been calculated in experiments of syntheses of several compounds which were repeated under different conditions to increase greenness. These data prompted a global analysis of these metrics, which allowed evaluation of the influence on their values of the stoichiometry of reactions and of the conditions under which these are performed. This analysis required the derivation of formulae for the metrics under specific conditions and involved further elucidation of relationships between them. These are often complex and have not been fully discussed in the literature. Andraos Citation20 has been using a general formula of Relative Mass Efficiency (RME) for sake of unification of mass metrics and used it with success for thorough study of organic syntheses. However, his pentagonal figures for presentation of metrics show the experimental values without evidencing which values are possible for RME for each reaction, how they depend on the yield, etc. The inclusion of these last relationships in the presentation of mass metrics seems important to make chemists aware of the complexity of greenness, to improve their understanding of metrics, and skills to deal with them.
This paper presents the main results of this analysis; more precisely its scope is to discuss comparatively the application of different green chemistry mass metrics to evaluate the greenness of chemical reactions in the laboratory. To accomplish this purpose, first the individual contribution and overall influence on the values of the mass metrics of the following features of reactions of two different stoichiometries (1:3, and 1:1) were analyzed: yield, excess of a reagent, molecular weights of stoichiometric reagents, and mass of auxiliary materials and solvents/water. Thereafter, it was investigated how to use mass metrics to identify the main aspects which need improvement to increase the greenness of chemical reactions of different types. To accomplish these tasks, data collected in previous laboratory studies Citation16 Citation19 were used in two case studies, the syntheses of iron(III) tris(acetylacetonate) (, case study 1) and of iron(II) oxalate dihydrate (case study 2). In the laboratory studies, syntheses were repeatedly performed under several sets of different conditions to improve their greenness Citation16 Citation19, with careful registration of masses of reagents, solvents, etc. and products, as advised by the second 12 Principles of Green Chemistry proposed by Winterton Citation21, and the most common mass metrics described in the literature (see ) were calculated and used to assess the progress toward greenness in each case. These data on metrics, which constitute a large and varied set, are compared and discussed globally in the present paper. The two case studies were chosen because they involve very simple synthetic reactions at room temperature and include a large set of common factors present in reactions that may influence the metrics.
Table 1. Mass metrics.
In summary, the objective of this report is to discuss the variations of the metrics with the nature of the reactions (stoichiometry and molecular weights of the reagents and products) and conditions of their implementation (excess of reagents, amount of solvent, etc.), to show that the comparison of the values of mass metrics for different reactions has limitations and should be made with care.
Green chemistry mass metrics
The mass metrics considered in this study are defined in . Mass metrics evaluate either waste minimization (Environmental factor [E-Factor], mass intensity [MI]) or incorporation of atoms of reagents into the product (atom economy [AE], atom utilization [AU], RME, and element efficiency [XEE]). The stoichiometric greenness of a reaction can be improved by decreasing reagent waste and/or increasing the incorporation of reagent atoms in the product. The direction of variation (increase/decrease) of each metric which increase the greenness of the reaction and its ideal value are included in .
From these definitions, general formulae for the calculation of the mass metrics are presented in (details of the deductions are included in Appendix 1). All the formulae are provided for a chemical reaction represented by
Table 2. Formulae for the calculation of the mass metrics.a
where A and B are the stoichiometric reagents (A being the limiting reagent), P the product, D the by-products, and a, b, c, and d the stoichiometric coefficients. The greenness was also evaluated considering all the 12 Principles of Green Chemistry by calculation of the Green Star, as reported elsewhere Citation16 Citation19.
Factors affecting greenness
From formulae of mass metrics provided in , it is obvious that the yield, the excess of one stoichiometric reagent, and the mass of auxiliary materials and solvents influence the metrics, but AE is not affected by these factors. Beyond these effects, the stoichiometry and molecular weights also influence the metrics, but the effects depend on the values of these and change from case to case, showing no unique direction of variation. Therefore these factors were not included in .
Table 3. Influence of yield, excess of a stoichiometric reagent, auxiliary materials, and solvents on mass metrics.
From , it may be concluded that conflicts may occur in the effects of the experimental factors on the metrics, namely, the yield and the excess of a stoichiometric reagent have an opposite influence on the values of E-factor and MI: when the yield increases, these metrics decrease, but when the excess of a stoichometric reagent increases, they increase. However, the yield may increase when the excess of a stoichiometric reagent increases and then the increase in this excess will affect the metrics in opposite directions: increasing them, as shown in the first line of and decreasing them because the yield may increase, as shown in the second line. In this case, a compromise between the yield and the excess of a stoichiometric reagent must be attained to optimize the values of the metrics, but as the situation is complex this may not be easy. A similar situation is observed for RME/AU and XEE.
Preparation of case studies
The experimental values of the metrics used in the present discussion were obtained in the studies reported before Citation16 Citation19. presents a road map of the present study, showing for each case the conditions that were changed in successive synthesis experiments and the metrics influenced by them, as described below. All these syntheses were performed at room temperature, and water was the only solvent used. All the values of metrics are the average of three determinations with standard deviations included.
Table 4. Road map for the study.
Case study 1 – iron(III) tris(acetylacetonate)
The compound was prepared from iron(III) citrate, following a published protocol Citation19 Citation22. Sodium acetate (auxiliary material) was used as a buffer and was kept constant in all syntheses. The ratio of acetylacetone (Hacac):Fe(III) was varied to study the influence of excess of Hacac (3–140%) on the yield and metrics.
Table 5. Green chemistry mass metrics for iron(II) oxalate dihydrate synthesis.a
Case study 2 – iron(II) oxalate dihydrate
The compound was prepared from iron(II) sulfate heptahydrate and oxalic acid dihydrate under different conditions Citation16, following a published protocol Citation23. Sulfuric acid was used as an auxiliary material to acidify the iron(II) sulfate solution. Alternatively sulfuric acid was substituted by ascorbic acid to reduce iron(III). The ratio of oxalic acid:Fe(II) was varied to study the influence of excess of oxalic acid (9–76%) on the yield and metrics.
Results and discussion
Yield and excess of a stoichiometric reagent
Both case studies were used to investigate the influence of the yield and the excess of a stoichiometric reagent on the metrics in reactions with different stoichiometries (1:3 or 1:1).
Case study 1
The data obtained in case study 1 () on the synthesis of iron(III) tris(acetylacetonate) refer to a 1:3 reaction. Plots of the data collected in experiments (, data in of Appendix 3) show the variation in yield and metrics when the excess of Hacac was increased from 3% to 140%, as well as the variation of the metrics with the yield.
Figure 1. Influence of the excess of Hacac on mass metrics for the synthesis of iron(III) tris(acetylacetonate); ![]()
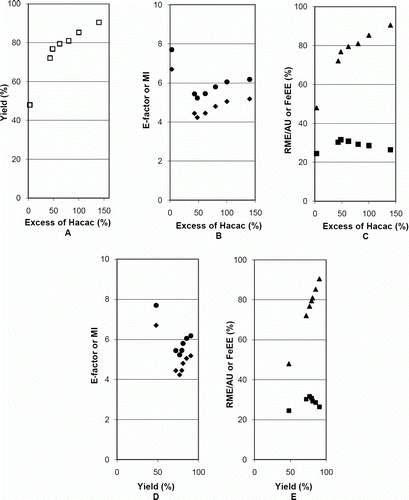
A shows how the excess of Hacac influences the yield, which increased but flattened above about 50% excess. With respect to the metrics, the E-factor and MI presented minima (B) and RME/AU presented a maximum (C) for about that same value of 50% excess, for which a yield of about 77%, far from the maximum (91%), was obtained. FeEE varied with the excess of Hacac similarly to the yield (A and C), being directly proportional to n P/n A (proportionality constant = 124.99) (as shown in A) and to the yield (B, proportionality constant = 1).
Figure 2. Influence of the yield and n P/n A on FeEE for the synthesis of iron(III) tris(acetylacetonate).
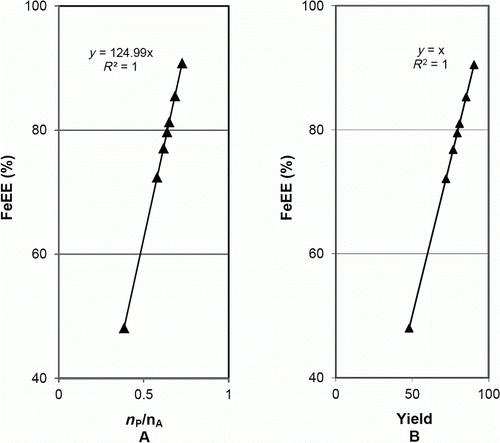
This behavior is predicted by formulae (18) and (19) (). In these formulae, n XB=0 (Fe only existed in the limiting stoichiometric reagent and in the product) and n XP/n XA=1/0.8 (a=1, c=0.8, n XP=1, and n XA=0.8, because the real percentage of iron in the sample of iron(III) citrate used was 18.3%). Substitution of these values in the formulae provides the following equations:
which are well fitted by the experimental data as shown in (data in of Appendix 3). These plots show the consistency of the values of the metrics, yield, and experimental conditions.
These results show that a large excess of Hacac increases the yield but provokes an increase of E-factor and MI and a decrease of RME, that is, worsens these metrics. In situations like this case, to optimize greenness, a compromise between the values of the amount of the stoichiometric reagent in excess and of the yield should be looked for.
To better characterize this type of compromise, it is convenient to visualize globally the dependence of RME on the excess and yield. For this purpose, it is possible to calculate values of RME as a bidimensional function of the yield and excess of Hacac (formula (17), , with m B/m’B substituted by (1 + x/100))
where y=yield (%), x=excess of Hacac (%), and ,
, and
(see details of the calculation of this expression in Appendix 2). Plots of this function in include as points either predicted individual values (calculated by the expression (20), A) or experimental data (B, data in of Appendix 3). In B, each point corresponds to an experiment performed under a set of fixed conditions and provides the value obtained for the metric. On the surfaces of the plots, the white lines indicate the same value of yield or the same value of excess and the lines between the different gray shadows refer to constant values of RME (they are level lines), as indicated on the right of the surfaces in .
Figure 3. Influence of yield and excess of Hacac on RME for the synthesis of iron(III) tris(acetylacetonate): (A) predicted data and (B) experimental data.
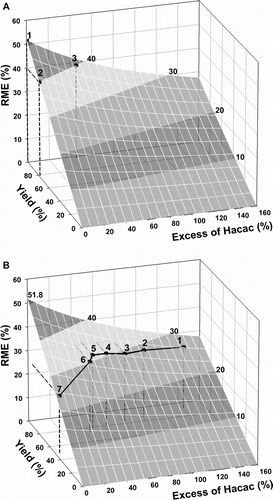
Although it would be possible to predict the best compromise between the yield and the excess of Hacac from the surface (the maximum value possible for RME, in this case, is 51.8% corresponding to a yield of 100% at stoichiometric conditions, point 1 in A), in real situations these optimum conditions are not practicable. Indeed, more broadly, the chemical nature of the reaction may limit the experimental points allowed on the surface. For example, as shown by data in A, a value of RME = 40% would be obtained by combinations of yield and excess of Hacac as 77% and 0% (point 2) or 95% and 43% (point 3), respectively. However, in real practice, a yield of 77% was only attainable with an excess of 48%, and a yield of 72% was reached with an excess of 43% (points 5 and 6, B, respectively).
Albeit this limitation (see further discussion below), these plots are useful to visualize the best directions to follow in the change of experimental conditions to improve greenness. When repeating experiments for improving greenness as measured by RME, one should move on these surfaces in the direction of highest value of RME, the point where the surface intersects the RME axis. For example, point 1 in the plot of B refers to a first experiment performed with an excess of 140% of Hacac, prescribed by the protocol used at the end of the study Citation19. To find the conditions of a new experiment to improve greenness, i.e. to raise RME, a decrease of the excess was implemented in a second experiment (point 2). As the yield decreased from the first to the second experiment, the point moved off the constant yield white line that passes through point 1, along the black line (an experimental line), the increase of RME being lower, but positive. Repetition of the procedure, as represented in the plot for experiments 2–5, improved RME up to 31.6% ( in Appendix 3). However, as discussed previously about , further decrease of the excess lowered the RME due to a large decrease of the yield (points 6 and 7, B). The black line on the surface expresses the constraints on the values of RME due to the relations between excess and yield imposed by the chemistry (thermodynamics, etc.) of the reaction, which mean that there are chemical limitations to raise the value of RME, as was indeed shown by the example. Thus the surface plot helps the experimenter to look for the best conditions to obtain greenness from the position of the point for each experiment, suggesting the best direction to increase greenness in a next experiment, but the degree of fulfillment of his good intention to increase the greenness is limited by the chemistry and depends on the reaction, occurring differences between reactions, even when the stoichiometry is the same.
Case study 2
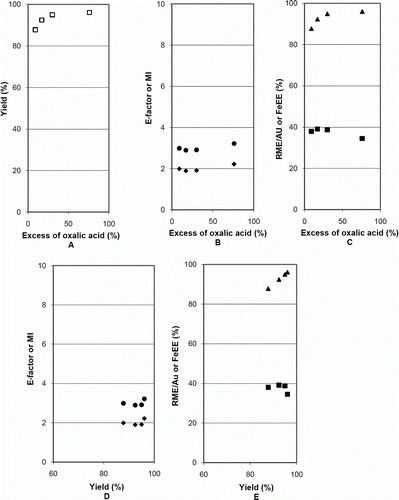
Plots for the case study 2, on the synthesis of iron(II) oxalate dihydrate, a 1:1 reaction, presented in (data in of Appendix 3), confirm the aforementioned conclusions about the influence of the yield and of the excess of a stoichiometric reagent on the metrics. The figures show that the yield increased with the excess of oxalic acid, but the variation flattened above 17% (A); the E-factor and MI presented minima and RME/AU a maximum (most favorable to greenness) at this excess of 17% of oxalic acid (B and C), corresponding to a yield of 92% (smaller than the 96% maximum); FeEE changed with the excess of oxalic acid in the same way as the yield (their values were equal, E), the explanation for this behavior being similar to that of the previous case. In summary, also in this case a compromise between the excess of a stoichiometric reagent and the yield is required to optimize the greenness, although the optimum occurs at a different position than in the previous case. To calculate values of RME as a function of yield and excess of oxalic acid, the same expression as in the previous case was used, with k 1=179.89, k 2=404.08, and k 3=1.26 (see details of the calculation of this expression in Appendix 2). In (data in of Appendix 3) the plot and the experimental data are represented. As discussed below, the RME surface is different from case study 1 because the stoichiometric ratio is different (1:1 instead of 1:3). For instance, the maximum possible value for RME, in this case, is 44.5% corresponding to a yield of 100% at stoichiometric conditions, but like in the previous, it is not attainable experimentally. In the series of experiments made in this case, the maximum RME attained experimentally was 39.1% for a yield of 92% when the excess of oxalic acid was decreased to 17% (represented by the point 3 in ). In the two first experiments, with larger excess of ligand, larger yields were obtained, but with lower RME (points 1 and 2). Further decrease of the excess deteriorated the greenness – lowered the RME (point 4).
Figure 4. Influence of the excess of oxalic acid on mass metrics for the synthesis of iron(II) oxalate dihydrate; ![]()
The comparison of with shows that although the shapes of the RME plots are broadly similar, their positions on the yield – excess co-ordinates are shifted, as well as the ranges of values. This behavior results from the differences not only on the stoichiometric coefficients (1:3 or 1:1, respectively) but also on the molecular weights of the compounds involved in the chemical reactions. This point is important: different reactions are represented by different surfaces, each plot being characteristic of a reaction.
Figure 5. Influence of yield and excess of oxalic acid on RME for the synthesis of iron(II) oxalate.
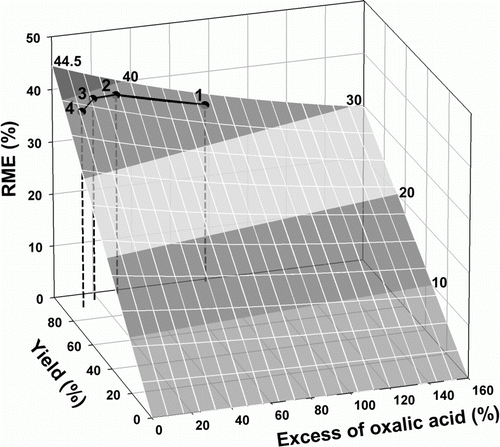
In conclusion, when comparison of different reactions is made, as the possible values of RME depend on the stoichiometry and the molecular weights of the reagents, the reliability of the comparison of metrics is problematic for reactions with different stoichiometry and/or reagents. As shown in and , the values of RME allowed by the formulae for calculation of metrics (expression (20) in the text) belong to a surface that is characteristic of each reaction, but the values obtained in practice depend on the excess–yield relationship (black lines on the surfaces). The surfaces of the metric change from reaction to reaction even when the stoichiometric ratio is the same because they depend on the molecular weights of the substances involved in the reaction.
Solvents and auxiliary materials
The data provided by case study 2 were also used to investigate the influence of water and auxiliary materials on the values of the metrics. For this purpose, the water was first ignored and afterwards considered in their calculation.
Water not considered
Data collected in case study 2 experiments of the synthesis of iron(II) oxalate, when the mass of solvent (water) was not considered, show the variation in the values of metrics when the mass of auxiliary materials varies. Data were obtained at constant excess of oxalic acid and yield, and only the mass of auxiliary materials changed as ascorbic acid or sulfuric acid were used as alternative auxiliary materials (see ). Values show that E-factor and MI increased when the mass of auxiliary materials increased, as expected, but AE, RME/AU, and FeEE showed no relevant changes, in agreement with the prediction in the last column of .
From formula (17) (), the values of RME/AU should be directly proportional to the yield, as in this case study the limiting reagent (iron(II) sulfate heptahydrate), the product and excess of oxalic acid are the same in both syntheses. Dividing the value of RME by the value of yield for each synthesis, the same value is indeed obtained, as shown in the last column of . As X = Fe only existed in the limiting reagent and in the product (n XB=0), and n XP/n XA=1, FeEE was directly proportional to the yield (formula (19), ), with the factor of proportionality being equal to one as, due to the stoichiometry of the reaction, a=c=1. This means that the values of FeEE and the yield should be the same and this was indeed found ().
These results show again perfect consistency between metrics and experimental conditions, as well as that the influence of these on the values of different metrics depends on the nature of these.
Water considered
Plots of the data for the synthesis of iron(II) oxalate dihydrate, in (data in of Appendix 3), show the variation of the E-factor, MI (when water was or was not considered) and yield, when the excess of oxalic acid was increased from 9% to 76% (the masses of auxiliary materials (m aux) and of water (m S) were kept constant).
Figure 6. Influence of the excess of oxalic acid on E-factor, MI, and yield for the synthesis of iron(II) oxalate dihydrate; ♦, E-factor; •, MI.
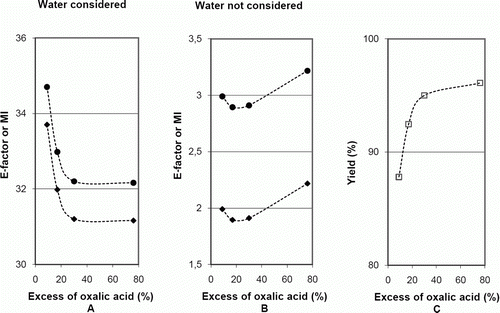
The results show that, when water was considered, the values of E-factor and MI were about 10 times larger than those when it was ignored, and decreased when the excess of oxalic acid increased, but flattened at about 30% of excess of oxalic acid (A). These results may be interpreted by analysis of the influence of the mass of solvents in formulae (3) and (4) (). When water was considered, (m S/m P) has a stronger influence than ((m A+m B+m aux)/m P) on the value of those metrics, because the mass of water (mS) was about 10 times larger than (m A+m B+m aux). As (m S/m P) decreases when the yield increases (formula (10), ), but is not influenced by the degree of excess of oxalic acid, the variations of these metrics are influenced by the variation of yield, as A and C shows.
Discussion
When water was ignored, the E-factor and MI showed a minimum when the excess of oxalic acid increased, having a higher value for a larger excess (B). In this case, as water was not considered, (m S/m P) is not included in the calculation of the metrics, and ((m A+ m B+m aux)/m P) is the only factor that influences the results. When the excess of oxalic acid increases, (m B/m′B) increases, which influences only (m B/m P) (formula (8), ). As this ratio increases, both the E-factor and MI increase. But when the yield increases (m A/m P), (m B/m P) and (m aux/m P) decrease (formulae (7)–(9), ) and, therefore, there occurs a competition between the positive effect of yield and the negative effect of the excess of oxalic acid, that acquires importance only when water is ignored. For these reasons, it seems preferable to ignore water in the calculations when the study of the influence of the excess of one stoichiometric reagent on E-factor and MI is at stake, although then the values of these metrics are not reliable for evaluation of global greenness. Some authors exclude water in metric calculations because this solvent is cheap and intrinsically safe Citation24. On the other hand, when metrics are used in biotechnology, where water is used in very large volumes, the inclusion of water in the calculations is important to assess the greenness of the processes Citation25.
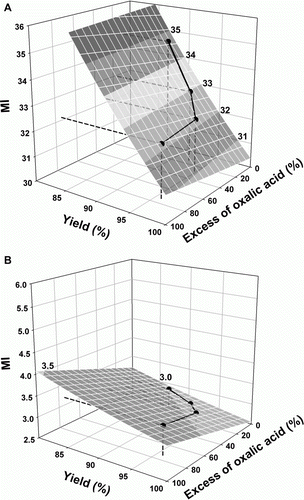
To visualize the relative influence of yield and excess of oxalic acid on MI, formula (5) () can be written as:
The equations, when water is or is not included, are represented in A and B, respectively, together with the experimental data. The comparison of the two figures exemplifies the importance of the solvent for the values of the metrics. Although the slope of the surface is much lower when water is excluded, the calculation of the metric without water is more useful to find optimum conditions for obtaining greenness, as shown in .
Figure 7. Influence of yield and excess of oxalic acid on MI for the synthesis of iron(II) oxalate, when water (A) is or (B) is not considered (the MI scale of B is two times lower than A).
In conclusion, the compromise between yield and excess of oxalic acid is determinant for optimization of greenness, but to study the influence of the excess of a stoichiometric reagent on the E-factor and MI it is preferable to ignore water in the calculation. However, solvents (including water, especially when used in very large volumes) are very important when greenness is at stake, because they contribute to large quantities of waste. This is well corroborated by the high values of E-factor and MI when they are included in the calculation (A).
Final discussion
In summary, the following specific conclusions have been drawn about the influence of yield, excess of reagents, mass of auxiliary materials, stoichiometry, and molecular weights of reagents on green chemistry mass metrics:
| 1. | The analysis of results based on the formulae derived shows that mass metrics are strongly influenced by stoichiometry and molecular weights of reagents. | ||||
| 2. | When mass metrics were used to improve greenness in case studies 1 and 2, this was optimized through a compromise between the excess of a stoichiometric reagent and the yield. A yield far below from the maximum led to more favorable RME, E-factor, and MI when the excess of the stoichiometric reagent was decreased, confirming that indeed other factors besides the yield are important for obtaining greenness. | ||||
| 3. | The influence of the excess of a stoichiometric reagent on E-factor and MI is relevant only when water is ignored in calculations, as case study 2 shows, but this is not suitable if evaluation of global greenness is required when large volumes of water are used, like in biotechnology (25). | ||||
| 4. | Case study 2 shows also that if a relevant element under consideration only existed in the limiting stoichiometric reagent and in the product, and the number of atoms of the element was the same in both, XEE was directly proportional to the yield and to n P/n A (ratio of actual quantities (mol) of the product to the limiting stoichiometric reagent). | ||||
| 5. | Different metrics used in both case studies show different sensitivity to the mass of auxiliary materials: the increase of this mass increased the E-factor and MI, but RME/AU, FeEE, and AE were not influenced. | ||||
It is important to note that these conclusions are valid only for the cases studied, which involve simple synthetic reactions. The complexity of the factors that influence mass metrics found for these simple cases shows that generalizations of the conclusions to other more complex reactions has to be assessed considering carefully their features case by case.
Conclusions
This study gives evidence of some of the numerous factors that influence the values of mass metrics and have to be considered when selecting procedures and conditions to pursue greener syntheses, namely stoichiometry, molecular weights of chemical compounds, excess of reagents, amount auxiliary materials, solvents/water, and yield. The results show, above all, that the dependence of the different metrics on such factors is very complex, varying not only with the metric itself and with the factor considered, but also with the characteristics of the reactions (stoichiometry, molecular weights of the reagents involved, etc.). Therefore, the comparison of values of metrics for different reactions should be done with extreme caution, and this constitutes a strong limitation of this type of metrics. In particular, the comparison of metrics for reactions with different stoichiometry is problematic.
Mass metrics are useful for evaluation of the greenness of chemical reactions in the laboratory and the formulae used allowed interpreting their variations when sets of different conditions were established. The formulae derived and their applications were useful to increase insight in the behavior of those metrics when conditions of reactions were changed. The “theoretical” behavior of metrics visualized by graphic representations and their inspection, together with the results of real situations, allows a better understanding of the complexity of chemical reactions and shows how difficult it is to deal simultaneously with all the factors at play in them to improve greenness. However, the optimization of metrics based on their plots may not be practicable owing to the complex nature of the chemistry, for instance, the limitations on yields imposed by thermodynamics (mass metrics and therefore their plots consider only the stoichiometric aspects of chemical reactions). On the other hand, if other aspects such as low toxicity of materials, safety, and energy consumption are added, the task of assessing chemical greenness is huge, and holistic metrics Citation16 Citation19 are preferable to evaluate the overall process and help chemists to improve it.
However, the consistency of the experimental data with the calculated predictions for the values of the metrics found in the present study confirm that it is worthwhile to pay much more attention to the effort of obtaining quantitative details of the syntheses in the laboratory to acquire information for assessment of greenness, as suggested by Winterton when he proposed the second 12 Principles of Green Chemistry Citation20. It is hoped that this study helps to elucidate the relationships between the different mass metrics, which are complex and have not been discussed often in the literature, and to call the attention of green chemists for the caveats against the comparison of the values of metrics for different reactions.
Finally, the present results confirm that chemistry is complex, and indeed not as linear as its reductionist academic teaching suggests, and that therefore systems thinking should deserve more attention in its green implementation, which involves a lot of features to be considered at the same time. Therefore, the development of holistic metrics deserves interest in green chemistry, albeit their construction and handling is more difficult than for mass metrics.
Acknowledgements
The authors wish to thank the pre-service teachers Olga M.S. Martins and M. Salomé Fernandes for their support in the laboratory work. M.G.T.C.R. work has been supported by Fundação para a Ciência e a Tecnologia through grant no. PEst-C/EQB/LA0006/2011.
References
- Lapkin , A. ; Constable D. ,; Green Chemistry Metrics – Measuring and Monitoring Sustainable Processes ; Wiley : Chichester , , UK , 2009 .
- Steinbach , A. ; Winkerbach R. Chem. Eng . 2000 , April , 94 – 104 .
- Trost , B.M. Science 1991 , 254 , 1471 – 1477 .
- Sheldon , R.A. Chem. Ind . 1992 , 903 – 906 .
- Sheldon , R.A. Chem. Tech . 1994 , 24 , 39 – 47 .
- Constable , D.J.C. ; Curzons , A.D. ; Cunningham , V.L. Green Chem . 2002 , 4 , 521 – 527 .
- Anastas , P.T. ; Warner , J.C. Green Chemistry – Theory and Practice ; Oxford , UP : Oxford 1998 ; p. 30
- Allen , D.T. ; Shonnard , D.R. Green Engineering– Environmentally Conscious Design of Chemical Processes ; Prentice-Hall : Upper Saddle River , 2002 .
- Curzons , A.D. ; Constable , D.J.C. ; Mortimer , D.N. ; Cunningham , V.L. Green Chem . 2001 , 3 , 1 – 6 .
- Hendershot , D. J. Chem. Health Saf . 2009 , 16 , 46 – 47 .
- Gupta , J.P. J. Loss Prev. Proc. Ind . 2005 , 18 , 195 – 196 (and other papers in this Special Issue on Bhopal disaster) .
- Crowl , D.A. ; Louvar , J.F. Chemical Process Safety Fundamentals with Applications , 2nd ed .; Prentice-Hall : Upper Saddle River , NJ , 2002 .
- CCPS, AIChE . Inherently Safer Chemical Processes – A Life Cycle Approach , 2nd ed. (revised) ; Wiley : Hoboken , NJ , 2009 .
- http://pinboard.in/u:dchas (accessed Jan 2012).
- Graedel , T.E. Pure Appl. Chem . 2001 , 73 , 1243 – 1246 .
- Ribeiro , M.G.T.C. ; Costa , D.A. ; Machado , A.A.S.C. Green Chem. Lett. Rev . 2010 , 3 , 149 – 159 .
- Ribeiro , M.G.T.C. ; Costa , D.A. ; Machado , A.A.S.C. Química Nova 2010 , 33 , 759 – 764 .
- Costa , D.A. ; Ribeiro , M.G.T.C. ; Machado , A.A.S.C. Química, Bol. S.P.Q . 2009 , 115 , 41 – 49 ; (b) Costa, D.A.; Ribeiro, M.G.T.C.; Machado, A.A.S.C. Química, Bol. S. P. Q. 2011, 123 , 63 – 72 .
- Ribeiro , M.G.T.C. ; Machado , A.A.S.C. J. Chem. Ed . 2011 , 88 , 947 – 953 .
- (a) Andraos , J. Org. Process Res. Dev . 2005 , 9 , 149 – 163 ; (b) Andraos, J. Org. Process Res. Dev. 2005, 9, 404–431; (c) Andraos, J. Org. Process Res. Dev. 2006, 10, 212–240; (d) Andraos, J. J. Chem. Ed. 2007, 84, 1004 – 1010 .
- Winterton , N. Green Chem . 2001 , 3 , G73 – G75 .
- Szfran , Z. ; Pike , R.M. ; Foster , J.C. Microscale General Chemistry Laboratory With Selected Macroscale experiments ; NY : John Willey & Sons , 2003 .
- Pass , G. ; Sutcliffe , H. Practical Inorganic Chemistry ; Chapman and Hall : London , 1974 .
- Selva , M. ; Perosa , A. Green Chem . 2008 , 10 , 457 – 464 .
- Ritter , S.K. C&EN 2008 , 86 4 , 63 – 66 .
Appendix 1: Formulae for the calculation of green chemistry mass metrics
Environmental factor (E-factor) , as the ratio of the total waste mass to the mass of product. Often, it is difficult or impossible to determine the mass of the waste, so it is calculated as the total mass of reagents less the mass of the product.
Mass intensity (MI) , as the ratio of the total mass of reagents (stoichiometric reagents, auxiliary reagents, solvents, etc) to the mass of product.
and
therefore
and therefore
Substituting n P/n A in expression (9)
and
therefore
Substituting m A (expression (13)) in expression (18):
From expression (9)
Substituting m
P (expression (23) in and
(expression (5)):
Substituting (expression (12))
(expression (20))
(expression (24))
(expression (25)) in expression 5:
Atom economy (AE) , as the ratio of the mass of atoms of stoichiometric reagents that are incorporated in the final product (molecular weight of the product) to the mass of total atoms of stoichiometric reagents (sum of the molecular weights of stoichiometric reagents), as a percentage. It was assumed that there were no losses in the process and that all stoichiometric reagents were converted to product and by-products (stoichiometric conditions, yield of 100%) and the mass of solvents and auxiliary reagents is not considered.
Atom utilization (AU) , as the ratio of the mass of product to the mass of all the substances produced in the chemical reaction (product and by-products), expressed as a percentage. Often, it is difficult or impossible to determine the mass of the by-products, so it was calculated as the total mass of reagents less the mass of the product.
Relative mass efficiency (RME) , as the ratio of the mass of product to the mass of stoichiometric reagents, as a percentage.
Dividing the numerator and the denominator (expression (35)) by (n A)
From expression (9)
Substituting n P in expression (36)
From expression (14)
Substituting n A in expression (38)
therefore
Element efficiency (XEE) , as the ratio of the mass of element X in the product to the mass of total X present in reagents, as a percentage. It occurs in both reagents (A and B).
Dividing the numerator and the denominator (expression (44)) by AWX
Dividing the numerator and the denominator (expression (45)) by n A
From expression (9)
From expression (14)
Substituting (expression (47)) and
(expression (48)) in expression (46)
Dividing the numerator and the denominator (expression (49)) by n XA
Appendix 2. Expressions for plotting the 3D figures
Expression (20):
– influence of yield and excess of Hacac on RME for the synthesis of iron(III) tris(acetylacetonate)
y=yield (%), x=excess of Hacac (%), a=1, c=0.8, b=3, MWA=244.94, MWB=100.12, and MWP=353.17.
– influence of yield and excess of oxalic acid on RME for the synthesis of iron(II) oxalate.
y=yield (%), x=excess of oxalic acid (%), a=b=c=1, MWA=278.01, MWB=126.07, and MWP=179.89.
Expression (21)
:
– influence of yield and excess of oxalic acid on MI for the synthesis of iron(II) oxalate.
y=yield (%), x=excess of oxalic acid (%), a=b=c=1, MWA=278.01, MWB=126.07, MWP= 179.89, m A=5 g, m aux=1 g, m S=90 g (water is the only solvent).
k 5=3037.34 (if water is considered), k 5=255.54 (if water is ignored).
Appendix 3. Tables of values of metrics for the experiments.
Study case 1. Synthesis of iron(III) tris(acetylacetonate)
Table 6. Mass metrics (values plotted in and A of the text).a
Table 7. FeEE as a function of amounts of reagents (values plotted in of the text).a
Study case 2. Synthesis of iron(II) oxalate dehydrate