
Abstract
A modified version of the quick, easy, cheap, efficient, rugged, and safe method is proposed for the determination of chlorinated pollutants in soil samples. Measurements were collected using a programmed temperature vaporizer coupled to a gas chromatograph and a µ-electron capture detector. The optimization and validation of this extraction technique for these compounds in soils have been performed in order to provide an alternative tool for determining these kinds of pollutants in soils. Advantages over conventional extraction techniques include the applicability to compounds of very different volatilities and polarities, the low cost of the reagents employed, and the possibility of being used by nonspecialist operators, with standard analytical tools. This method can be considered more environmentally friendly, due to the reduction of solvent and energy consumption and to the elimination of harmful organic solvents, reducing the negative impact of chemical analyses on the environment (principles of green analytical chemistry).
1. Introduction
Currently, soils can be subjected to intensive contamination with chemical compounds. Soil is a complex matrix whose composition is highly heterogeneous and varies from those with high organic material to those with high mineral content. Following their contact with the soil, contaminants enter into various physicochemical interactions with the mineral and organic components of the matrix. The final result depends on the rate ratios and the thermodynamic parameters of the retention, infiltration, evaporation, dissolution, and biodegradation of the contaminants (Citation1).
Volatile halogenated organic compounds (VHOCs) and chlorobenzenes have received special attention as soil pollutants (Citation2–Citation5). They have been used as solvents, cleaning and degreasing agents, polymerization modifiers, and heat-exchange fluids (Citation6). This group of compounds includes several suspected carcinogens; for example, tetrachloroethylene has been classified as probable human carcinogen (class 2A) by the International Agency for Research on Cancer (Citation7, Citation8). Chlorobenzenes are also introduced into the environment in considerable amounts through their use as solvents, dielectric fluids, deodorants, and as intermediates in the manufacture of other chemical products such as pesticides, phenols, and dyestuffs (Citation3, Citation9). They are prevalent in both solid and liquid industrial effluents and in atmospheric discharges. Chlorobenzene, 1,2,4-trichlorobenzene, hexachlorobenzene, 1,2-dichlorobenzene, 1,3-dichlorobenzene, 1,4-dichlorobenzene have been listed as priority pollutants in water matrices by the US Environmental Protection Agency (USEPA; 10); and some of them, such as hexachlorobenzene, are known to be carcinogenic for humans (Citation11). C1–C3 halogenated hydrocarbons and chlorobenzenes have also been included in the EPA Soil Screening Guidance (Citation12).
Soil samples usually require special pretreatment prior to the final analysis. Such pretreatment involves the isolation of the compounds from the primary matrix and their transfer to a secondary matrix, with the simultaneous removal of interfering substances. The methods recommended by the USEPA (EPA/SW-846-5021 and 5035) for the measurement of volatile organic compounds (VOCs) in soils are purge-and-trap and static headspace followed by gas chromatography–mass spectrometry (Citation13). Other USEPA methods currently used for the extraction of semi-VHOCs such as chlorobenzenes are Method 3540 (Soxhlet extraction) and Method 3550 (sonication extraction; (Citation14). Other techniques have been proposed for the analysis of VOCs, including VHOCs in soil samples, such as purge-and-membrane mass spectrometry (Citation2) or headspace–solid-phase microextraction (Citation15). Pressurized subcritical water extraction combined with stir-bar sorptive extraction (Citation16) and headspace–solid-phase microextraction (Citation3) has also been used for the analysis of chlorobenzenes in soils.
Salting-out-assisted liquid–liquid extraction (SALLE) is a technique based on liquid–liquid extraction in which an appropriate concentration of salt is added to achieve the separation of the aqueous phase from the partially miscible organic phase. In the environmental field this technique has been employed for the extraction of endocrine disruptors (phenols), nitrotoluenes, and pharmaceuticals from natural and wastewater samples (Citation17–Citation19). In 2003, Anastassiades et al. (Citation20) introduced the quick, easy, cheap, effective, rugged, and safe (QuEChERS) method for the analysis of pesticide residues in fruits and vegetables. The procedure involves an initial single-phase extraction of the sample with acetonitrile, followed by liquid–liquid partitioning, performed by the addition of anhydrous MgSO4 plus NaCl. Removal of the residual water and cleanup are performed simultaneously by using a rapid procedure called dispersive solid-phase extraction (dispersive SPE). Although the QuEChERS method has mainly been used for the determination of a broad range of pesticides in food matrices (Citation21), in soil samples it has been employed to analyze pesticides (Citation22–Citation25), bactericides (Citation26), phenols and cresols (Citation27), and pharmaceutical compounds (Citation28, Citation29).
In previous work developed at our laboratory, a modified version of the combination of SALLE and QuEChERS methodologies was initially evaluated in soil matrices (Citation30), and it was successfully applied for the determination of trihalomethanes and benzene, toluene, ethyl benzene, and xylenes in soil samples (Citation31, Citation32). This method, which involves the reduction in the use of reagents, energy consumption and waste generation, and the elimination of risk and hazard, can be considered environmentally friendly due to it follows important, principles of what is known as green analytical chemistry (Citation33). The most important challenge to the future of this discipline is to reach a compromise between the increasing quality of the results and the improving environmental friendliness of analytical methods.
The main objective of the present work was to optimize and validate a simplified methodology based on QuEChERS and SALLE that could be used for the simultaneous extraction and determination of volatile and semivolatile pollutants in soils. A broad range of compounds was selected, taking into account the EPA Soil Screening Guidance (Citation34): C1–C3 halogenated hydrocarbons and chlorobenzenes.
2. Experimental
2.1. Chemicals and standard solutions
Analytical standards of 1,2-dichloroethane, carbon tetrachloride, 1,3-dichloropropylene, 1,1,2-trichloroethane, tetrachloroethylene, 1,1,2,2-tetrachloroethane, 1,4-dichlorobenzene, 1,2-dichlorobenzene, hexachloroethane, 1,2,4-trichlorobenzene, and hexachlorobenzene were supplied by Sigma-Aldrich (Steinheim, Germany). The physical properties of the compounds under study are shown in . Acetonitrile was from Merck (Darmstadt, Germany) and ethyl and propyl acetate were from Sigma-Aldrich. Anhydrous magnesium sulfate and sodium chloride were from Scharlau (Barcelona, Spain). Ultrapure quality water obtained with an Elgastat UHQ water purification system was used.
Table 1. Retention times and physicochemical characteristics of the analytes studied.
Stock solutions (500 mg/L in ethyl acetate) of each compound were prepared and stored at 4 °C in a refrigerator. Working solutions containing the 11 compounds were prepared by dilution with ethyl acetate at the appropriate concentrations prior to optimization of the instrumental conditions and the spiking of the soil samples.
For the optimization of the instrumental conditions, solutions of the analytes in the 2.5 mg/L (1,2-dichloromethane) to 12.5 µg/L (hexachloroethane and hexachlorobenzene) range were used.
2.2. Soil samples
Soil matrices were used to determine the analytical characteristics of the method and to study the feasibility of using different extraction solvents and the effects of the addition of different amounts of salts on extraction efficiency. Two types of soils were chosen: a soil from a public garden (Salamanca, Spain) and a reference non-polluted soil (RTC-CLN SOIL-3) purchased from LGC Promochem (Barcelona, Spain).
To spike the samples, a 20-g portion of soil was placed in an ambered 100 mL flask and 2 mL of a solution of the compounds to be determined in ethyl acetate (at a suitable concentration) was added. The flask was closed hermetically and shaken vigorously for 15 min to achieve perfect homogenization of the compounds in the matrix. The samples were stored in a refrigerator (4 °C) for at least 14 days.
For the optimization of the extraction conditions, soils were spiked with the assay compounds at different concentrations ranging from 0.2 mg/kg for hexachloroethane to 50 mg/kg for 1,2-dichloroethane.
Evaluation of the method was performed using fractions of 2.5 g of garden soil spiked at the concentration level required in each case. The absence of the analytes was confirmed by subjecting a portion of soil to the extraction procedure and to the ensuing instrumental analysis.
To validate the optimized method, two certified reference materials (CRMs) were analyzed. The CRM soils used were RTC-CRM631 and RTC-CRM635. Both were purchased from LGC Promochem (Barcelona, Spain).
Physicochemical properties of the soils used in this study are given in .
Table 2. Physicochemical properties of the soil samples.
2.3. Analytical procedure
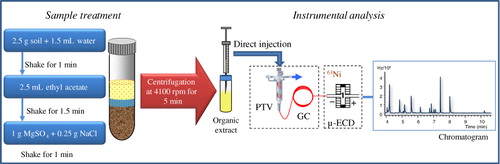
The whole analytical procedure, including the extraction step, programmed temperature vaporizer (PTV–GC) injection and separation of the compounds and µ-ECD detection are schematized in . Experimental conditions are detailed in the following sections.
2.3.1. Sample treatment
Extraction and partitioning were carried out according to a modified version of the QuEChERS method, as described in a previous work (Citation30). Briefly, 2.5 g of spiked soil was weighed in a 15-mL glass centrifuge tube with a screw cap, which kept the tube closed during most of the sample preparation step, thus reducing losses of volatile compounds. 1.5 mL of deionized water was added to the soil sample and the mixture was shaken for 1 min with a vortex device (Velp Scientifica, Italy) at 2000 rpm. Then, 2.5 mL of ethyl acetate was added and the mixture was shaken again for 1.5 min (vortex device, 2000 rpm). Following this, 1.25 g of salt was added (1 g MgSO4 + 0.25 g NaCl), shaking the mixture for 1 min (vortex device, 2000 rpm). The tubes were centrifuged at 4100 rpm (Mod. Digicen, ALRESA, Spain) for 5 min and an aliquot of the organic solvent was subjected to gas chromatographic analysis.
2.3.2. Programmed temperature vaporization and gas chromatography–µ-ECD analysis
Briefly, an Agilent Technologies 7890A gas chromatograph equipped with a 7683 autosampler, a PTV inlet (Agilent 6890), and a µ-electron capture detector (µ-ECD, Agilent Technologies) were used for this work. In addition, a Hewlett-Packard (Agilent) 5973N mass selective detector was used for confirmation of identity and retention times. The column was a DB-VRX (Agilent Technologies) having a length of 20 m, an internal diameter of 0.18 mm, and a film thickness of 1.0 µm (Part No. 121–1524).
After method optimization, the following conditions were fixed. A volume of 3 µL of sample was introduced through the automatic liquid sample injection system. The solvent-vent mode was used. The PTV was equipped with a 71 × 2 mm liner packed with Tenax-TA (Gerstel, Part No. 013247-005-00), a hydrophobic polymer designed to trap organics. Cooling was accomplished with liquid CO2 (Air Liquide).
The injector starting temperature was 30 °C. The vent flow was adjusted to 20 mL/min and the vent pressure to 5.00 psi. After 0.5 min, the split valve was closed and the liner was flash-heated at 12 °C/s to 300 °C. The analytes were transferred from the liner to the capillary column (1.5 min). The split valve was then opened and the liner temperature was held at 300 °C for 5.00 min (Supplementary Material, Figure 1S).
Gas chromatographic analysis was performed with an Agilent chromatograph equipped with a 63Ni µ-ECD. A DB-VRX capillary column (20 m × 0.18 mm × 1 µm, working range –10 to 260 °C) for fast gas chromatography from Agilent J&W was used. The carrier gas was helium N50 (99.999% pure; Air Liquide). The column oven temperature program involved an initial temperature of 45 °C for 2 min; an increase at 20 °C/min to 105 °C, followed by an increase at 60 °C/min to 175 °C, and finally an increase at 45 °C/min to 240 °C, holding for 3.05 min (total chromatographic run time, 10.61 min) (Supplementary Material, Figure 1S). The parameters of the µ-ECD were as follows: temperature, 300 °C and make-up flow gas (N2, Air Liquide), 20 mL/min. Identity of the compounds was checked using a mass spectrometer detector.
Data collection was performed with a GC ChemStation, G2075BA Ver. B.03.01 software from Agilent Technologies.
3. Results and discussion
3.1. Extraction
An ideal solvent should be compatible with: (Citation1) the analytes, (Citation2) sample preparation, and (Citation3) GC analysis. These three requirements mean that all analytes of interest should be sufficiently soluble and stable in a given solvent, that the same solvent should be used in the extraction and/or cleanup step to avoid solvent exchange, and that the physicochemical properties of the solvent should allow an optimal GC analysis of a diverse range of analytes (Citation35).
Acetonitrile, ethyl acetate, and propyl acetate were compared in order to study their suitability as extracting solvents. Two different types of soils were used (): a garden soil and a reference non-polluted soil.
The final cleanup step (dispersive SPE) used in standard QuEChERS methods was seen to be unnecessary due to the nonfatty characteristics of the soil matrices and the high degree of selectivity and sensitivity of the GC–µ-ECD system for halogenated analytes.
The analytes were stable and soluble in all the solvents assayed. However, propyl acetate elicited severe distortions of the analyte peaks in the early elution zone of the chromatogram, even when a volume as small as 0.2 µL was injected (). Peak broadening of the first two peaks was observed with acetonitrile as from 1.0 µL injection volume (), whilst a complete distortion of all the peaks was found for an injection volume of 5.0 µL (). This effect was not observed upon using the same volumes of ethyl acetate ( and ). This peak broadening was expected due to solvent volatility. Propyl acetate, with a boiling point of 102 °C, was the less volatile one and, thereby, the most remaining solvent after the purge step, giving the worse results. However, ethyl acetate, with a boiling point of 77.1 °C, was the most volatile one, showing the best behavior.
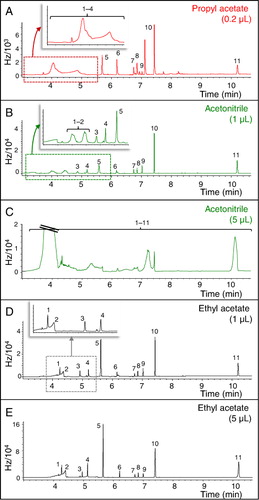
Extraction with acetonitrile and ethyl acetate was compared using 0.2 µL injection volume. No significant differences were observed between the signals afforded by the two solvents, except for the first two compounds in garden soil, for which ethyl acetate was the best choice due to an increase in the signals area. In view of the results obtained, ethyl acetate was confirmed as a better extracting solvent.
A study of the effect of the addition of salts was performed, in the range of 1.0–2.0 g for MgSO4 and of 0–0.50 g for NaCl. It was observed that for most of the target compounds, the best conditions were obtained maintaining the proportions of the original QuEChERS method (1 g of MgSO4 and 0.25 g of NaCl for 2.5 g of sample).
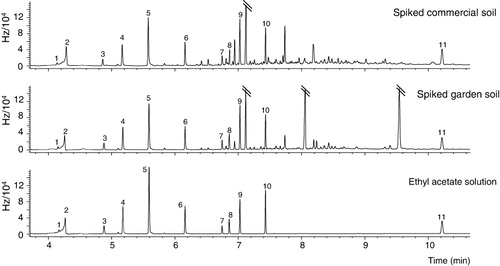
compares the chromatograms obtained when a solution of the analytes in ethyl acetate was injected with the chromatograms obtained when extraction from the garden soil and the reference non-polluted soil was performed. As may be seen, the chromatograms are fairly similar, with the presence of other compounds that are naturally present in the soils but that do not interfere with the analytes under study.
3.2. Optimization of the programmed temperature vaporizer
Once the extraction conditions had been optimized, the chromatographic injection mode was optimized. In this case solutions of the compounds in ethyl acetate were employed.
Among the injection modes permitted by the PTV, the solvent-vent mode was selected. In order to guarantee analyte retention in the liner during solvent elimination, a liner packed with Tenax-TA was used. Its use is especially important for the most volatile analytes studied here.
The variables optimized in the solvent-vent injection were: injection volume, venting temperature, venting flow, venting time, and injection time.
The injection volume was studied for the values 0.2, 1, 3, and 5 µL. As the injection volume increased so did the signal. The increase in signal between 0.2 and 3 µL was proportional. However, for 5 µL the signals did not increase very much, except for the least volatile compounds, and broadening of the peaks was observed for this volume. Accordingly, a working volume of 3 µL was chosen as a good compromise.
The initial temperature of the liner, or venting temperature, was studied in the 0 to 50 °C range. In the case of venting flow and venting time, values between 10 and 50 mL/min and between 0.25 and 1 min, were studied, respectively. As these variable values increased, the signals of the most volatile compounds (from 1,2-dichloroethane to tetrachloroethylene, from 77 to 121 °C) decreased, indicating that the retention of the analytes in the liner was lower, part of them being removed with the solvent during the purge step. However, at low values the retention times of those volatile compounds were modified, probably because not all the solvents introduced into the column had been removed. Compromise values for temperature (30 °C), venting flow (20 mL/min), and venting time (0.5 min) were chosen, since as from these values the retention times remained constant.
The injection time was studied for values between 1.0 and 2.0 min. The maximum signals were observed as from 1.5 min. This time was sufficient for complete injection of the sample.
Finally, in order to confirm that solvent-vent was the most suitable injection mode, we compared it with the signals obtained for the same sample using the hot splitless injection mode (injection temperature 250 °C, with a splitless time of 2 min). In both cases, the injection volume was 3 µL and the Tenax-TA liner was maintained. In the case of the most volatile compounds the signals obtained with the solvent-vent injection mode were slightly lower, with a decrease ranging from 20% for 1,2-dichloroethane to 8% for tetrachloroethylene. By contrast, in the case of the least volatile compounds, the optimum signals were obtained with the solvent-vent injection system, and a distortion of the peaks was observed in the hot splitless injection mode (behavior described as “band broadening in space”).
Accordingly, it was observed that although the solvent-vent injection mode is more usual for analytes less volatile than the solvent it can also be used in methods in which the boiling point range begins at values close to that of the solvent.
3.3. Recovery study
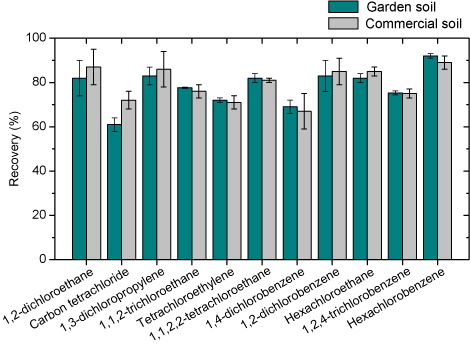
We conducted the recovery study with the final optimized method (sample preparation and instrumental conditions) at different concentrations of the analytes, in the two matrices used for optimization of the extraction process (garden soil and reference non-polluted soil), comparing the signals obtained in the soils with those obtained upon injecting ethyl acetate solutions of the analytes at the same concentrations. shows the results obtained for each compound and each soil as means of the values obtained for four concentration values. The recoveries of the spiked samples were in the 61–92% range, with relative standard deviations (RSDs) that did not exceed 10%. The extraction yields were similar for both types of soil.
3.4. Study of the matrix effect
Various analyte–matrix interaction forces ranging from van der Waals forces, H-bonding, to covalent bonding are involved in the sorption of organic chemicals by soils. Clay content, amount of organic matter, and soil pH are some of the variables that would affect sorption capacity (Citation36).
To investigate the influence of soil matrix on the extraction procedure, the garden soil and the reference non-polluted soil were used. These two soils had different properties (). They were spiked at four different concentration levels. Each level was analyzed in triplicate and the slopes of the regression curves, as well as the slopes of the regression curve obtained with solutions in ethyl acetate, were compared (). The slopes of the calibration curves were compared using a student's t-test analysis, and significant differences were observed between the different samples, showing that the matrix composition influences the extraction procedure. Accordingly, a standard addition protocol was selected to measure the analyte concentrations in the samples.
Table 3. Comparison of the slopes obtained for each of the soils and standards in ethyl acetate.
3.5. Validation of the method
The analytical characteristics of the method were studied using samples of spiked garden soil. The results obtained are shown in . Calibration curves were obtained for each compound. The peak area of the signal was used as the analytical signal (Supplementary Material, Figure 2S). The calibration models displayed linear behaviour. The validity of the models generated was checked using analysis of variance (ANOVA), and it was observed that they did not exhibit any lack of fit. The values of the correlation coefficient (R2) were higher than 0.99.
Table 4. Analytical characteristics of the method (garden soil).
The limits of detection (LODs) and the limits of quantification (LOQs) were calculated as 3.3 and 10 times, respectively, the standard deviation of a sample with an S/N ratio of 3. Instrumental and method values were obtained. The instrumental LODs (calibration curves obtained with ethyl acetate solutions) were between 4 ng/L for tetrachloroethylene and 0.85 µg/L for 1,1,2-trichloroethane (data not shown). Method LODs () were between 25 ng/kg for hexachloroethane and 2.61 µg/kg for 1,1,2-trichloroethane. These values were highly satisfactory (Citation25, Citation37), taking into account the low sample requirement (2.5 g) and that just one sample preparation technique were used for the determination of compounds with very different volatilities.
The instrumental repeatability of the optimized method was studied by injecting the same soil extract 10 times (at a concentration of 10 times the LOD for each compound), values below 4% being obtained in all cases.
Reproducibility of the method was obtained upon injecting extracts from 10 different soil samples (10 times the LOD). These values were higher than for the repeatability (in all cases below 12%), since in this case the errors associated with sample handling were involved. The highest values corresponded to the first two analytes, the most volatile compounds and those most susceptible to becoming lost during the extraction process. However, these values were highly satisfactory, and highlight that, although the use of this simplified methodology requires multiple opening of the vials, it affords adequate results for volatile compounds.
Although gas extraction techniques have important advantages, such as simplicity of operation, without analyte losses, the elimination of high solvent consumption and ease of automation, their principal disadvantages are that they are only applicable to volatile analytes; they need specific instrumental configurations, with relatively high cost, and the extraction times can be relatively long. The main advantages of the method proposed here are its applicability to compounds of very different volatilities and polarities, the low cost of the reagents employed, and the possibility of being used by nonspecialist operators, with standard instrumentation, such that it is a valid alternative to those described above.
3.6. Determination of the target compounds in soils
Determination of the accuracy of the method was performed using two different CRMs, RTC-CRM635-030 and RTC-CRM631-030, using the standard addition protocol. Some physicochemical characteristics of both soils are shown in . The content of the samples was certified by USEPA SW846, 3rd edition Method 8260B (Citation12).
In each of the soils, a five-level calibration study was performed, analyzing three replicates from each level. The concentrations of each compound added were uniformly distributed from 0 µg/kg to the highest concentration level, which in each case was calculated such that it would approximately coincide with twice the certified value, thus achieving the minimum uncertainty associated with the prediction. As shown in , the concentrations found in CRM631 and CRM635 soils are in good agreement with the certified concentrations, all predictions lying within the prediction intervals fixed.
Table 5. Results of prediction using standard addition protocol on the soils with a certified content (CRM).
For the compounds not present in the certified soil samples, the predictive ability of the method was assessed by spiking both soils at one concentration level and obtaining the predictions using the standard addition protocol. The results are shown in . Predictions coincide with the concentrations at which the soils were spiked, with a slight difference for hexachlorobenzene in CRM631-030 soil.
Table 6. Results of prediction in the CRM soils spiked with the compounds not initially present (1,1,2-trichloroethane, hexachloroethane, 1,2,4-trichlorobenzene, and hexachlorobenzene) by using standard addition protocol.
4. Conclusions
Here we propose a simplified version of the QuEChERS method for the determination of seven common chlorinated hydrocarbons and four chlorobenzenes in polluted soil samples. Three solvents for use in extraction were studied. Ethyl acetate was chosen as the extraction solvent owing to its better chromatographic behavior. Clean soil extracts were obtained without a cleanup step, thereby reducing sample handling and the errors associated with this.
The method proposed here is reproducible, with 3.20 and 11.13% RSD values, and highly sensitive, with method LODs ranging from 30 ng/kg to 2.87 µg/kg. The accuracy of the method was verified by analyzing two CRMs and proved to be satisfactory. These results prove that, although the use of this simplified methodology requires multiple opening of the vials, it affords adequate results for volatile compounds, being a valid alternative to gas extraction techniques. Moreover, with this technique, it is possible to perform the analysis of volatile and semivolatile compounds, avoiding the need to use different extraction techniques according to the volatility of the analytes.
From the point of view of Green Chemistry, the proposed method has important advantages over conventional ones (such as Soxhlet extraction): significant reduction in the amount of solvent used (2.5 mL per sample), which reduces waste generation and shortens extraction time (8.5 min), and reduction of the amount of sample required, energy input, and cost. Thus, this could be a method of choice for soil contamination environmental studies, covering compounds of very different volatilities and physicochemical properties.
Supplemental Material
All Supplemental Material is available alongside this article on www.tandfonline.com – go to http://dx.doi.org/10.1080/17518253.2014.895860
Supplemental_Material.pdf
Download PDF (40.2 KB)Acknowledgments
The authors acknowledge the financial support from the Dirección General de Investigación (DGI), (CTQ2010-17514/BQU). The authors are grateful to Dr Pilar Alonso Rojo, from the Department of Animal Biology, Ecology and Pedology of the University of Salamanca for her kind offer to analyze the physicochemical properties of the soil samples used in this work.
Related Research Data
References
- Breus, I.P.; Mishchenko, A.A. Eurasian Soil Sci. 2006, 39, 1271–1283. 10.1134/S1064229306120015
- Ojala, M.; Mattila, I.; Tarkiainen, V.; Sarme, T.; Ketola, R.A.; Maattanen, A.; Kostiainen, R.; Kotiaho, T. Anal. Chem. 2001, 73, 3624–3631. 10.1021/ac001504i
- Santos, F.J.; Sarrión, M.N.; Galceran, M.T. J. Chromatogr. A. 1997, 771, 181–189. 10.1016/S0021-9673(97)00132-5
- Campillo, N.; Viñas, P.; López-García, I.; Aguinaga, N.; Hernández-Córdoba, M. Talanta 2004, 64, 584–589. 10.1016/j.talanta.2004.03.028
- Zuloaga, O.; Etxebarria, N.; Fernández, L.A.; Madariaga, J.M. Anal. Chim. Acta. 2000, 416, 43–53. 10.1016/S0003-2670(00)00871-0
- Biziuk, M.; Przyjazny, A. J. Chromatogr. A. 1996, 733, 417–448. 10.1016/0021-9673(95)01268-0
- IARC. Monographs on the Evaluation of Carcinogenic Risks of Chemicals to Humans, Overall Evaluation of Carcinogenicity: An updating of IARC Monographs; International Agency for Research on Cancer, World Health Organization: Lyon, 1987; Vol. 1–42.
- IARC. Dry Cleaning, Some Chlorinated Solvents and Other Industrial Chemicals; International Agency for Research on Cancer, World Health Organization: Lyon, 1995; Vol. 63.
- Hou, L.; Lee, H.K. J. Chromatogr. A. 2004, 1038, 37–42.
- USEPA. Health Assessment Document for Chlorinated Benzenes; Washington, DC, 1985.
- WHO. Chlorobenzenes other than Hexachlorobenzene: Environmental Aspects, 1991; Vol. 60.
- USEPA. Soil Screening Guidance: User's Guide, Office of Emergency and Remedial Response; Washington, DC, 1996.
- USEPA. Method 8260B. Volatile Organic Compounds by Gas Chromatography-Mass Spectrometry. In Test Methods for Evaluating Solid Waste, Physical/Chemical Methods, SW-846; Washington, DC, 1996; pp 1–86.
- USEPA. Test Methods for Evaluating Solid Waste, Physical/Chemical Methods, EPA SW-846, 3rd ed.; Washington, DC, 1986.
- Llompart, M.; Li, K.; Fingas, M. Talanta 1999, 48, 451–459. 10.1016/S0039-9140(98)00263-X
- Rodil, R.; Popp, P. J. Chromatogr. A. 2006, 1124, 82–90. 10.1016/j.chroma.2006.05.028
- Chen, W.; Chiang, W.; Wei, K. J. Hazard. Mater. 2007, 147, 197–204. 10.1016/j.jhazmat.2006.12.066
- Grueiro-Noche, G.; Fernández-Laespada, M.E.; Pérez-Pavón, J.L.; Moreno-Cordero, B.; Muniategui-Lorenzo, S. J. Chromatogr. A. 2011, 1218, 6240–6247. 10.1016/j.chroma.2011.06.112
- Helaleh, M.I.H.; Takabayashi, Y.; Fujii, S.; Korenaga, T. Anal. Chim. Acta. 2001, 428, 227–234. 10.1016/S0003-2670(00)01251-4
- Anastassiades, M.; Lehotay, S.J.; Stajnbaher, D.; Schenck, F.J. J. A.O.A.C. Int. 2003, 86, 412–431.
- Wilkowska, A.; Biziuk, M. Food Chem. 2011, 125, 803–812. 10.1016/j.foodchem.2010.09.094
- Asensio-Ramos, M.; Hernández-Borges, J.; Ravelo-Pérez, L.M.; Rodríguez-Delgado, M.A. Anal. Bioanal. Chem. 2010, 396, 2307–2319. 10.1007/s00216-009-3440-2
- Drożdżyński, D.; Kowalska, J. Anal. Bioanal. Chem. 2009, 394, 2241–2247. 10.1007/s00216-009-2931-5
- Lesueur, C.; Gartner, M.; Mentler, A.; Fuerhacker, M.; Talanta 2008, 75, 284–293. 10.1016/j.talanta.2007.11.031
- Rashid, A.; Nawaz, S.; Barker, H.; Ahmad, I.; Ashraf, M. J. Chromatogr. A. 2010, 1217, 2933–2939. 10.1016/j.chroma.2010.02.060
- Li, X.; Jiang, Y.; Shan, W.; Pan, C. Bull. Environ. Contam. Toxicol. 2010, 84, 596–601. 10.1007/s00128-010-0001-5
- Padilla–Sánchez, J.A.; Plaza-Bolaños, P.; Romero-González, R.; Garrido-Frenich, A.; Martínez-Vidal, J.L. J. Chromatogr. A. 2010, 1217, 5724–5731. 10.1016/j.chroma.2010.07.004
- Salvia, M.V.; Cren-Olivé, C.; Vulliet, E. J. Chromatogr. A. 2013, 1315, 53–60. 10.1016/j.chroma.2013.09.056
- Bragança1, I.; Plácido, A.; Paíga, P.; Domingues, V.F.; Delerue-Matos, C. Sci. Total Environm. 2012, 433, 281–289. 10.1016/j.scitotenv.2012.06.035
- García-Pinto, C.; Fernández-Laespada, M.E.; Herrero-Martín, S.; Casas-Ferreira, A.M.; Pérez-Pavón, J.L.; Moreno-Cordero, B. Talanta 2010, 81, 385–391. 10.1016/j.talanta.2009.12.013
- García-Pinto, C.; Herrero-Martín, S.; Pérez-Pavón, J.L.; Moreno-Cordero, B.; Anal. Chim. Acta. 2011, 689, 129–136. 10.1016/j.aca.2011.01.023
- Herrero-Martín, S.; García-Pinto, C.; Pérez-Pavón, J.L.; Moreno-Cordero, B. J. Chromatogr. A. 2010, 1217, 4883–4889. 10.1016/j.chroma.2010.05.041
- Galuszka, A.; Migaszewski, Z.; Namiesnik, J. TrAC, Trends Anal. Chem. 2013, 50, 78–84. 10.1016/j.trac.2013.04.010
- USEPA. Soil Screening Guidance: User's Guide, 2nd ed.; Office of Solid Waste and Emergency Response, Washington, DC, 1996.
- Maštovska, K.; Lehotay, S.J. J. Chromatogr. A. 2004, 1040, 259–272. 10.1016/j.chroma.2004.04.017
- Serrano, A.; Gallego, M. J. Chromatogr. A. 2006, 1118, 261–270. 10.1016/j.chroma.2006.03.095
- Jakubowska, N.; Zygmunt, B.; Polkowska, Z.; Zabiegala, B.; Namiesnik, J. Chromatogr. A. 2009, 1216, 422–441. 10.1016/j.chroma.2008.08.092