
ABSTRACT
A study on the use of Allium sativum (garlic) as corrosion inhibitor for carbon steel in 0.5 M H2SO4 has been carried out in static and dynamic conditions by using potentiodynamic polarization curves and electrochemical impedance spectroscopy at 0, 200, 500, 1000 and 2000 rpm. Inhibitor concentrations included 0, 100, 200, 400, 600, 800 and 1000 ppm. Under static conditions, inhibitor efficiency increases with increasing its concentration up to 400 ppm, but it decreases with a further increase in its concentration. Under dynamic conditions and short testing times, inhibitor efficiency increases with increasing the rotating speed, due to a better inhibitor transfer towards the steel surface. However, for longer testing times, inhibitor efficiency increases only during the first 2 h, and then it decreases with a further increase in time, indicating a desorption of the inhibitor molecules from the steel surface.
KEYWORDS:
1. Introduction
Due to the currently imposed requeriments for eco-friendly corrosion inhibitors, there is a growing interest in the use of natural products such as leaves or seeds extracts. Some papers have reported the use of natural products for mild steel corrosion inhibition in different environments ( Citation1–32). This is due to the fact that synthetic inhibitors are expensive, highly toxic for human beings and other living species, among other factors. Among the so-called “green inhibitors” are organic compounds that act by adsorption on the metal surface such as ascorbic and succinic acids, tryptamine, and caffeine. Some other natural products which have been proved to be good corrosion inhibitors are Aloe ( Citation13), Coriandrum sativum ( Citation14), Green Bambusa Arundinacea leaves ( Citation15), Artemisia pallens ( Citation16) and Gum Arabic ( Citation17). Some other green inhibitors that have been evaluated include thioureas derivatives ( Citation18), pyridinecarboxaldehyde thiosemicarbazone compounds, Ruta chalepensis L. Oil ( Citation22) and Geissospermum laeve ( Citation23) as corrosion inhibitors for mild steel in hydrochloric acid solution ( Citation19), Green Bambusa Arundinacea leaves extract for steel-reinforced concrete ( Citation20), Phyllanthus fraternus leaves for mild steel in H2SO4 solution ( Citation21) and Hibiscus sabdariffa for aluminium in KOH ( Citation24), among others.
Onion and garlic maybe among the first cultivated crops in the world due to their long storage time and portability. At the present time, the Allium family has over 500 members, each differing in appearance, colour and taste, but close in biochemical, phytochemical and neutraceutical content ( Citation33). Alliums were revered to possess antibacterial and antifungal activities, and contain the powerful sulphur and other numerous phenolic compounds which arouse great interest ( Citation34). However, garlic contains nearly three times as much sulphur-containing compounds as onions. The mature, intact Alliums contain mainly cysteine sulphoxides, and when tissues are chopped, the enzyme allinase is released, converting the cysteine sulphoxides into the thiosulphinates ( Citation35). Evidence from several investigations suggests that the biological and medical functions of garlic are mainly due to their high organo-sulphur compounds content. The primary sulphur-containing constituents in garlic are the S-alk(en)yl-L-cysteine sulphoxides (ACSOs), such as allicin, and g-glutamylcysteines, Allicin (diallylthiosul¢nate) ( Citation36–38). However, the use of garlic as corrosion inhibitor is limited in the literature. Thus, Rajam et al. ( Citation39) used garlic for the corrosion inhibition of carbon steel in water well in the presence and absence of Zn2+ and found that 2 mL of garlic extract and 25 ppm of Zn2+ offered a 70% of inhibition efficiency. In another works ( Citation31, Citation40) the same authors added Malic acid to the Garlic extract+Zn2+ system, and increasing the inhibition efficiency, but found that it decreased as time elapsed or decreasing the pH value of the solution. Finally, Rodriguez-Clemente et al. ( Citation41) carried out a study on the use of Allium sativum as corrosion inhibitor for carbon steel in 0.5 M H2SO4 by using potentiodynamic polarization curves, electrochemical impedance spectroscopy and weight loss measurements. Inhibitor concentrations included 0, 100, 200, 400, 600 and 800 ppm at 25°C, 40°C and 60°C finding an inhibitor efficiency of 96% with the addition of 400 ppm. Thus, the goal of this work is to evaluate the use of A. sativum as corrosion inhibitor for carbon steel in 0.5 M H2SO4 but in hydrodynamic conditions to see the effect of mass transport because in power plants, where this acid is used for chemical cleaning, it is used under these conditions by pumping it.
2. Experimental procedure
Fresh garlic (A. sativum) bulbs were obtained from the local market and cut into small pieces. About 250 ml of hexane per 100 g of garlic was added, crushed and left for 30 days until all hexane was evaporated resulting in a solid form, which was weighted and dissolved in hexane and used as a stock solution. The aggressive solution, 0.5 M H2SO4, was prepared by dilution of analytical grade H2SO4 with double distilled water. Corrosion tests were performed on coupons prepared from 1018 carbon steel rods containg 0.14% C, 0.90% Mn, 0.30% S, 0.030% P and as balance Fe. Cylindrical specimens 10 mm long with a diameter of 6 mm were machined exposing an effective surface area of 0.28 cm2 to the electrolyte. This system was machined to form the rotating disk electrode, which was ground up to 2400 grade emery paper, rinsed with distilled water, acetone and dried under an air flow. Rotation speeds were 0, 250, 500, 1000 and 2000 rpm. Electrochemical techniques employed included potentiodynamic polarization curves and electrochemical impedance spectroscopy measurements, EIS. In all experiments, the carbon steel electrode was allowed to reach a stable open circuit potential value, Ecorr. Polarization curves were recorded at a constant sweep rate of 1 mV/s at the interval from −500 to +500 mV respect to the Ecorr value. Measurements were obtained by using a conventional three electrodes glass cell with two graphite counter electrodes symmetrically distributed and a saturated calomel electrode as reference. Corrosion current density values, icorr, were obtained by using Tafel extrapolation. Inhibitor efficiency, η, is calculated as follows :(1)
where and icorr are the corrosion current values with and without inhibitor, respectively. Electrochemical impedance spectroscopy tests were carried out at Ecorr by using a signal with amplitude of 10 mV in a frequency interval of 100 mHz–100 kHz. An ACM potentiostat controlled by a desktop computer was used for the polarization curves, whereas for the EIS measurements, a model PC4 300 Gamry potentiostat was used.
3. Results and discussion
3.1. Stagnant conditions
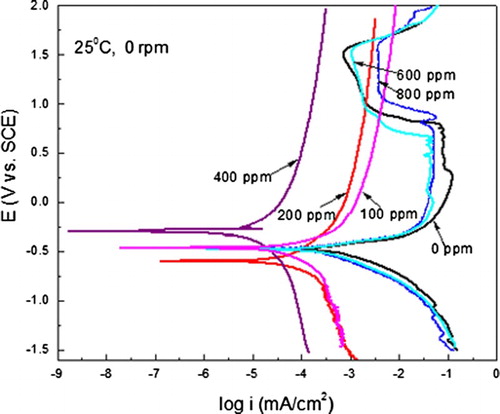
The effect of A. sativum concentration in the polarization curves for carbon steel under stagnant conditions is shown in . For the blank, uninhibited solution, the curve describes an active–passive behaviour, with an Ecorr value of −480 mV and a corrosion current density value around 0.5 mA/cm2. As the potential is made more anodic, the anodic current density increases due to the metal dissolution, but at a potential value close to 0 mV a limiting current density is reached more or less until a potential value of 900 mV, where the current density starts to decrease and a passive region is reached. The passive region under these conditions starts in a passive potential value, Epas, around 980 mV and finishes when the steel reaches a pitting potential value of 1515 mV. As soon as the inhibitor is added, 100, 200 and 400 ppm, the Ecorr value shifts towards nobler values, except with the addition of 200 ppm of A. sativum, and the corrosion current density values starts to decrease together with the anodic current density value. However, the passive region is not exhibited for these inhibitor concentrations; instead, an anodic limiting current is reached, with the lowest value obtained when 400 ppm of A. sativum is added. When higher inhibitor concentrations are added, i.e. 600 and 800 ppm, the active–passive behaviour is displayed once again, but the Epas value was lower for 600 ppm than that for the blank solution, with a value of 860 mV, whereas that for 800 ppm was higher, 1080 mV. The passive current density was higher with 600 and 800 ppm of A. sativum(1.6 and 4 mA/cm2 , respectively), than that for the uninhibited solution. This double effect of the inhibitor at low and high concentrations has been found for other inhibitors such as cysteine for carbon and 304-type stainless steel in sulphuric acid ( Citation42, Citation43), and copper in acidic chloride solutions ( Citation44). It has been attributed to the catalytical effect of oxygen and the inhibitor molecules, which can be oxidized which can be either protective or protective, and, thus, enhance or inhibit metal dissolution. This decrease in the corrosion rate with the addition of 400 ppm of A. sativum is due to the inhibitor adsorption on the steel surface.
Figure 1. Effect of A. sativum concentration in the polarization curves for carbon steel in 0.5 M H2SO4 under stagnant conditions.
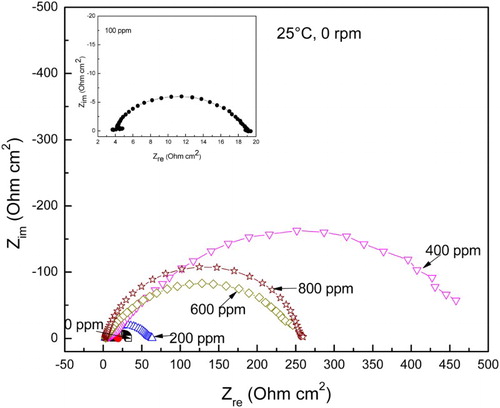
The effect of A. sativum concentration in the Nyquist curves for carbon steel in 0.5 M H2SO4 under stagnant conditions is shown in , where it can be seen that data describe a single, depressed, capacitive-like semi-circle at all frequency values, with its centre in the real axis, indicating that the corrosion process is under charge transfer control from the metal to the solution through the double electrochemical layer. When the inhibitor is added, data still display a single capacitive-like semi-circle, indicating that the corrosion mechanism is still the same with or without A. sativum addition. As the inhibitor concentration increases, the semi-circle diameter increases, reaching a maximum value when 400 ppm of A. sativum is added; the semi-circle diameter decreases with a further increase in the A. sativum concentration. The semi-circle diameter represents the charge transfer resistance, Rct, equivalent to the polarization resistance, Rp, and inversely proportional to the icorr value. Thus, the highest Rct value obtained with 400 ppm of A. sativum indicates that the icorr value is the lowest at this concentration, increasing with a further increase in the concentration, corroborating the results obtained with the polarization curves. The Rct values can be used to calculate the double-layer capacitance, Cdl, by using the following expression:(2)
Figure 2. Effect of A. sativum concentration in the Nyquist diagrams for carbon steel in 0.5 M H2SO4 under stagnant conditions.
3.2. Dynamic conditions
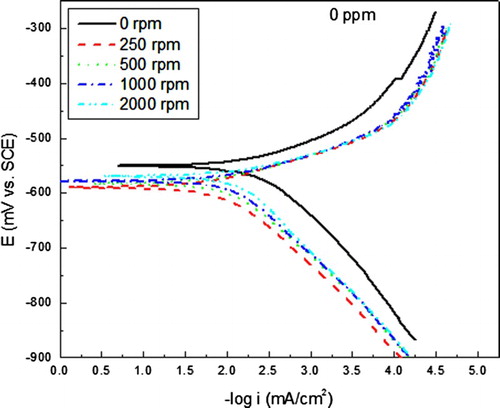
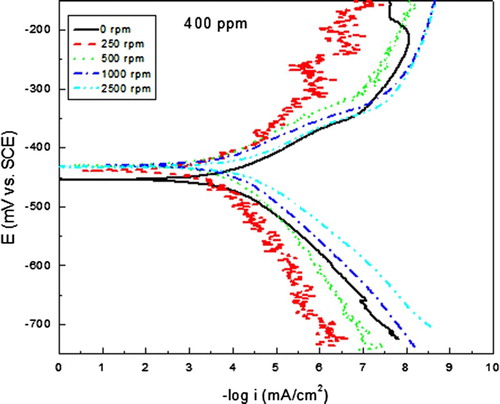
Since the most efficient inhibitor concentration was 400 ppm, and in order to see the effect of the mass transfer on the inhibitor performance, some corrosion tests were performed at various rotating speeds, and the effect of these on the polarization curves for carbon steel in uninhibited 0.5 M H2SO4 is shown in . It can be seen in this figure that as soon as the electrode starts to rotate, at 250 rpm, the Ecorr value shifts towards more active values, reaching a value of −590 mV, and the icorr value decrases from 0.5 down to 0.01 mA/cm2. This may be due to the fact that oxygen diffusion is enhanced towards the steel surface, producing a protecitve oxide layer on it. However, with a further increase in the rotating speed, the Ecorr values reamain more active than that in the stagnant condition, fluctuating around −575 and −580 mV, but the corrosion icorr increases although the icorr values under dynamic conditions were always lower than that under stagnant conditions. For the inhibited solution, , polarization curves under dynamic conditions showed a shift in the Ecorr values as the rotating speed increases, decreasing from a value of −300 mV under stagnant conditions down to −430 mV in the dynamic conditions. The corrosion current density decreases as soon as the rotating speed increased, reaching the lowest value at 250 rpm. This might be due to the fact that formed protective complex is desorbed as the rotating speed increases, leaving the steel surface exposed to the electrolyte, increasing thus the corrosion rate.
Figure 3. Effect of rotating speed in the polarization curves for carbon steel in uninhibited 0.5 M H2SO4 solution.
Figue. 4. Effect of rotating speed in the polarization curves for carbon steel in 0.5 M H2SO4 + 400 ppm of A. sativum.
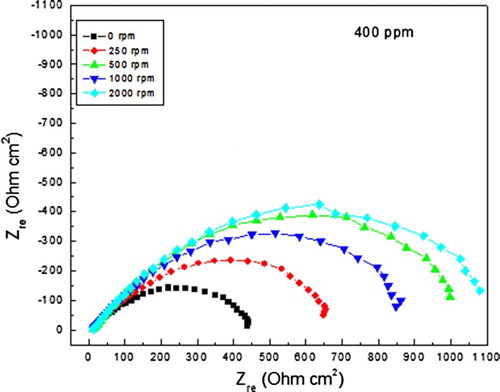
Nyquist curved for the steel in the uninhibited solution at different rotating speeds can be seen in , where it can be seen that data display a single, capacitive, depressed semi-circle, with its centre in the real axis, indicating that the corrosion process is under charge transfer control. As soon as the steel starts to rotate, data still display a single capacitive semi-circle, with its centre in the real axis, indicating that the corrosion mechanism does not change with the steel movement, and the semi-circle diameter increases, although this increase is marginal, due to the formation of a protective formed film, due to an enhancement on the oxygen difussion towards the steel surface, decreasing ,thus, the corroson rate. For the solution with 400 ppm of inhibitor, , Nyquist data display a single capacitive, depressed semi-circle at all the frequency values, with its centre in the real axis, indicating a charge transfer-controlled corrosion process. As the rotation speed increases, the semi-circle diameter increases considerably from a value of 400 Ω cm2 obtained under stagnant conditions, upto a value of 1100 Ω cm2 at a rotating speed of 2000 rpm, with a decrease in the corrosion rate.
Figure 5. Effect of rotating speed in the Nyquist diagrams for carbon steel in uninhibited 0.5 M H2SO4 solution.
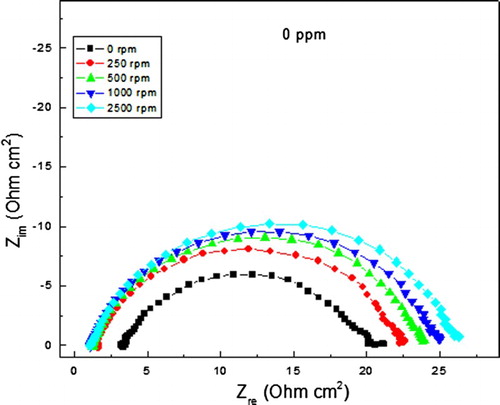
Figure 6. Effect of rotating speed in the Nyquist diagrams for carbon steel in 0.5 M H2SO4 + 400 ppm of A. sativum.
It is generally accepted that the first step during the adsorption of an organic inhibitor on a metal surface usually involves replacement of water molecules absorbed on the metal surface:(4)
The inhibitor may then combine with freshly generated Fe2+ ions on steel surface, forming metal-inhibitor complexes (
Citation42, Citation44–47):(5)
(6)
The resulting complex, depending on its relative solubility, can either inhibit or catalyse further metal dissolution or increase its corrosion rate. At low concentrations the amount of A. sativum is insufficient to form a compact complex with the metal ions, so that the resulting adsorbed intermediate will be readily soluble in the acidic environment. But at relatively higher concentrations more A. sativum molecules become available for complex formation, which subsequently diminishes the solubility of the surface layer, leading to improve the inhibition of metal corrosion, because under flow conditions there are several different effect on inhibition performance:
Flow can increase mass transport of inhibitor molecules that causes more inhibitor presence at the metal surface. This effect can improve the inhibitor performance (Citation48).
Hydrodynamic conditions can increase mass transport of metal ions (Fe2+) produced during metal dissolution from electrode surface to the bulk of solution and hence lead to less [Fe−Inh]2+ complex presence on electrode; this is a harmful effect for inhibition performance.
The high shear stress resulted from high flow velocity can also separate inhibitor layer of adsorbed [Fe−Inh]2+ complex and cause more desorption from the metal surface, which acts as a negative factor on inhibitor efficiency (Citation48). The balance of the above-mentioned effects leads to changes on inhibitor efficiency with the rotation rate.
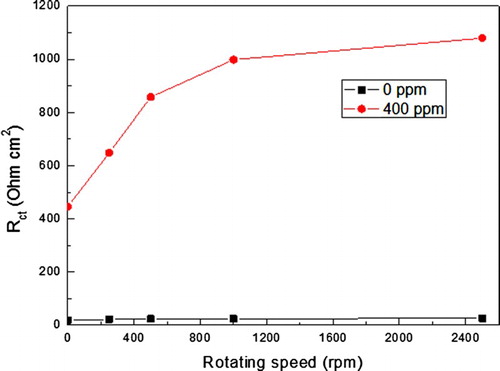
The effect of the rotation speed on the charge transfer resistance, Rct, the semi-circle diameter, for both inhibited and uninhibited solutions is shown in where it can be seen that for the uninhibited solution, it remains more or less constant around a value of 20–25 Ω cm2, but for the solution containing 400 ppm of A. sativum, the Rct value starts at 400 Ω cm2 at stagnant conditions, but it increases with increasing the rotating speed, reaching a maximum value of 1100 Ω cm2 at 2000 rpm. Thus, for short testing times, an increase in the rotating speed brings more inhibitor molecules towards the metal surface, reducing thus the corrosion rate.
Figure 7. Variation of the Rct value with time for uninhibited and inhibited solutions at different rotating speed values.
In order to evaluate the time of residence of the inhibitor on the steel surface at the different rotating speeds, EIS measurements were taken every 60 min and shows a typical plot of the variation of the Nyquist diagrams by using 400 ppm of A. sativum at a rotating speed of 250 ppm. It can be seen in this figure that data display a single, capacitive-like semi-circle at all frequency values regardless of the exposure time, indicating that the corrosion mechanism remains the same throughout the time. The semi-circle diameter, i.e. Rct, increases as the exposure time increases, reaching its maximum value after 2 h of testing, and after that, the semi-circle diameter starts to decrease, indicating that the inhibitor molecules start to be desorbed at this time. Thus, we can say that at 250 rpm, the time of residence of A. sativum on carbon steel is only 2 h.
Figure 8. Nyquist diagrams for carbon steel at different exposure times in 0.5 M H2SO4+ 400 ppm of A. sativum at 250 rpm.
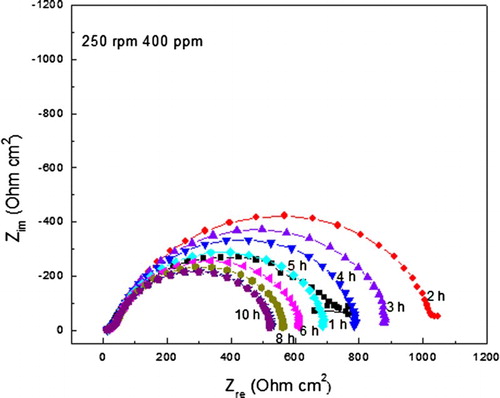
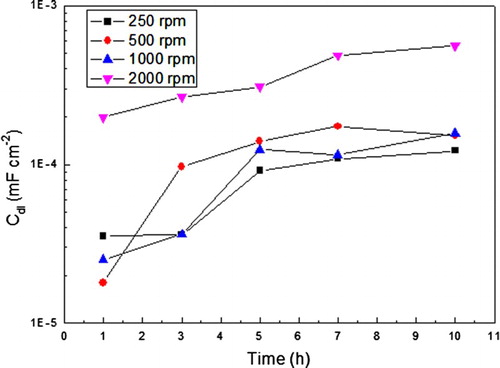
The variation in the charge transfer resistance value with time at the different rotation speeds is shown in , where it can be seen that at 250 rpm, the highest Rct value, and thus, the lowest corrosion rate, is reached after 2 h of exposure of the steel to the inhibited acidic solution, and after that time, the Rct value starts to decrease, increasing, thus, the corrosion rate due to a desorption of the inhibitor molecules from the steel surface. As the rotating speed increases, the Rct value decreases, reaching its lowest value at a rotating speed of 2000 rpm. However, the Rct value at higher rotating speeds increases with time, which indicates that under these conditions, flow can increase mass transport of inhibitor molecules that causes more inhibitor presence at metal surface, improving the inhibitor performance. On the other hand, from the effect of rotating speed on the double-layer capacitance value, Cdl, shown in , it can be seen that in general terms, this value increases with increasing the rotating speed or exposure time. By increasing the rotating speed, inhibitor molecules are desorbed, increasing, thus, the corrosion rate.
Figure 9. Variation of the Rct value with time for carbon steel in 0.5 M H2SO4+ 400 ppm of A. sativum and different rotating speed values.
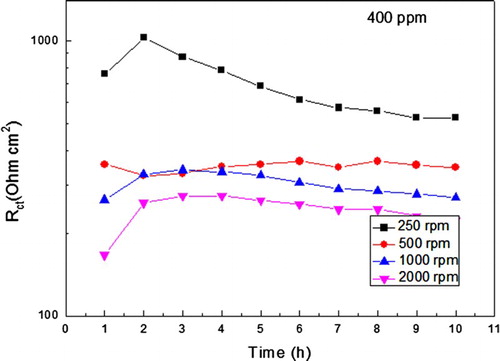
Figure 10. Variation of the Cdl value with time for carbon steel in 0.5 M H2SO4+ 400 ppm of A. sativum and different rotating speed values.
Evidence from several investigations suggests that the biological and medical functions of garlic are mainly due to their high organo-sulphur compounds content. The primary sulphur-containing constituents in garlic are the ACSOs, such as allicin, g-glutamylcysteines, and Allicin (diallylthiosul¢nate) ( Citation36–38). Additionally, in ( Citation48) it was shown that the high inhibitive performance of this extract suggests a strong bonding of the A. sativum derivatives on the metal surface due to the presence of lone pairs from heteroatom (oxygen) and p-orbitals, blocking the active sites and therefore decreasing the corrosion rate. Therefore, bonding between inhibitor molecules onto carbon steel surface occurs through sharing electrons of the OH group present in the allicin molecule of the pure extract and vacant d-orbitals of iron. By enhancing the mass transfer, either more inhibitor molecules can be transported towards the steel surface, improving the inhibitor protection, or the adsorbed inhibitor molecules can be desorbed due to a high shear stress resulted from high flow velocity.
4. Conclusions
A study of the use of A. sativum as corrosion inhibitor for 1018 carbon steel under stagnant and dynamic conditions has been carried out. Under static conditions, the inhibitor efficiency increases with increasing its concentration up to 400 ppm, but it decreases with a further increase in its concentration. Under dynamic conditions and short testing times, inhibitor efficiency increases with increasing the rotating speed, due to a better inhibitor transfer towards the steel surface. However, for longer testing times, inhibitor efficiency increases only during the first 2 h, and then it decreases as time increases, indicating a desorption of the inhibitor from the steel surface. The balance of the above- mentioned effects leads to changes on inhibitor efficiency with the rotation rate.
Disclosure statement
No potential conflict of interest was reported by the authors.
References
- Ashassi-Sorkhabi, H., Eshaghi, M. J. Solid State Electrochem. 2009, 13 (3), 1297–1303. doi: 10.1007/s10008-008-0673-5
- Behpour, M.; Ghoreishi, S.M.; Khayatkashani, M.; Soltani, N. Mater Chem Phys. 2012, 131 (4), 621–633. doi: 10.1016/j.matchemphys.2011.10.027
- Chauhan, L.R.; Gunasekaran, G. Corros. Sci. 2007, 49 (6), 1143–1161. doi: 10.1016/j.corsci.2006.08.012
- Okafor, P.C.; Ikpi, M.E.; Uwah, I.E.; Ebenso, E.E.; Ekpe, U.J.; Umoren, S.A. Corros. Sci. 2008, 50 (7), 2310–2317. doi: 10.1016/j.corsci.2008.05.009
- Khaled, K.F. J. Solid State Electrochem. 2007, 11 (7), 1743–1749.
- Rafiquee, M.Z.A.; Khan, S.; Saxena, N.; Quraishi, M.A. J. Appl. Electrochem. 2009, 39 (4), 1409–1417. doi: 10.1007/s10800-009-9811-8
- Ashassi-Sorkhabi, H.; Asghari, E. J. Appl. Electrochem. 2009, 39 (8), 631–637.
- Quraishi, M.A.; Singh, A.; Singh, V.K.; Yadav, D.K.; Singh, A.K. Mater. Chem. Phys. 2010, 122 (7), 114–122. doi: 10.1016/j.matchemphys.2010.02.066
- El-Etre, A.Y. Mater. Chem. Phys. 2008, 108 (9), 278–282. doi: 10.1016/j.matchemphys.2007.09.037
- Bouyanzer, A.; Hammouti, B.; Majidi, L. Mater. Lett. 2006, 60 (5), 2840–2843. doi: 10.1016/j.matlet.2006.01.103
- Avwiri, G.O.; Igho, F.O. Mater. Letters 2003, 57 (7) 3705–3711. doi: 10.1016/S0167-577X(03)00167-8
- Obot, I.B.; Obi-Egbedi, N.O. J. Appl. Electrochem. 2010, 40 (6), 977–1984.
- Mehdipour, M. Ramezanzadeh, B.; Arman, S.Y. J. Ind. Eng. Chem. 2014, 21 (1), 318–327.
- Prabhu, D.; Rao, P. J. Environ. Chem. Eng. 2013, 1 (7), 676–683. doi: 10.1016/j.jece.2013.07.004
- Asipita, S.A.; Ismail, M.; Majid, Z.A.; Abdullah, C.S.; Mirza, J. J. Cleaner Prod. 2014, 67 (7), 139–146. doi: 10.1016/j.jclepro.2013.12.033
- Garai, S.; Garai, S.; Jaisankar, P.; Singh, J.K.; Elango, A. Corros. Sci. 2012, 60 (1), 193–204. doi: 10.1016/j.corsci.2012.03.036
- Bentrah, H.; Rahali, Y.; Chala, A. Corros. Sci. 2014, 82 (3), 426–431. doi: 10.1016/j.corsci.2013.12.018
- Torres, V.V.; Rayol, V.A.; Magalhães, M.; Viana, G.M.; Aguiar, L.C.S.; Machado, S.P.; Orofino, H. E. D'Elia. Corros. Sci. 2014, 79 (2), 108–118. doi: 10.1016/j.corsci.2013.10.032
- Xu, B.; Yang, W.; Liu, Y.; Yin, X.; Gong, W.; Chen, Y. Corros. Sci. 2014, 78 (1), 260–268. doi: 10.1016/j.corsci.2013.10.007
- Salawu Abdulrahman, Asipita; Mohammad, Ismail; Muhd Zaimi Abd Majid; Zaiton Abdul Majid; CheSobry Abdullah; Jahangir Mirza. J. Cleaner Prod. 2014, 67 (3), 139–146.
- Patel, N.S.; Hrdlicka, J.; Beranek, P.; Přibyl, M.; Šnita, D.; Hammouti, B.; Al-Deyab, S.S.; Salghi, R. Int. J. Electrochem. Sci. 2014, 9 (7), 2805–2815.
- Khadraoui, A.; Khelifa, A.; Boutoumi, H.; Hamitouche, H.; Mehdaoui, R.; Hammouti, B.; Al-Deyab, S.S. Int. J. Electrochem. Sci. 2014, 9 (11), 3334–3348.
- Faustin, M.; Maciuk, A.; Salvin, P.; Roos, C.; Lebrini, M. Corros. Sci. 2015, 92 (2), 287–300. doi: 10.1016/j.corsci.2014.12.005
- Murthy, Z.V.P.; Vijayaragavan, K. Green Chem. Lett. Rev. 2014, 7 (2), 209–219. doi: 10.1080/17518253.2014.924592
- Regina, F-G.; Gregor, Z. Corros. Sci. in press, doi.org/10.1016/j.corsci.2015.03.016
- Sirbharathy, V.; Rajendran, S. Chem. Sci. Rev. Lett. 2012, 1 (1), 25–29.
- Felicita Florence, J.; Rajendran, S.; Srinivasan, K.V. Electroplating Finising. 2012, 31 (7), 1–4.
- Sangeetha, M.; Sathyabama, J.; Rajendran, S.; Prabhakar, P. Nat. Prod. Plant. Resour. 2012, 2 (5), 601–610.
- Sangeetha, M.; Rajendran, S.; Sathiya Bama, J.; Krishnaveni, A.; Santhy, P.; Manimaran, N.; Shyamaladevi, B. Port. Electrochim. Acta. 2011, 29 (6), 429–444. doi: 10.4152/pea.201106429
- Sirbharathy, V.; Rajendran, S.; Sathyabama, J. Int. J. Chem. Sci. Tech. 2011, 1 (3), 108–115.
- Sangeetha, M.; Rajendran, S.; Muthu Megala, T.S.; Krishnaveni K. Zastita Materijala, Vol. 52, 2011, pp 35–39.
- Antony, N.; Benita Sherina, H.; Rajendran, S. Int. J. Eng. Sci. Tech. 2010, 2 (7), 2774–2782.
- Darbyshire, B.; Henry, R.J. New Phytol. 1981, 87 (3), 249–256. doi: 10.1111/j.1469-8137.1981.tb03196.x
- Koch, H.P.; Lawson, L.D. Garlic, In Garlic: The Science and Therapeutic Application of Allium sativum L. and Related Species; Retford D.C. Ed.; Williams and Wilkins: Baltimore, 1996, pp. 1–233.
- Lawson, L.D. Lawson, L.D., Bauer, R., Eds.; Phytomedicines of Europe: Their Chemistry and Biological Activity; American Chemical Society: Washington, DC, 1998; pp. 176–209.
- Rivlin, R.S. Historical perspective on the use of garlic. J. Nutr. 2001, 131, 951S–954S.
- Lawson, L.D. In Phytomedicines of Europe: Their Chemistry and Biological Activity, Lawson, L.D., Bauer, R., Eds, Academic. 1996; Chapter 5, pp. 1–12.
- Block, E.; Naganathan, S.; Putman, D.; Zhao, S.H. J. Agriculture and Food Chemistry: London. 1992, 40 (2), 176–209.
- Rajam, K.; Rajendran, S.; Saranya, R. J. Chem. 2013, 2013 (2), 1–4.
- Rajam, K.; Rajendran, S.; Saranya, R. J. Chem. Biol. Phys. Sci. 2012, 2 (3), 1223–1233.
- Rodriguez-Clemente, E.; Gonzalez-Rodriguez, J.G.; Valladares-Cisneros, M. G. Int. J. Electrochem. Sci. 2014, 9 (7) 5924–5936.
- Obot, I.B.; Obi-Egbedi, N.O. J. Appl. Electrochem. 2010, 40 (7), 977–1984.
- Bontiss, F.; Lagrence, M.; Traisnel, M. Corrosion. 2000, 56 (7), 733–742. doi: 10.5006/1.3280577
- Jiang, X.; Zheng, Y.G.; Ke, W. Corros. Sci. 2005, 47 (11), 2636–2658. doi: 10.1016/j.corsci.2004.11.012
- Silva, A.B.; Agostinho, S.M.L.; Barcia, O.E.; Cordeiro, G.G.O.; D'Elia, E. Corros. Sci. 2006, 48 (12), 3668–3674. doi: 10.1016/j.corsci.2006.02.003
- Ismail, K. M. Electrochim. Acta. 2007, 52 (12), 7811–7819. doi: 10.1016/j.electacta.2007.02.053
- Oguzie, E.E.; Li, Y.; Wang, F.H. J. Colloid Interface Sci. 2007, 310, 90–98. doi: 10.1016/j.jcis.2007.01.038
- Branzoi, V.; Branzoi, F.; Baibarac, M.M. Mater. Chem. Phys. 2000, 65 (2), 288–297. doi: 10.1016/S0254-0584(00)00260-1