
ABSTRACT
A study on the use of the methanol extract of Medicago sativa as a green corrosion inhibitor for 1018 carbon steel in 0.5 M of sulfuric acid has been carried out by using potentiodynamic polarization curves, electrochemical impedance spectroscopy and gravimetric tests. Testing temperatures were 25°C, 40°C and 60°C. Results showed that M. sativa is a good corrosion inhibitor, with its efficiency increasing with its concentration and with time, but decreasing with the temperature. M. sativa forms a passive film on top of the steel with a passive current density and pitting potential values lower than that for uninhibited solution, and remained on the steel for 8–12 h. This film formed by iron ions and heteroatoms present in OH− and amine groups from the extract are adsorbed on the steel and form a protective film on to the steel.
GRAPHICAL ABSTRACT
1. Introduction
Acid solutions are used in industry in order to remove corrosion products from materials’ surface. Sulfuric and hydrochloric acids are widely used for this purpose. However, they cause corrosion to metals ( Citation1Citation(2) Citation(3)–Citation4). Organic inhibitors are one of the most widely used methods to prevent and control corrosion. The main action of these inhibitors is a specific interaction between some functional groups and metal surface, where heteroatoms, such as nitrogen, oxygen and sulfur, play a crucial role due to their free and alone electron pairs ( Citation5). On the other hand, organic inhibitors such as benzotriazole (BTA) and derivatives had demonstrated being excellent corrosion inhibitors. However, their present disadvantage is their toxicity. Seeland et al. ( Citation6) mentioned that the BTAs are persistent and poorly eliminated during wastewater treatment processes and pose a risk for aquatic ecosystems. Additionally, although BTA is considered to be of very low toxicity and a low health hazard to humans, US EPA 1977 reports that BTA derivatives are mutagenic in bacterial systems and inhibit plants growth ( Citation6), skin irritant in guinea pigs, severe eye irritant in rabbits and it causes some allergic dermatitis in a small number of workers ( Citation7). On other hand, some chemical inhibitors are currently used, but the cost of the synthetic inhibitors can be sometimes very high ( Citation8) between 200 and 6000 U.S. dollars depending upon their manufacturing place. Some plants had been studied as corrosion inhibitors such as Salvia officinalis ( Citation9), Musa paradisica ( Citation10), Capsicum annuum ( Citation11), Adhotada vasica ( Citation12), among others. For instance, Fouda ( Citation13) evaluated Ceratonia siliqua extract as a green inhibitor for copper and brass in nitric acid solution, finding that this extract is a good inhibitor, with its efficiency increasing with its concentration but decreases with the temperature, and it is adsorbed on to the metals by following a Langmuir type of isotherm. Similarly, Abdel Rahman ( Citation14) used Lawsonia inermis extract as a green inhibitor in the corrosion of mild steel in phosphoric acid, and found that its efficiency increases with concentration, between 40% and 65%, and remained unaffected by the temperature. In another work, Murthy ( Citation15) evaluated Hibiscus sabdariffa as a green corrosion inhibitor for mild steel in both hydrochloric and sulfuric acids. He found that the inhibitor efficiency was higher in sulfuric acid than in hydrochloric acid, and it increased with increasing its concentration but decreased with the acids’ concentration, and it was adsorbed on to the steel surface by following a Langmuir type of adsorption isotherm. Anupama et al. ( Citation16) used leaves of Pimenta dioica extract as a corrosion inhibitor for mild steel in nitric and sulfuric acids together with computational calculations for the component molecules and adsorption. They found that this extract has an excellent efficiency, higher than 90%, behaving as a mixed type of inhibitor and adsorbed on to the steel surface by following a Langmuir type of isotherm. Finally, El Bribri et al. ( Citation17) used Euphorbia falcata L. extract as an eco-friendly corrosion inhibitor for carbon steel in hydrochloric acid by using potentiodynamic polarization curves, electrochemical impedance spectroscopy (EIS) and weight loss tests. They found that this inhibitor behaved as a mixed type of inhibitor, with its efficiency, higher than 90%, increasing with its concentration, and it was adsorbed on to the steel surface by following a Langmuir type of adsorption isotherm. It was found that all these plant extracts act as good corrosion inhibitors for metal corrosion in acidic media. The corrosion inhibition of these compounds has been attributed to the presence of active compounds in their structure. These active compounds form protective films on metal surfaces by coordinating with metal ions through O, N or S heteroatoms of the functional groups present in the active principles ( Citation18).
Medicago sativa is commonly known in Mexico as ‘alfalfa’ (English common name is ‘Lucerne’) and it is a member of the Leguminosae family. M. sativa is one of the most ancient plants, grown widely in the world, and it has many purposes such as forage for bovine feeding, for recovering the ground and it is employed in medicinal uses ( Citation19, Citation20). Different compounds contained in Lucerne have been reported, most notably alkaloids such as trigonelline and stachydrine ( Citation21), flavonoids such as quercetin, myricetin, medicarpin, trigonelline, daphnortine, cousmetrol and sativan ( Citation22Citation(23)–Citation24). In addition to this, some phenolic compounds such as caffeic acid, p-coumaric acid and vanillic acid have also been reported ( Citation25Citation(26)–Citation27). M. sativa has been reported to contain good antioxidant activity in free radicals ( Citation28, Citation29). For these reasons, M. Sativa has been used for the treatment of reproductive diseases, such as infertility, menopause, premenstrual and menstrual discomforts ( Citation30). Even its aqueous and alcoholic extracts have been used as corrosion inhibitors for steel in 2.0 M H2SO4+10% ethanol at 30°C ( Citation31). That is why the main objective of the present work is to study the methanol extract of M. sativa to be used as corrosion inhibitor for 1018 steel in an acid medium.
2. Experimental procedure
2.1. Metal specimen
Corrosion tests measurements were carried out by using 1018 carbon steel coupons with the chemical composition of C 0.14%, Mn 0.90%, Pmax 0.05%, Smax 0.04% and Fe as balance, which were abraded with 600 grade emery paper, washed with water and degreased with acetone.
2.2. Preparation of plant extract
M. sativa (leaves) was acquired from a local market and left to dry for almost three weeks. The dry tissue was extracted by maceration with methanol for 72 h. The solvent was filtered and the excess was taken off using a BUCHI rotary until a methanol-free solid paste was obtained and it was stored to be used as a green corrosion inhibitor, because we are dealing with an extract coming from a natural source (plants) and it has low toxicity and it is environment friendly. This plant is used as forage for bovine feeding, as it has low toxicity.
2.3. Aggressive solution
An aggressive solution is prepared which consisted of 0.5 M of H2SO4 containing less than 1% of methanol. All chemicals used were 98% analytical grade reagents.
2.4. Electrochemical tests
Electrochemical measurements were performed by using a conventional three electrodes glass cell: graphite rod as the auxiliary electrode, the working electrode made of 1018 carbon steel with an exposed area of 1.0 cm2 and a saturated Ag/AgCl as the reference electrode. Electrochemical measurements were carried out by using different concentrations of M. sativa (0–500 ppm) as a green inhibitor at different testing temperatures, that is, 25°C, 40°C and 60°C by using a hot water bath. These temperatures are widely used in the literature (
Citation9, Citation17) for two reasons: natural products are rapidly degraded within this temperature interval, and in the industry, during chemical pickling, these temperatures are used. Before starting electrochemical tests, specimens were allowed to reach a steady-state open circuit potential value, Ecorr, around 15 min. Polarization curves were recorded using a Gill AC potentiostat of ACM instruments within an interval of −1000 to +2000 mVAg/AgCl, with respect to the Ecorr value, at a scan rate of 1 mV/s. The applied cathodic potential was chosen because we wanted to see the effect of M. sativa on the hydrogen evolution reaction to check whether this inhibitor blocks the adsorption of H+ ions. Alternatively, the anodic potential was chosen because we wanted to see the green inhibitor affecting the passive behavior of carbon steel in this environment, and some inhibitors affect the active behavior, that is, the Icorr value, whereas some others affect the passive behavior of the metal, that is, the passive current density value, that is, the Ipas value. In some preliminary tests we found out at a passive zone for this steel in the absence of inhibitor at such high anodic potentials. EIS measurements were carried out in a PC4 300 Gamry potentiostat in an interval between 10 KHz and 0.5 Hz obtaining 50 points per decade at the Ecorr value. Inhibition percent values in polarization curves were obtained according to the following equation:(1) where Icorr1 is the current density value with no inhibitor and Icorr2 is the current density value with inhibitor.
2.5. Weight loss tests
Cylindrical coupons measuring 2.5 cm high and 0.6 cm of diameter were cut; they were abraded with 600 grade emery paper, rinsed in distilled water, dried with warm air, degreased with acetone dried and finally kept in a desiccator before their use. Then they were immersed into the 0.5 M H2SO4 aggressive solution and used with different concentrations of green inhibitor of M. sativa (0–500 ppm) for 8 h. Testing temperatures included 25°C, 40°C and 60°C. All tests were done in triplicate. Corrosion rates, in terms of weight loss measurements, ΔW, were calculated as follows:(2) where m1 is the mass of the specimen before corrosion, m2 the mass of the specimen after corrosion, A is the specimen-exposed area and t is the exposure time. For the weight loss tests, inhibitor efficiency, IE, was calculated as follows:
(3) where ΔW1 is the weight loss without inhibitor and ΔW2 the weight loss with inhibitor.
Selected specimens were observed in a LEO 1450VP scanning electron microscope (SEM).
2.6. Fourier transform infrared spectroscopic analysis of green corrosion inhibitor
The green corrosion inhibitor was examined under the Fourier transform infrared (FTIR) spectroscopic analysis by using a Bruker equipment in KBr pellet in the 4500–570 cm−1 interval. The peak values of the FTIR were recorded. Each analysis was repeated twice to detect the characteristic peaks and their functional groups.
2.7. Gas chromatography–mass spectrometry analysis
The M. sativa green corrosion inhibitor was also analyzed on a GC Agilent 6890 System Plus coupled to Agilent 5973 Network Mass selective detector, to detect all majority organic natural compounds content in the methanol extract. The gas chromatography–mass spectrometry (GC–MS) equipped with silica capillary column (30 m × 0.25 mm, film thickness 0.25 mm). The GC conditions were temperature 45–250°C with a temperature gradient of 10°C/min and injected a volume 1.0 μL of green corrosion inhibitor at 0.02 g/L of concentration. The identification of the majority of components was based on the comparison of their indices mass fragmentation with those of authentic compounds on the commercial equipment high-quality mass spectra database N-15598 ( Citation26, Citation27).
3. Results
3.1. Weight loss tests
The effect of M. sativa concentration on the weight loss tests for carbon steel in 0.5 M H2SO4 at the different testing temperatures is given in , where it can be seen that, at constant temperature, the weight loss decreases as the inhibitor concentration increases, reaching its lowest value when 500 ppm of M. sativa is added. It can also be seen that the weight loss increases with the temperature. This decrease in the corrosion rate, expressed in terms of weight loss, has been attributed to the adsorption of the inhibitor on the steel surface and protecting the steel from the aggressive electrolyte. The inhibitor efficiency increased with increasing the M. sativa concentration and decreased with increasing the testing temperature (). At 25°C the highest inhibitor efficiency was 50% with the addition of 500 ppm, but it decreased to 30% and 20% at 40°C and 60°C, respectively. Murthy et al. ( Citation15) who used H. sabdariffa for mild steel, found inhibitor efficiency values of 90% and 70% in 1.2 N H2SO4 and 1.2 N HCl, respectively with 50 ppm only. Anupama ( Citation16), using P. dioica extract for mild steel in 0.5 M HCl, obtained efficiency values between 81% and 96% in a concentration of 1 and 4v/v %. Finally, El Bribri et al. ( Citation17) obtained efficiency values between 83% and 92% with 600 and 3000 ppm, respectively of E. falcata L. extract for the corrosion of carbon steel in 1 M HCl. The corrosion inhibition occurs due to the larger coverage of metal surface by the inhibitor which increases with increasing its concentration. In order to be sure that the corrosion inhibition is due to the inhibitor adsorption on to the steel surface, several adsorption isotherms were calculated (Temkin, Frumkin and Langmuir isotherm), but, as shown in , the best fitting was obtained with the Frumkin type of isotherm. Frumkin isotherm considers lateral interaction among the adsorbed molecules.
Figure 1. Effect of M. sativa concentration and temperature on the weight loss tests for 1018 carbon steel in 0.5 M H2SO4.
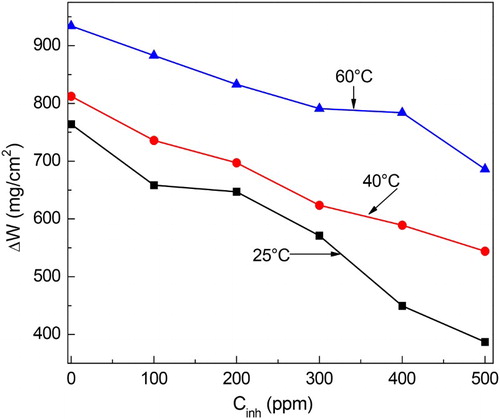
Figure 2. Effect of M. sativa concentration and temperature on the inhibitor efficiency value for 1018 carbon steel in 0.5 M H2SO4.
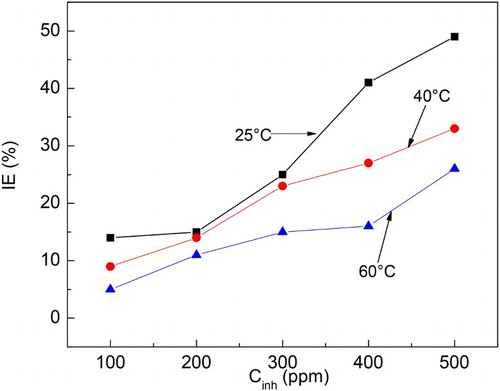
Figure 3. Frumkin type of adsorption isotherm for 1018 carbon steel in 0.5 M H2SO4 with additions of M. sativa.
The adsorption of M. sativa on carbon steel surface involves either physical adsorption associated with an electrostatic interaction between inhibitor charged molecules and charged metal surface (physical adsorption) to form a coordinate type of bond ( Citation30) or chemical adsorption. However, as established by Solmaz ( Citation32, Citation33) the adsorption of organic molecules on metal surfaces cannot be classified as pure physical or pure chemical. Thus, it should be concluded that the adsorption of M. sativa molecules on the carbon steel surface from H2SO4 solution takes place through both physical being dominant one, which is the first stage of adsorption, and chemical processes.
3.2. Polarization curves
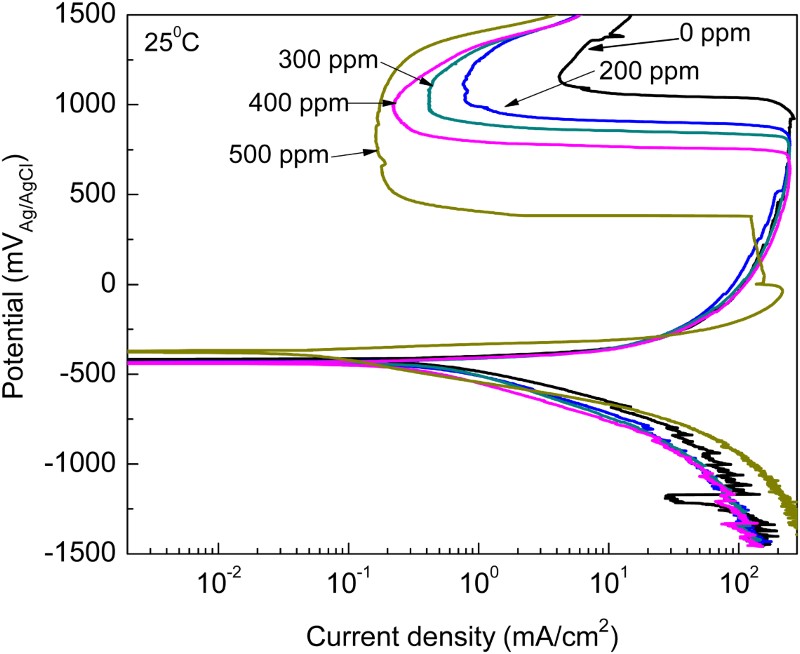
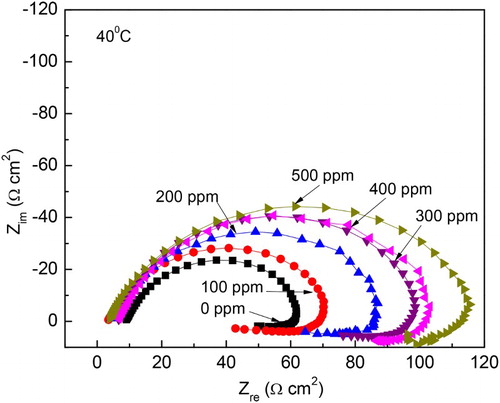
The effect of M. sativa concentration in the polarization curves for 1018 carbon steel in 0.5 M H2SO4 at 25°C is shown in . It can be seen that curves show in all cases an active–passive behavior, with an anodic current density increasing as the anodic applied potential increases, up to a potential, passivation potential or Epass, where the current density decreases suddenly reaching a more or less stable value, the passive current density, Ipass. This passive current density remains more or less constant up to a critical potential where it suddenly increases, called the pitting potential, Epit The Ecorr value practically was not affected by the addition of the inhibitor but the Icorr value decreased with increasing the inhibitor concentration. The highest Ecorr and lowest Icorr values were obtained with the addition of 500 ppm of M. sativa as can be seen in . Anodic Tafel slope decreased, whereas the cathodic one increased by the addition of the inhibitor, thus, M. sativa is considered a mixed type of inhibitor. Both the Epass and Ipass values decreased with the addition of M. sativa obtaining the lowest values where 500 ppm was added.
Table 1. Electrochemical parameters for polarization curves at 25°C.
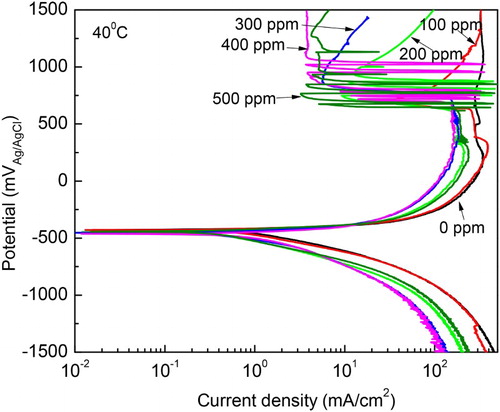
When the temperature was increased up to 40°C, , polarization curve for uninhibited solution did not display an active–passive behavior, instead an anodic limit current density with a value around 200 mA/cm2 was observed. As soon as the inhibitor is added, a passive zone is displayed by the steel, and the Ipass value decreases as the inhibitor concentration increases, however, the passive current exhibits some instabilities, indicating that the formed passive film is very unstable for inhibitor concentrations higher than 200 ppm. The Ecorr value remains practically constant with the addition of the inhibitor, whereas the Icorr value decreases reaching the lowest value with the addition of 500 ppm. It must be said that as compared to the Icorr values observed at 25°C, the increase in the temperature increases these values. Finally, at 60°C, , the steel does not show an active–passive behavior but only anodic dissolution, with the anodic current density increasing as the applied potential increases. The Ecorr value shifts toward the noble direction as the inhibitor concentration increases up to 400 ppm, but when 500 ppm is added, it become more active than that obtained for the uninhibited solution. The corrosion current density value decreased as the M. sativa concentration increases, reaching its lowest value at 400 ppm, but it increased once again with the addition of 500 ppm, reaching a value even higher than that for the uninhibited solution. These results suggest that the methanol extract of M. sativa is degraded with increasing the testing temperature.
Figure 4. Effect of M. sativa concentration on the polarization curves for 1018 carbon steel in 0.5 M H2SO4 at 25°C.
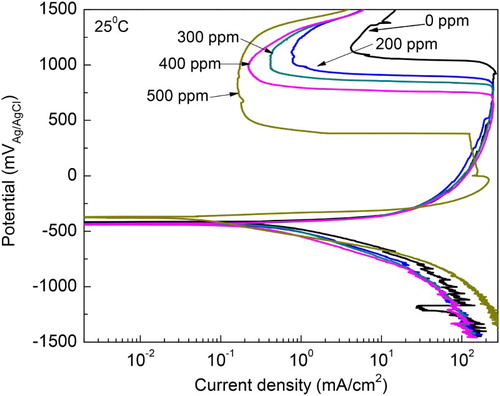
Figure 5. Effect of M. sativa concentration on the polarization curves for 1018 carbon steel in 0.5 M H2SO4 at 40°C.
3.3. Electrochemical impedance spectroscopy)
The effect of M. sativa concentration in the Nyquist and Bode diagrams for 1018 carbon steel in 0.5 M H2SO4 at 25°C is shown in . The Nyquist diagram shows depressed semicircles, capacitive-like at high and intermediate frequency values and an inductive semicircle at lower frequencies, which could be attributed to the relaxing process obtained due to species adsorption and desorption, such as FeSO4 ( Citation32, Citation33) or inhibitor species ( Citation34) on the electrode surface, in without and with all concentrations of M. sativa as a green inhibitor. At low frequency values, some elongations can be observed, which is due to the accumulation of all kind of species at the metal–solution interface ( Citation35Citation(36)–Citation37). The inhibition corrosion process could be explained with the modeling an equivalent circuit as shown in , in order to analyze the experimental data. It was possible to see the Rs is solution resistance non-compensated between the work and reference electrodes, Rct is the charge transfer resistance associated with the constant phase element, which is introduced in the circuit instead of a double pure layer condenser, to model the deviation of the ideal capacitor. RL is the resistance offered to ions migration in the solution that is shown in magnetic fields with their inductance series L that remain dominant between a certain frequency ranges. Thus, if we take into account the charge transfer resistance, film resistance and other accumulation of corrosion products at the metal–solution interface, as well as the solution resistance, it gives a total resistance or ‘polarization resistance’, Rp, which contains all these resistance values, and it is the diameter of the Nyquist diagrams in ( Citation36, Citation37).
Figure 6. Effect of M. sativa concentration on the polarization curves for 1018 carbon steel in 0.5 M H2SO4 at 60°C.
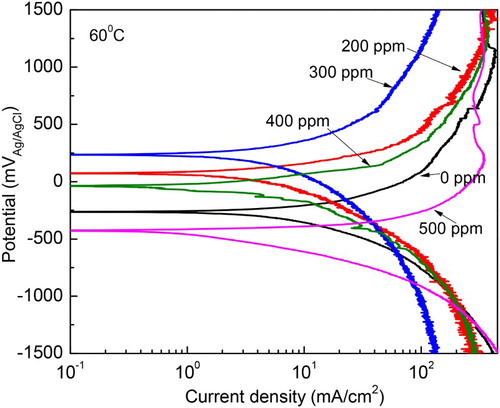
Figure 7. Effect of M. sativa concentration on the (a) Nyquist and (b) Bode plots for 1018 carbon steel in 0.5 M H2SO4 at 25°C.
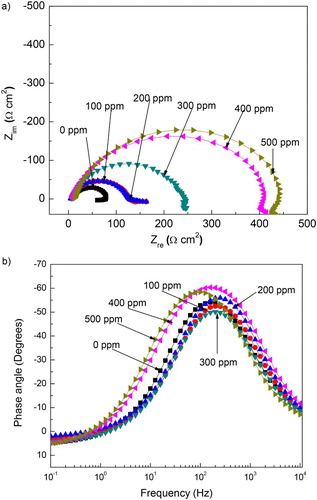
The corrosion protection given by the M. sativa adsorption since the diameter semicircle increases with its concentration, which indicates that the degree of metal covered (θ) by the inhibitor increases, as shown by , where an increase in θ with increasing M. sativa concentration can be seen. Bode diagrams show a single peak at 200 Hz and it remains more or less constant as the M. sativa concentration increases; however, the range of frequency where the phase angle remains constant increases with the inhibitor concentration, indicating the protective nature of M. sativa.
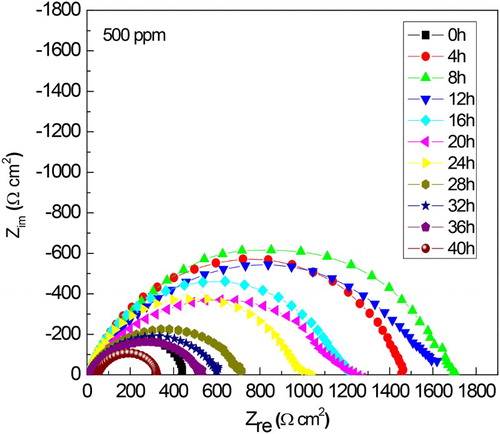
Since the corrosion protection is given by the film formed by M. sativa on to the steel surface, the time that this film remains on the surface was evaluated by carrying out some EIS measurements during 40 h. Nyquist diagrams at different immersion times are shown in , where it can be seen that, at all testing times data display a single depressed, capacitive-like semicircle, with their center at the real axis. The presence of a single semicircle regardless of the testing time indicates that the corrosion process is under charge transfer control and it is the same mechanism throughout the time. The semicircle diameter increases as time elapses, reaching its highest value after 8 and 12 h of testing, and it decreases with a further increase in the testing time. The semicircle diameter corresponds to the resistance of the double electrochemical layer or polarization resistance, Rp, which is inversely proportional to the corrosion rate. The values for Rp and Cdl, the capacitance of the double electrochemical layer, were calculated. Double layer capacitance values were obtained according to the following equation:(4) where fmax is the frequency value in where the maximum value of imaginary impedance is founded. Results are given in which shows an increase in the polarization resistance during the first 12 h, and then a decrease in its value is observed with a further increase in the testing time.
Figure 8. Equivalent circuit used to fit EIS obtained data for 1018 steel in 0.5 M H2SO4.
Figure 9. Variation of the Nyquist curves with time for 1018 carbon steel in 0.5 M H2SO4 at 25°C with the addition of 500 ppm of M. sativa.
On the other hand, the double layer capacitance has the opposite behavior; a decrease in its value during the first 12 h, and then it increases when the testing time elapses. An increase in Rct refers to more impediment of the active area at the metal surface as a result of the increase in inhibitor concentration (
Citation37, Citation38). In addition, the values of the double layer capacitance (Cdl) decrease by adding the inhibitor in to corrosive solution. Additionally, double-layer capacitance can be calculated with the following equation:(5) where ε is the double layer dielectric constant, ε0 the vacuum electrical permittivity, δ the double-layer thickness and A the surface area. Thus, the decrease in Cdl value is attributed to the replacement of the adsorbed water molecules at the surface metal by the inhibitor having lower dielectric constant (
Citation39). Also, the decrease in surface area which acts as a site for charging may be considered as another reason for the Cdl decrease (
Citation40). These points suggest that the role of inhibitor molecules is preceded by its adsorption at the metal–solution interface.
The change in the semicircle diameters expressed as polarization resistance or Rp values for both uninhibited and inhibited solution after 24 h of exposure to sulfuric acid are shown in . shows that for the uninhibited solution the Rp value decreases with time, indicating an increase in the corrosion rate due to the non-protective nature of the formed corrosion products on the metal surface. Unlike this, the Rp values for the solution containing 500 ppm of M. sativa increases with time, indicating a decrease in the corrosion rate due to the protective nature of the corrosion products formed by M. sativa. The change in the efficiency value with time after exposing the specimen in the corrosive solution containing 500 ppm of M. sativa is shown in . It can be clearly seen that the increase in the inhibitor efficiency with time, reaching values higher than 90% after 12 h of exposure and remained around the value until the end of the experiment. This fact indicates that for M. sativa to protect the steel, it must remain on the surface of the metal for at least 12 h, to give it enough time to form protective corrosion layers.
Figure 10. Variation of the Rp and Cdl values with time for 1018 carbon steel in 0.5 M H2SO4 at 25°C with the addition of 500 ppm of M. sativa.
Figure 11. Effect of M. sativa concentration on the Nyquist plots for 1018 carbon steel in 0.5 M H2SO4 at 40°C.
The concentration effect of M. sativa in Nyquist diagrams at 40°C and 60°C is shown in and , respectively, where it can be seen that, regardless of the inhibitor concentration or the testing temperature, data display a depressed, capacitive-like semicircle at high and intermediate frequency values, and an inductive semicircle at lower frequencies. The semicircle diameter at both testing temperatures increases with increasing inhibitor concentration, while decreasing, thus, the corrosion rate. The presence of the inductive loop indicates that the corrosion process is under the control of the adsorption/desorption of species such as FeSO4 (
Citation41), inhibitor species or a complex formed by the inhibitor and Fe2+ ions in electrode surface, and that this mechanism is the same at both temperatures at all the testing inhibitor concentrations. It is generally accepted that the first step during the adsorption of an organic inhibitor on a metal surface usually involves replacement of water molecules absorbed on the metal surface:(6)
Figure 12. Variation of the Rp values with time for 1018 carbon steel in 0.5 M H2SO4 at 25°C with the addition of 0 and 500 ppm of M. sativa.
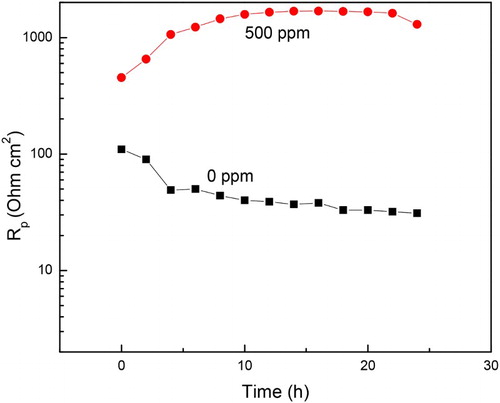
Figure 13. Variation of the inhibitor efficiency value with time for 1018 carbon steel in 0.5 M H2SO4 at 25°C with 500 ppm of M. sativa.
The inhibitor may then combine with freshly generated Fe2+
ions on the steel surface, forming metal–inhibitor complexes (
Citation42, Citation43):(7)
(8)
The resulting complex, depending on its relative solubility, can either inhibit or catalyze further metal dissolution or increase its corrosion rate. At low concentrations the amount of M. sativa is insufficient to form a compact complex with the metal ions, so that the resulting adsorbed intermediate will be readily soluble in the acidic environment. But at relatively higher concentrations more M. sativa molecules become available for complex formation, which subsequently diminishes the solubility of the surface layer, leading to improve the inhibition of metal corrosion.
3.4. SEM micrographs
SEM micrographs of corroded specimens with and without M. sativa are shown in . For specimens corroded in the uninhibited solution, (a, c and e), specimens show a very porous, cracked, non-protective film, and these defects increased with increasing the testing temperature. For the inhibited solution, (b, d and f), specimens showed a more compact film, without porous and a few micro cracks, mainly at 25°C; as the testing temperature increases, the deterioration of the film became more evident, showing more porous and micro cracks, indicating that the film became less protective at 40°C and 60°C. A chemical microanalysis done by energy disperssion of X-ray (EDX), , showed mainly Fe, C, O and S, elements contained in both the steel and in the corrosive solution.
Figure 14. Effect of M. sativa concentration on the Nyquist plots for 1018 carbon steel in 0.5 M H2SO4 at 60°C.
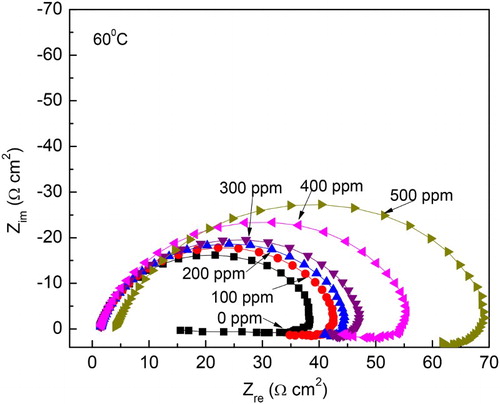
Figure 15. SEM micrographs of corroded 1018 steel specimens in uninhibited 0.5 M H2SO4 (a, c, e); and with addition of 500 ppm of M. sativa extract (b, d, f) at 25°C (a, b), 40°C (c, d) and 60°C (e, f).
3.5. Infrared spectroscopy inhibitor characterization
There are many compounds present in M. sativa extract; it is possible to distinguish characteristic signals from most of functional groups by infrared spectroscopy (). The functional groups present in the compounds of pure M. sativa (total extract) can be appreciated by vibrational bands which correspond to an OH− group characteristic (3389 cm−1 width and intense band), alkane-like bonds (2930 cm−1), double bonds (1623 cm−1), for each amine group (1386 cm−1), and primary alcohol (1067 cm−1). It is also present in aromatic-like bonds (850 cm−1). After the corrosion tests (tf), an OH group is observed (3425 cm−1); double bonds (1635 cm−1), amine group (1286 cm−1), primary alcohol (1066 cm−1) and aromatic-like bonds (1623 cm−1) are well distinguished.
Figure 16. EDX analysis of corroded 1018 steel specimens in 0.5 M H2SO4 containing (a) 0 and (b) 500 ppm of M. sativa extract at 25°C.
3.6. GS–MS analysis of green corrosion inhibitor
Since natural inhibitor is a mixture of different components, the components in the M. sativa, the relative percentage of each constituent and their retention time and fragmentation indices mass were given in and summarized in , similar to that analysis carried out in (
Citation49, Citation50). Eleven components were identified representing 96.76% of the total amount (). In the green corrosion inhibitor, its composition was dominated by sugar (3-O-methyl-D-glucose, 3) amounting 81.46% of the total composition. Most of the components were fatty acids: n-hexadecanoic acid (7.95% amount) and 9,12-octadecadienoic acid (oleanoic acid, 6.58% amount). The minority amount main compounds were two terpenes: cymene (0.46%) and limonene (0.28%); two methyl esters of fatty acids: pentadecanoic acid, 14-methyl-, methyl ester (0.31%) and 9,12,15-octadecatrienoic acid methyl ester (0.34%) and two fatty acids: linoleic acid (0.55%) and octadecanoico acid (0.91%); a cyclic diterpene alcohol: phytol (0.94%) and 9-octadecenamide (0.23%). Then the GC–MS analysis of M. sativa may suggest that oxygenated compounds, double bonds in terpenes and fatty acids, but particularly sugar (
Citation3) acted as the responsible for the corrosion inhibition of steel in the acid solution. However, Akalezi and Oguzie (
Citation44) found in Chrysophyllum albidum fatty acids (hexadecanoic acid) and fatty methyl esters and they are considered the responsible compounds for a good green corrosion inhibitor for mild steel in acid media. Since M. sativa contains many compounds, it is very difficult to establish which one of these compounds is the responsible for the corrosion inhibition. However, as we have seen the most important compound is 3-O-methyl-D-glucose and some functional groups such as OH−, double bonds, amine group, primary alcohol and aromatic-like bonds which contains π-electrons, characteristics of a corrosion inhibitor. The presence of organic compounds such as amine and hydroxyl groups, which contain heteroatoms, is responsible for the inhibitory ability of M. sativa. It has been shown (
Citation45) that the formation of a complex formed with Fe2+ ions and OH− groups present in the extract is partially responsible to give the corrosion protection to the metal. It has been reported (
Citation23Citation(24)–Citation25) that the most important compounds responsible for the antioxidant properties of M. sativa are trigonelline, daphnortine and coumestrol, which contain OH− groups and N+ ions within them. An inhibitor can be adsorbed on to a metal surface either chemically or physically. It was established above that the interaction mechanism between M. sativa and the metal involves physical interaction, that is, electrostatic interaction between inhibitor-charged molecules and charged metal surface. It has been reported that the surface of steel in H2SO4 solution is positively charged (
Citation46). As a result, the positively charged molecules adsorption on the positively charged metal surface would be difficult. In this state, the adsorption of inhibitors molecules on the surface occurs. The negatively charged molecules tend to be adsorbed on the metal surface. This leads to the surface neutralization and production of the additional negative charges on the metal surface. The M. sativa protonation by its nitrogen atom of its amine group has been reported (
Citation47) concluding that nitrogen atom is the most likely site for protonation. Additionally, in (
Citation48Citation(49)
Citation(50)–Citation51) it was shown that the high inhibitive performance of this extract suggests a strong bonding of the M. sativa derivatives on the metal surface due to the presence of lone pairs from heteroatoms (oxygen) and p-orbitals, blocking the active sites and therefore decreasing the corrosion rate. Therefore, bonding between inhibitor molecules onto carbon steel surface occurs through sharing electrons of the OH− group present in the M. sativa components of the extract and vacant d-orbitals of iron in the 1018 steel. Thus, there is no one single compound responsible for the corrosion inhibition, but there is a synergistic effect between protonated compounds of the inhibitor and adsorbed
molecules (
Citation52).
Figure 17. Infrared spectroscopy of M. sativa (pure extract or total extract), before (to) and after the corrosion test (tf).
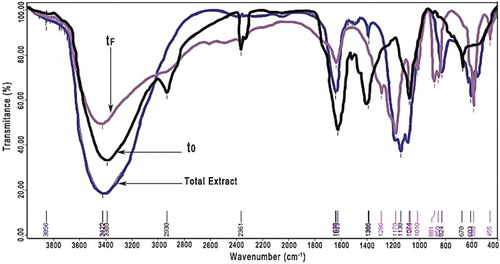
Figure 18. Chemical structure of the main compounds reported in M. sativa.
Table 2. Main components in the M. sativa as found by GC–MS analysis.
4. Conclusions
The possibility of using M. sativa as a green corrosion inhibitor for 1018 steel in 0.5 M H2SO4 has been explored. Results have shown that methanol extract of M. sativa is a good green corrosion inhibitor, with its efficiency increasing as the inhibitor concentration increased and with the exposure time, reaching its highest value with the addition of 500 ppm, but it decreases as the temperature increases. It was found that the inhibitor-formed film remains stable on the steel surface between 8 and 12 h. Polarization curves showed that the addition of M. sativa decreases the passive corrosion current density and the pitting potential values. M. sativa is adsorbed onto the metal surface and acts as a mixed type of inhibitor. SEM showed a layer formation of protective corrosion products which are formed by iron ions and functional groups present in the green corrosion inhibitor, mainly OH− and amines, which contain heteroatoms.
Acknowledgements
The authors would to like to thank National Council of Science and Technology (CONACyT) for the Ph.D. Scholarship from Adriana Rodríguez Torres. The authors would also like to thank the Instrumental and analytical Laboratory of the Faculty of Chemical Sciences and Engineering for the IR technical analysis and also to Microscopy Electron Laboratory for the micrographic analysis.
Disclosure statement
No potential conflict of interest was reported by the authors.
References
- Gülşen, A. Res. Chem. Intermediat. 2012, 38 (6), 1311–1321. doi: 10.1007/s11164-011-0451-3
- Bentiss, F.; Gassama, F.; Barbry, D.; Gengembre, L.; Vezin, H.; Lagrenée, M.; Traisnel, M. Appl. Surf. Sci. 2006, 252, 2684–2691. doi: 10.1016/j.apsusc.2005.03.231
- Khaled, K.F.; Hackerman, N. Electrochim. Acta 2003, 48 (10), 2715–2723. doi: 10.1016/S0013-4686(03)00318-9
- Quraishi, M.A.; Sardar, R. Mater. Chem. Phys. 2003, 78 (3), 425–431. doi: 10.1016/S0254-0584(02)00299-7
- Hosseini, M.; Mertens, S.F.L.; Ghorbani, M.; Arshadi, M.R. Mater. Chem. Phys. 2003, 78 (5), 800–808. doi: 10.1016/S0254-0584(02)00390-5
- Seeland, A.; Oetken, M.; Kiss, A.; Fries, E.; Oehlmann, J. Environ. Sci. Pollut. Res. 2012, 19 (5), 1781–1790. doi: 10.1007/s11356-011-0705-z
- Pillard, D.A.; Cornell, J.S.; Dufresne, D.L.; Hernandez, M.T. Wat. Res. 2001, 35 (2), 557–560. doi: 10.1016/S0043-1354(00)00268-2
- Bothi Raja, P.; Gopalaskrishnan Sethuraman, M. Material Letters 2008, 62, 113–116. doi: 10.1016/j.matlet.2007.04.079
- Rodríguez Torres, A.; Valladares Cisneros, M.G.; González Rodríguez, J.G. Int. J. Electrochem. Sci. 2015, 10 (6), 4053–4067.
- Ji, G.; Anjum, S.; Sundaram, S.; Prakash, R. Corros. Sci. 2015, 90 (1), 107–117. doi: 10.1016/j.corsci.2014.10.002
- Ji, G.; Shukla, S.K.; Dwivedi, P.; Sundaram, S.; Ebenso, E.E.; Prakash, R. Int. J. Electrochem. Sci. 2012, 7 (3), 12146–12158.
- Singh, M.R.J. Mater. Environ. Sci. 2013, 4 (1), 117–126.
- Fouda, A.S.; Shalabi, K.; Idress, A.A. Green Chem. Lett. Rev. 2015, 8 (3–4), 17–29. doi: 10.1080/17518253.2015.1073797
- Abdel Rahman, H.H.; Seleim, S.M.; Hafez, A.M.; Helmy, A.A. Green Chem. Lett. Rev. 2015, 8 (3–4), 88–94. doi: 10.1080/17518253.2015.1111430
- Murthy, Z.V.P.; Vijayaragavan, K. Green Chem. Lett. Rev. 2014, 7 (3), 209–219. doi: 10.1080/17518253.2014.924592
- Anupama, K.K.; Ramya, K.; Shainy, K.M.; Joseph, A. Mater. Chem. Phys. 2015, 167 (1), 28–41. doi: 10.1016/j.matchemphys.2015.09.013
- El Bribri, A.; Tabyaoui, M.; Tabyaoui, B.; El Attari, H.; Bentiss, F. Mater. Chem. Phys. 2013, 141 (2), 240–247. doi: 10.1016/j.matchemphys.2013.05.006
- Rajendran, S.; Sri, V.G.; Selvi, J.A.; Amalraj, A.J. Bull Electrochem. 2005, 21 (8), 367–377.
- Steppler, H.; Ramachandra Nair, P.K. Int. Council Res. Agrofor. 1987, 4 (1), 13–24.
- Gholami, A.; De Geyter, N.; Pollier, J.; Goormachtig, S.; Goossens, A. Nat. Prod. Rep. 2014, 31 (2), 356–380. doi: 10.1039/c3np70104b
- Thring, T.S.A.; Hili, P.; Naughton, D.P.M. BMC Complem. Altern. 2009, 9 (1), 27–28. doi: 10.1186/1472-6882-9-27
- Kowalska, I.; Stochmal, A.; Kapusta, I.; Janda, B.; Pizza, C.; Piacente, S.; Oleszek, W. J. Agr. Food Chem. 2007, 55 (9), 2645–2652. doi: 10.1021/jf063635b
- Stochmal, A.; Oleszek, W. J. Food Agric. Environ. 2007, 5 (2), 170–174.
- Dixon, R.A.; Steele, C.L. Trends Plant Sci. 1999, 4 (2), 394–400. doi: 10.1016/S1360-1385(99)01471-5
- Newby, V.K.; Sablon, R.; Synge, R.L.M.; Casteele, K.V.C.; Van Sumere, F. Phytochemistry. 1980, 19 (5), 651–657. doi: 10.1016/0031-9422(80)87032-4
- Horst, R.L.; Reinhardt, T.A.; Russel, J.R.; Napoli, J.L. Arch. Biochem. Biophys. 1984, 231 (1), 67–71. doi: 10.1016/0003-9861(84)90363-1
- Bora, K.S. Pharm. Biol. 2011, 49 (2), 211–220. doi: 10.3109/13880209.2010.504732
- Gomathi, R.; Priyadharshini, T.; Kirithika, T.; Usha, K. Int. J. Pharm. Res. Bio. Sci. 2013, 2 (1), 29–38.
- Rana, M.G.; Katbamna, R.V.; Padhya, A.A.; Dudhrejiya, A.D.; Jivani, N.P.; Sheth, N.R. Rom. J. Biol. Plant. Biol. 2010, 55 (1), 15–22.
- Adaay, M.H.; Al-Dujaily, S.S.; Khazzal, F.K. J. Mater. Environ. Sci. 2013, 4 (4), 424–433.
- Al-Turkustani, A.M.; Arab, S.T.; Al-Qarni, L.S.S. J. Saudi Chem. Soc. 2011, 15 (1), 73–82. doi: 10.1016/j.jscs.2010.10.008
- Li, X.; Deng, S.; Fu, H. Corros. Sci. 2012, 62 (1), 163–175. doi: 10.1016/j.corsci.2012.05.008
- Lagrenée, M.; Mernari, B.; Bouanis, M.; Traisnel, M.; Bentiss, F. Corros. Sci. 2002, 44 (3), 573–588. doi: 10.1016/S0010-938X(01)00075-0
- Solmaz, R. Corros. Sci. 2014, 79, 169–176. doi: 10.1016/j.corsci.2013.11.001
- Solmaz, R. Corros. Sci. 2014, 81, 75–84. doi: 10.1016/j.corsci.2013.12.006
- Özcan, M.; Dehri, İ.; Erbil, M. Appl. Surf. Sci. 2004, 236, 155–164. doi: 10.1016/j.apsusc.2004.04.017
- Solmaz R.; Kardas G.; Culha M.; Yazıcı B.; Erbil, M. Electrochim. Acta. 2008, 53, 5941–5952. doi: 10.1016/j.electacta.2008.03.055
- Singh, A.K.; Quraishi, M.A. Corros. Sci. 2010, 52 (1), 152–160. doi: 10.1016/j.corsci.2009.08.050
- Poorqasemi, E.; Abootalebi, O.; Peikari, M.; Haqdar, F. Corros. Sci. 2009, 51 (8), 1043–1054. doi: 10.1016/j.corsci.2009.03.001
- Poornima, T.; Nayak, J.; Shetty, A.N. J. App. Electrochem. 2011, 41 (2), 223–233. doi: 10.1007/s10800-010-0227-2
- Popova, A.; Sokolova, E.; Raicheva, S.; Christov, M. Corros. Sci. 2003, 45 (1), 33–58. doi: 10.1016/S0010-938X(02)00072-0
- Bontiss, F.; Lagrence, M.; Traisnel, M. Corrosion. 2000, 56 (7), 733–742. doi: 10.5006/1.3280577
- Okada, Y.; Tanaka, K.; Sato, E.; Okajima, H. Org. Biomol. Chem. 2006, 4 (10), 4113–4117. doi: 10.1039/b611506c
- Akalezi, C.O.; Oguzie, E.E. Int. J. Ind. Chem. 2015, 6, 1–12. doi:10.1007/s40090-015-0057-5.
- de Souza, F.S.; Spinelli, A. Corros. Sci. 2009, 51 (3), 642–649. doi: 10.1016/j.corsci.2008.12.013
- Soltani, N.; Tavakkoli, N.; Khayatkashani, M.; Jalali, M.R.; Mosavizade, A. Corros. Sci. 2012, 62 (1), 122–135. doi: 10.1016/j.corsci.2012.05.003
- Avila, A.; Guilhermo, J.; Romo de Vivar, A. Biochem. System. Ecol. 2002, 30 (9), 1003–1005. doi: 10.1016/S0305-1978(02)00032-7
- Solmaz, R.; Sahin, E.A.; Doner, A.; Kardas, G. Corros. Sci. 2011, 53 (11), 3231–3240. doi: 10.1016/j.corsci.2011.05.067
- Hilal, R.; Abdel Khalegh, A.A.; Elroby, S.A. K. Int. J. Quant. Chem. 2005, 103 (2), 332–343. doi: 10.1002/qua.20482
- Fu, J.J.; Li, S.N.; Wang, Y.; Liu, X.D.; Lu, L.D.J. Mater. Sci. 2011, 46, 3550–3559. doi: 10.1007/s10853-011-5267-4
- Fu, J.J.; Zang, H.S.; Wang, Y.; Li, S.N.; Chen, T.; Liu, X.D. Ind. Eng. Chem. Res. 2012, 51, 6377−6386. doi: 10.1021/ie202832e
- Andreani, S.; Znini, M.; Paolini, J.; Majidi, L.; Hammouti, B.; Costa, J.; Musell, A. J. Mater. Environ. Sci. 2016, 7 (1), 187–195.