
ABSTRACT
In this study, the fluorescent carbon dots (CDs) of good biocompatibility and low toxicity was prepared by a carbonation route, and a strong enhancement effect of CDs on the luminol-K3Fe(CN)6 chemiluminescence (CL) system was observed. 5 ± 1 nm CDs were used as catalysts to enhance the reaction sensitivity. In the presence of 2-methoxyestradiol (2-ME), the CL intensity of CDs-luminol-K3Fe(CN)6 was significantly inhibited. The relative CL intensity was linearly related to the 2-ME concentration in the range of 1.0 × 10⁻⁹ –1.0 × 10⁻⁷ g mL-1 with a lower detection limit of 4.1 × 10⁻¹⁰ g mL−1. As a preliminary application, the highly sensitive method was successfully applied to the determination of 2-ME in both pharmaceutical preparation and serum samples with satisfactory results. The possible mechanism of CL reaction catalyzed by CDs was investigated and the CDs played a role of catalyst in the reaction which could promote the generation of oxygen radicals.
It could be concluded that the enhancement effect on CL by CDs was attributed to the formation of oxygen radicals. The oxidation reaction of luminol was accelerated by oxygen radicals, which led to the enhanced CL emission.
GRAPHICAL ABSTRACT
1. Introduction
In recent years, more and more attentions have been paid to the nanomaterials-based chemiluminescence (CL) systems to improve sensitivity and stability ( Citation1). As semiconductor nanomaterials, quantum dots (QDs) have been widely investigated for their unique optical properties and their potential applications in CL. Currently, the study of quantum dots applied in CL mainly should be focused on metal quantum dots such as CdS QDs ( Citation2), CdTe QDs ( Citation3, Citation4) and CdSe/CdS QDs ( Citation5), but these quantum dots containing heavy metals and other toxic elements are harmful to the environment and have strong cytotoxicity which limited its application.
Recently, fluorescent carbon dots (CDs) have drawn tremendous attention for the excellent photoluminescence (PL) with chemical stable, photo-stable and non-toxic nature. Compared to traditional metal quantum dots, CDs have exhibited some advantages such as good biocompatibility, low toxicity and low environmental hazard ( Citation6, Citation7). They are discrete and almost spherical nanoparticles with sizes below 10 nm. They typically display high quantum yield fluorescence with interesting size- and excitation wavelength-dependent behavior. Due to their superior properties, CDs have been successfully applied in various fields such as bioimaging ( Citation8, Citation9), photocatalysis ( Citation10, Citation11) and fluorescence sensing ( Citation12, Citation13). However, the uses of CDs in CL analysis are relatively few. Syed et al. ( Citation14) have found that the CDs could enhance the CL of periodate-hydrogen peroxide system, the CDs acted as emitter in the system. Han et al. ( Citation15) reported the CL of CDs in the presence of KMnO4 which has been successfully applied to the determination of trace iodide in samples with good recovery and high reproducibility. The directly oxidized CL of CDs-K3Fe(CN)6 system and its reaction mechanism have been investigated by Amjadi et al. ( Citation16).
As a metabolite of 17-β estradiol, 2-methoxyoestradiol (2-ME) presents in the serum of women during the ovulatory which is a new anticancer drug ( Citation17) (). Although several CL methods have been reported for the determination of 2-ME in pharmaceutical formulations and biological fluids ( Citation18-20), the proposed method is simple, highly sensitive and requires no special reagent. CL-based analytical methods show several advantages such as high sensitivity, simple operation and short analysis time. The nanoparticles can participate in CL reactions as catalyst, reductant, luminophore or energy acceptor, but few of previous reports in the literature described the catalytic effect of CDs on the CL reactions.
Figure 1. Chemical structure of 2-ME.
In the present work, we synthesized the carbon dots (CDs) with good water solubility and strong fluorescence by carbonation route which is an ideal choice to replace metal quantum dots. It was found that CDs could enhance the CL intensity of luminol-K3Fe(CN)6 in alkaline medium, when 2-ME is added into the CDs-luminol-K3Fe(CN)6 system, the CL signal could be greatly inhibited. Based on this observation, a novel and simple flow injection-CL assay for the rapid and sensitive determination of 2-ME was developed. The proposed method has a lower detection limit of 4.1 × 10⁻¹⁰ g mL-1 for 2-ME. Jin ( Citation18) described for the determination of 2-ME based on the inhibitory effect of the CL reaction of luminol and potassium ferricyanide in alkaline solution. Detection limit for synthetic samples and limits for quantification of plasma samples were 8.4 × 10⁻¹⁰ g mL-1 for synthetic samples and 4.0 × 10⁻⁹ g mL-1 for mouse samples. Yao ( Citation19) reported the determination of 2-ME based on enhancement of the CL intensity from a potassium ferricyanide-calcein system with a detection limit of 5.4 × 10⁻⁹ mol/L. Zhang ( Citation20) proposed the determination of 2-ME by inhibiting the CL intensity of AgNPs-luminol-K3Fe(CN)6. This proposed method has a detection limit of 5.0 × 10⁻¹⁰ g mL−1. Compared with the above analytical methods, carbon dots-enhanced luminol chemiluminescence shows a higher sensitivity and selectivity, it has been successfully applied to the analysis of 2-ME in pharmaceutical preparations and biological fluids. Finally, the mechanism of the CL reaction was proposed based on CL spectra and UV spectra. CDs played a role of catalyst in the reaction which could promote the generation of oxygen radicals.
2. Experimental
2.1. Reagents
Ethylene glycol (C2H6O2, ≥99.7%) was obtained from Tianjin Fuyu Fine Chemicals Co., Ltd. (Tianjin, China). Concentrated sulfuric acid (H2SO4, 95.0%∼98.0%) was purchased from Beijing Kangpu Huiwei Science & Technology Co., Ltd. (Beijing, China). All reagents were of analytical reagent grade and all solutions were prepared in ultra pure water.
2-ME (Zhengzhou University, China) stock solution (5.0 × 10⁻⁴ g mL-1) was prepared by dissolving 50.05 mg 2-ME in 100 mL of methanol and working solutions were prepared by diluting with water as required. Luminol (Solarbio, China) stock solution (1.0 × 10⁻² mol L-1) was prepared by dissolving 0.1772 g luminol in 100 mL of 0.1 mol L-1 NaOH and stored in the refrigerator at 4°C. The working solution of luminol was prepared by gradually diluting stock solution with 0.1 mol L-1 NaOH solution. K3Fe(CN)6 (Kermel Chemical Reagent Co., Ltd, Tianjin, China) stock solution (5.0 × 10⁻³ mol L-1) was prepared by dissolving 82.3 mg K3Fe(CN)6 in 50 mL ultra pure water and stored in the dark. Fresh solutions were prepared daily.
2.2. Apparatus
CL measurements were carried out on a computerized ultra-weak luminescence analyzer (IFFM-E, Remax Analytical Instrument Limited Co. Ltd, Xi’an, China), the schematic diagram was shown in . Two peristaltic pumps were used to deliver flow streams in this system, the flow lines were inserted into the luminol, 2-ME, K3Fe(CN)6 and CDs solution, respectively. Injection was made by using a six-way injection valve and CL signal was monitored by the photomultiplier tube (PMT) voltage of 800 V. The acquisition and treatment of data were performed with BPCL software running under Windows XP. A UV–visible spectrophotometer (UV-2550, Shimadzu, Japan) with a 1.0 cm light path length-matched quartz cell was used for absorbance measurements. The CL spectra were recorded on an RF-5301 spectrofluorophotometer (Shimadzu, Japan).
Figure 2. Schematic diagram of the flow injection CL system used for the determination of 2-ME. a, luminol; b, 2-ME; c, K3 Fe(CN)6; d, CDs; P1 and P2, peristaltic pump; V, injection valve; F, flow cell; D, detector; PC, luminescence analyzer controlled by personal computer; W, waste.
2.3. Synthesis of CDs
As it was cited in the literature ( Citation21), CDs was synthesized by a carbonation route. Briefly, 14 mL of concentrated H2SO4 was added into 10 mL of EG at 140°C and then continuously stirred for 6 h. After cooled to room temperature, about 30 mL of ultra pure water was added into the obtained black gel and then stirred for about 30 min. Through centrifugation, the supernatant was discarded and then about 60 mL of ultra pure water was used to dissolve the precipitation. After stirring for 30 min, a yellowish-brown CDs aqueous solution was obtained by centrifuging the mixture with 12,000 rpm for about 15 min. The size and monodispersity of the obtained CDs were determined by high-resolution transmission electron microscopy (HRTEM) (Tecnai G2 F30, FEI, USA).
2.4. Procedure for flow injection-CL analysis
In order to obtain mechanical and thermal stability, the instruments were run for at least 10 min before the first measurement. Using the flow system schematically shown in , luminol solution was injected into the 2-ME solution by a six-way injection valve, merged at a T-piece with the mixture of K3Fe(CN)6 and CDs solution, then carried to the flow cell. The CL signals generated from the flow cell were detected and amplified by PMT and luminometer, which output was connected to data processing system for data acquisition. The quantitation of 2-ME was carried out by measuring the relative CL intensity Δi = Io −Is, where Is was the CL intensity of sample solution, and Io was the CL intensity of blank solution.
2.5. Procedure for biological fluids
The human serum samples were obtained from the Red Cross Blood Centre in Henan Province (China). The frozen plasma was melted in 37°C water bath and vortexed for 30 s. Three different known amounts of standard solutions of 2-ME were introduced into 100 μL serum and vortexed with 600 μL ethyl acetate for 3 min. After centrifugation at 12,000 rpm for 20 min at 4°C, the supernatants were collected and dried with a nitrogen stream. The residue was dissolved with 20 μL methanol and diluted with water appropriately within the linear range of determination. A blank solution was prepared by treating the drug-free serum in the same way.
3. Results and discussion
3.1. Characterization of CDs
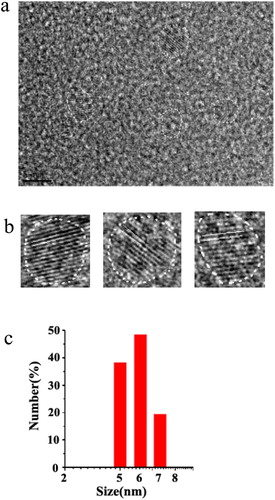
We used a simple carbonation route for synthesis of CDs and characterized its features. The high-resolution transmission electron microscopy (HRTEM) image, as seen in (a), showed that the formed CDs was near spherical and the size of CDs was in the range of 5 ± 1 nm. Moreover, the lattice spacing distances calculated for single CDs was about 0.7 nm ((b)).
Figure 3. (a) HRTEM image of CDs. (b) HRTEM images of single CDs. (c) Size distribution of CDs by DLS analysis.
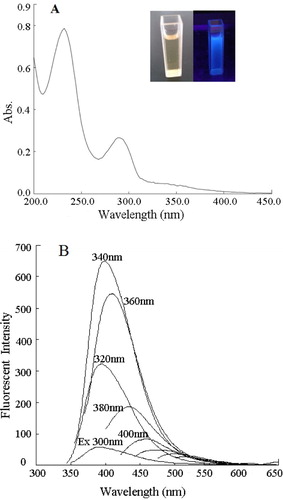
The UV-VIS absorption of synthesized CDs was characterized by UV-2550 spectrophotometer, and two sharp at 226 nm and 290 nm were shown in (A). Under illumination of UV lamp (λex = 365 nm), the CDs solution exhibited a bright blue fluorescence (the inset of (A)). To further investigate the wavelength dependence feature of CDs, the photoluminescence (PL) spectra of CDs solution was recorded by changing the excitation wavelengths. When the excitation wavelengths changed from 300 nm to 480 nm, the fluorescence spectra varied in the range from 395 to 510 nm as clearly shown in (B). Furthermore, the maximum fluorescent emission (λem = 400 nm) was obtained with an excitation wavelength of 340 nm and the emission wavelength red shifted with the increased excitation wavelength.
Figure 4. (A) UV-Vis absorption spectrum of CDs. The inset is the photograph of the CDs under visible light (left) and under 365 nm UV light (right). (B) Fluorescence spectra for CDs excited at wavelengths of 300–480 nm, with increments of 20 nm.
3.2. Kinetic characteristics of the present CL system
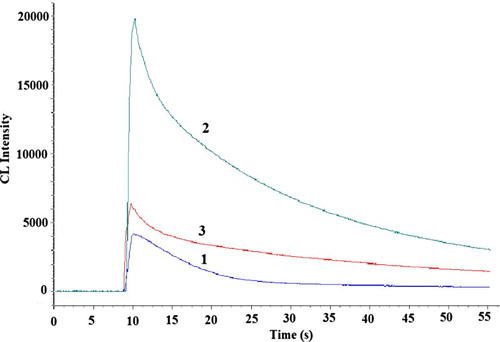
In the batch mode, with the experimental parameters kept constant, the typical CL intensity-time curve of the CL reaction was recorded to study the kinetic characteristics. As shown in , after the addition of CDs into the luminol-K3Fe(CN)6 system, a strong enhancement on CL signal was observed (curve 2), it was found that the present CL reaction was very fast, only 2.0 s was needed for the maximum peak to appear, and then gradually decline to the baseline. From curve 3 it can be seen that the CL intensity was decreased in the presence of 2-ME.
Figure 5. Kinetic CL intensity-time profile in the static system. 1, luminol-K3Fe(CN)6; 2, CDs-luminol-K3Fe(CN)6; 3, CDs-luminol-K3Fe(CN)6-2-ME. Conditions: luminol, 5.0×10⁻⁷ mol L-1 (0.05 mol L-1 NaOH); K3Fe(CN)6, 5.0×10⁻⁷ mol L-1; CDs, 2.0×10⁻⁴ (VCDs/VH2O); 2-ME, 2.5×10⁻⁸ gmL-1.
3.3. Optimization of experimental conditions
An alkaline medium was introduced to improve the sensitivity of the system because of the character of luminol. The results showed that the relative CL intensity reached its highest value when the concentration of NaOH was 0.2 mol L−1 ((a)). Therefore, a concentration of 0.2 mol L-1 NaOH was employed for the subsequent experiments.
Figure 6. Effect of NaOH, luminol, K3Fe(CN)6 and CDs concentration on the CL intensity for 5.0×10⁻⁷ g mL-1 2-ME. Conditions: (a) K3Fe(CN)6, 5.0×10⁻⁵ mol L-1; luminol, 2.0×10⁻⁶ mol L-1; CDs, 6.0×10⁻⁴ (VCDs/VH2O); (b) K3Fe(CN)6, 5.0×10⁻⁵ mol L-1; NaOH, 0.2 mol L-1; CDs, 6.0×10⁻⁴ (VCDs/VH2O); (c) luminol, 2.0×10⁻⁶ mol L-1; NaOH, 0.2 mol L-1; CDs, 6.0×10⁻⁴ (VCDs/VH2O); (d) luminol, 2.0×10⁻⁶ mol L-1; NaOH, 0.2 mol L-1; K3Fe(CN)6, 5.0×10⁻⁵ mol L-1.
As a CL reagent, the concentration of luminol played a key role in the CL intensity. The effect of luminol concentration in the range of 8.0 × 10⁻⁸ –3.0 × 10⁻⁶ mol L-1 was investigated. It was found that the relative CL intensity increased with increasing concentrations of luminol ((b)). However, considering saving reagents and reproducibility of system, 2.0 × 10⁻⁶ mol L-1 luminol was selected for the following experiments.
In this CL system, K3Fe(CN)6 was used as the oxidant. The effect of K3Fe(CN)6 concentration was examined over the range of 5.0 × 10⁻⁶ –3.0 × 10⁻⁴ mol L-1. The results showed that the relative CL intensity reached the maximum when the concentration of K3Fe(CN)6 was 5.0 × 10⁻⁵ mol L-1 ((c)). Therefore, 5.0 × 10⁻⁵ mol L-1 of K3Fe(CN)6 was used in the coming work.
The influence of CDs concentration on the relative CL intensity was investigated. As shown in (d), CDs with a dilution ratio of 6.0 × 10⁻⁴:1 (VCDs/VH2O) provided the maximum relative CL intensity and gave a good linear. Hence, this concentration was used for further work.
3.4. Possible mechanism
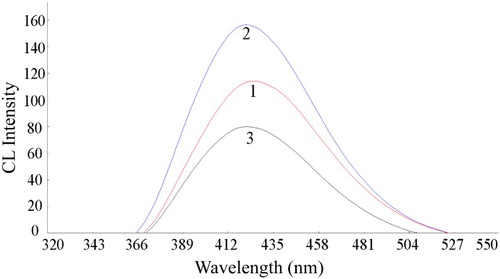
The CL-generation mechanism for luminol-K3Fe(CN)6 has been extensively studied: K3Fe(CN)6 can oxidize luminol in alkaline conditions, generating luminol radicals. The reaction between dissolved oxygen and luminol radicals took place and generated the excited intermediate product 3-aminophthalate* with an emission when it returned to its ground state. In order to identify the emitter of the proposed CL reaction, the CL spectra were obtained by using an RF-5301 spectrofluorometer with the light source taken off. As shown in , the maximum emission wavelength of luminol-K3Fe(CN)6, CDs-luminol-K3Fe(CN)6 and CDs-luminol-K3Fe(CN)6-2-ME systems were all located at 425 nm, which indicated that the luminophor in the CDs-luminol-K3Fe(CN)6 and CDs-luminol-K3Fe(CN)6-2-ME reaction was still the excited state of 3-aminophthalate which is the oxidation product of luminol ( Citation22, Citation23). It could be concluded that the addition of CDs and 2-ME did not lead to the generation of a new luminophor for this system.
Figure 7. CL spectra of the reaction. 1, luminol-K3Fe(CN)6; 2, CDs-luminol-K3Fe(CN)6; 3, CDs-luminol-K3Fe(CN)6-2-ME. Conditions: luminol, 5.0×10⁻⁵ mol L-1 (NaOH 0.2 mol L-1); K3Fe(CN)6, 5.0×10⁻⁵ mol L-1; CDs, 4.0×10⁻⁴ (VCDs/VH2O); 2-ME, 5.0×10⁻⁷ g mL-1.
In order to validate our speculation, the UV-VIS absorption spectra of 2-ME, CDs, luminol-K3Fe(CN)6, CDs-luminol-K3Fe(CN)6 and CDs-luminol-K3Fe(CN)6-2-ME were measured respectively, as depicted in . One absorption peak was observed at about 289 nm for 2-ME and CDs were at 230 nm and 290 nm. It can be seen that luminol-K3Fe(CN)6 had two distinct absorption peaks at 302 and 350 nm, when CDs was added into luminol-K3Fe(CN)6, the absorption spectrum of the mixture system was approximately the sum of these two individual spectra which meant that no obvious reaction occurred between CDs and luminol-K3Fe(CN)6. After addition 2-ME to CDs-luminol-K3Fe(CN)6, the absorption peak of 2-ME disappeared. Since the 2-ME with a phenolic hydroxyl group was easily oxidized, it may be oxidized by K3Fe(CN)6 in the system. Therefore, it was deduced that CDs only played a catalytic role in the luminol-K3Fe(CN)6 system.
Figure 8. UV-Vis absorption spectra. 1, 2-ME; 2, CDs; 3, luminol-K3Fe(CN)6; 4, CDs-luminol -K3Fe(CN)6; 5, CDs-luminol-K3Fe(CN)6-2-ME. Conditions: luminol, 8.0×10⁻⁵ mol L-1 (NaOH 0.1 mol L-1); K3Fe(CN)6, 1.0×10⁻⁴ mol L-1; CDs, 2.0×10⁻² (VCDs/VH2O); 2-ME, 3.0×10⁻⁵ g mL-1.
According to the experiments and literatures ( Citation24, Citation25), the CDs acted as the catalyst in the reaction could promote the generation of oxygen-related radicals, such as ·OH and ·O2-. During the luminol oxidation processes, the presence of oxygen-related radicals could accelerate the oxidation reaction, led to the enhanced CL emission. The effects of some scavengers of reactive oxygen species, including NaN3, DMSO and ascorbic acid were tested to investigate if these reactive oxygen species participated in the CL reaction. When the DMSO and ascorbic acid were added, the CL intensity was decreased significantly, therefore we concluded that there was the production of oxygen radicals during the reaction process and participated in the CL reaction. The possible CL mechanism for the enhancement of CDs was shown in .
Scheme 1. Possible mechanism of CL reaction catalyzed by CDs.
Therefore, in this system, it could be concluded that the enhancement effect on CL by CDs was attributed to the formation of oxygen radicals. The oxidation reaction of luminol was accelerated by oxygen radicals, which led to the enhanced CL emission. The phenolic hydroxyl group in the molecular structure of 2-ME reacted with K3Fe(CN)6 to reduce the production of the intermediate product 3-aminophthalate*. For the reason, the CL intensity could be greatly inhibited by 2-ME.
3.5. Analytical characteristics and interference
Under the optimized experimental conditions showed above, it was found the relative CL intensity (Δi) was linearly proportional to the 2-ME concentration (c, g mL-1) in a linear range from 1.0 × 10⁻⁹ to 1.0 × 10⁻⁷ g mL-1 with a regression equation Δi = 4293.9 × 108 c + 2581.8 (r = 0.9994). The limit of detection was 4.1 × 10⁻¹⁰ g mL-1, calculated according to the IUPAC regulation, three times standard deviation of the blank value (3σ). The relative standard deviation (RSD) was 2.8% for 11 replicate determinations of 1.0 × 10⁻⁸ g mL-1 2-ME.
To assess the applicability of the developed method, the influence of some common compounds usually presents in pharmaceutical preparations, some metal ions and coexisting species in human serum were studied by analyzing a standard solution of 5.0 × 10⁻⁸ g mL-1 2-ME. A tolerable concentration ratio of foreign species was considered acceptable if the variation of the CL intensity was within ±5% for the relative peak height obtained using 2-ME standard solution without foreign species. The tolerable ratio for foreign species was listed in . As a result, most of ions and some amino acids did not interfere with the determination of 2-ME in pharmaceutical preparations and human serum. It shows that the method has a higher selectivity.
Table 1. Effect of foreign substances on the determination of 5.0 × 10⁻⁸ g mL-1 2-ME.
3.6. Analytical application
3.6.1. Determination of 2-ME in lyophilized powders
In order to investigate the applicability and precision of the developed method, recovery tests were performed by adding known amounts of 2-ME standard solutions according to the proposed method. Three different batch numbers 2-ME lyophilized powders (made by Zhengzhou University) were dissolved in methyl alcohol. The resultant solution was further diluted with ultra pure water so that the concentration of final 2-ME sample solution was within the range of the calibration curve. As shown in , the recovery of 2-ME in lyophilized powders samples was in the range of 93.3–105.2%. The results showed that the proposed CL method provided acceptable accuracy and precision for the determination of 2-ME in pharmaceutical preparations.
Table 2. Recovery results for the determination of 2-ME in pharmaceutical preparations.
3.6.2. Determination of 2-ME in spiked serum samples
Following the procedure described previously, the proposed method was utilized for the determination of 2-ME in human serum samples. The standard addition method was applied to the recovery test to evaluate the accuracy feasibility of the method. The results of recovery in human serum were shown in . The recoveries for human serum samples were 88.0%–91.0%, which suggested that the developed method could be satisfactorily used for the determination of 2-ME in serum samples.
Table 3. Recovery for 2-ME in human serum samples.
4. Conclusions
In this paper, it was found that CDs have strong catalysis ability on luminol-K3Fe(CN)6 system in alkaline medium. After the addition of 2-ME into CDs-luminol-K3Fe(CN)6 system, the CL intensity could be greatly inhibited by 2-ME. Based on this phenomenon, a rapid and highly sensitive flow injection-CL method for 2-ME determination was developed. The preliminary investigations demonstrated that the CL enhancement was due to the catalytic effect of CDs on the oxygen radical generation.
Disclosure statement
No potential conflict of interest was reported by the authors.
Notes on contributors
Min Zhang, Postgraduate, a clinical pharmacist in The Third People's Hospital of Qingdao, mainly engaged in clinical pharmacy.
Yulei Jia, Postgraduate, a clinical pharmacist in Qingdao Municipal Hospital (Group), mainly engaged in the rational application of drugs.
Jianhua Cao, Postgraduate, a senior pharmacist in The Third People's Hospital of Qingdao, mainly engaged in pharmaceutical administration.
Guanghui Li, Undergraduate, a deputy pharmacist in The Third People's Hospital of Qingdao, mainly engaged in the rational application of drugs.
Huacheng Ren, Undergraduate, a responsible pharmacist in The Third People's Hospital of Qingdao, mainly engaged in intravenous medication management.
Hui Li, Postgraduate, a clinical pharmacist in The Third People's Hospital of Qingdao, mainly engaged in clinical pharmacy.
Hanchun Yao conducted her doctor studies in analytical chemistry at Northwest University. She is currently an associate Professor at School of Pharmaceutical Science, Zhengzhou University, Henan Province, China. Her current research interests include optical functional nano-materials, optical detection and imaging for tumor cells and tissues.
References
- Li, Q.; Zhang, L.; Li, J.; Lu, C., Nanomaterial-Amplified Chemiluminescence Systems and Their Applications in Bioassays. Trends Anal. Chem. 2011, 30, 401–413.
- Jie, G.F.; Liu, B.; Miao, J.J.; Zhu, J.J. , Electrogenerated Chemiluminescence from CdS Nanotubes and its Sensing Application in Aqueous Solution. Talanta 2007, 71, 1476–1480.
- Chen, H.; Lin, L.; Lin, Z.; Guo, G.; Lin, J.M., Chemiluminescence Arising from the Decomposition of Peroxymonocarbonate and Enhanced by CdTe Quantum Dots. J. Phys. Chem. A. 2010, 114, 10049–10058.
- Kang, J.; Li, X.; Geng, J.; Han, L.; Tang, J.; Jin, Y.; Zhang, Y., Determination of Hyperin in Seed of Cuscuta Chinensis Lam. by Enhanced Chemiluminescence of CdTe Quantum Dots on Calcein/K3Fe(CN)6 System. Food Chem. 2012, 134, 2383–2388.
- Chen, H.; Li, R.; Lin, L.; Guo, G.; Lin, J.M. , Determination of L-Ascorbic Acid in Human Serum by Chemiluminescence Based on Hydrogen Peroxide-Sodium Hydrogen Carbonate-CdSe/CdS Quantum Dots System. Talanta. 2010, 81, 1688–1696.
- Lim, S.Y.; Shen, W.; Gao, Z., Carbon Quantum Dots and Their Applications. Chem. Soc. Rev. 2015, 44, 362–381.
- Shi, J.; Lu, C.; Yan, D.; Ma, L., High Selectivity Sensing of Cobalt in HepG2 Cells Based on Necklace Model Microenvironment-Modulated Carbon Dot-Improved Chemiluminescence in Fenton-Like System. Biosens. Bioelectron. 2013, 45, 58–64.
- Zhu, S.; Meng, Q.; Wang, L.; Zhang, J.; Song, Y.; Jin, H.; Zhang, K.; Sun, H.; Wang, H.; Yang, B., Highly Photoluminescent Carbon Dots for Multicolor Patterning, Sensors, and Bioimaging. Angew. Chem. 2013, 52, 3953–3957.
- Liu, C.; Zhang, P.; Zhai, X.; Tian, F.; Li, W.; Yang, J.; Liu, Y.; Wang, H.; Wang, W.; Liu, W., Nano-carrier for Gene Delivery and Bioimaging Based on Carbon Dots with PEI-Passivation Enhanced Fluorescence. Biomaterials. 2012, 33, 3604–3613.
- Hallaj, T.; Amjadi, M.; Manzoori, J.L.; Azizi, N., A Novel Chemiluminescence Sensor for the Determination of Indomethacin Based on Sulfur and Nitrogen co-Doped Carbon Quantum Dot-KMnO 4 Reaction . Luminescence. 2017, 32, 1174–1179.
- Qin, X.; Lu, W.; Asiri, A.M.; Al-Youbi, A.O.; Sun, X. , Green, Low-Cost Synthesis of Photoluminescent Carbon Dots by Hydrothermal Treatment of Willow Bark and Their Application as an Effective Photocatalyst for Fabricating Au Nanoparticles–Reduced Graphene Oxide Nanocomposites for Glucose Detection. Catal. Sci. Technol. 2013, 3, 1027.
- Yu, C.; Li, X.; Zeng, F.; Zheng, F.; Wu, S., Carbon-dot-based Ratiometric Fluorescent Sensor for Detecting Hydrogen Sulfide in Aqueous Media and Inside Live Cells. Chem. Commun. 2013, 49, 403–405.
- Qu, K.; Wang, J.; Ren, J.; Qu, X., Carbon Dots Prepared by Hydrothermal Treatment of Dopamine as an Effective Fluorescent Sensing Platform for the Label-Free Detection of Iron(III) Ions and Dopamine. Chem. Eur. J. 2013, 19, 7243–7249.
- Shah, S.N.; Li, H.; Lin, J.M. , Enhancement of Periodate-Hydrogen Peroxide Chemiluminescence by Nitrogen Doped Carbon Dots and its Application for the Determination of Pyrogallol and Gallic Acid. Talanta. 2016, 153, 23–30.
- Han, S.; Liu, B.; Fan, Z.; Zhang, L.; Jiang, F., Chemiluminescence Detection of Trace Iodide with Flow Injection Analysis of KMnO 4-Carbon Dots System. Luminescence. 2017, 32, 1192–1196.
- Amjadi, M.; Manzoori, J.L.; Hallaj, T.; Sorouraddin, M.H., Direct Chemiluminescence of Carbon Dots Induced by Potassium Ferricyanide and its Analytical Application. Spectrochim. Acta, Part A. 2014, 122, 715–720.
- Hou, J.; Xiong, H.; Gao, W.; Jiang, H. , 2-Methoxyestradiol at Low Dose Induces Differentiation of Myeloma Cells. Leuk. Res. 2005, 29, 1059–1067.
- Jin, J.; Yao, H.; Chen, Z.; Pang, L.; Du, B., Flow Injection Chemiluminescence Determination of 2-Methoxyestradiol Based on Inhibition of Luminol-Potassium Ferricyanide Reaction. Luminescence. 2013, 28, 270–274.
- Yao, H.; Zhang, M.; Zeng, W.; Zeng, X.; Zhang, Z., Sensitive Determination of 2-Methoxyestradiol in Pharmaceutical Preparations and Serum Samples Using Flow Injection Chemiluminescence. Luminescence. 2014, 29, 261–265.
- Zhang, M.; Xiao, X.; Zeng, W.; Zeng, X.; Yao, H., Determination of 2-Methoxyestradiol in Serum Samples and Pharmaceutical Preparations by Silver Nanoparticles-Enhanced Chemiluminescence. Talanta. 2014, 120, 331–335.
- Liu, Y.; Liu, C.-y.; Zhang, Z.-y., Synthesis of Highly Luminescent Graphitized Carbon Dots and the Application in the Hg2+ Detection. Appl. Surf. Sci. 2012, 263, 481–485.
- Chen, J.; Shu, J.; Jiao, C.; Cao, Z.; An, X., Yan, Zhengyu, Highly Luminescent S,N co-Doped Carbon Quantum Dots-Sensitized Chemiluminescence on Luminol–H2O2 System for the Determination of Ranitidine. Luminescence. 2017, 32, 277–284.
- Dutta, C.S.; Chethodil, J.M.; Gharat, P.M.; Praseetha, P.K.; Pal, H., pH-Elicited Luminescence Functionalities of Carbon Dots: Mechanistic Insights. J. Phy. Chem. Lett. 2017, 8, 1389.
- Guo, C.; Zeng, H.; Ding, X.; He, D.; Li, J.; Yang, R.; Qu, L. , Enhanced Chemiluminescence of the Luminol-K3Fe(CN)6 System by ZnSe Quantum Dots and its Application. J. Lumin. 2013, 134, 888–892.
- Chen, H.; Lin, L.; Li, H.; Lin, J.-M. , Quantum Dots-Enhanced Chemiluminescence: Mechanism and Application. Coord. Chem. Rev. 2014, 263–264, 86–100.