
 ?Mathematical formulae have been encoded as MathML and are displayed in this HTML version using MathJax in order to improve their display. Uncheck the box to turn MathJax off. This feature requires Javascript. Click on a formula to zoom.
ABSTRACT
N-ion doped zinc oxide was synthesized by the mechanochemically induced solvent-deficient method using zinc nitrate hexahydrate and ammonium bicarbonate as the precursors. The synthesis was carried out using different calcination temperatures to investigate the dependence of how calcination temperature affects the crystal structure, bandgap, and photocatalytic activity of the zinc oxide doped with nitrogen. The morphological, structural, and optical properties of ZnO were investigated by thermal analysis (TG/DSC), X-ray diffraction (XRD), Fourier-transform infrared spectroscopy (FTIR), diffuse reflectance spectroscopy (DRS), scanning electronic microscopy (SEM), X-ray Photoelectron Spectroscopy (XPS), and N2 adsorption-desorption (BET). Photocatalytic properties of synthesized materials were determined by methylene blue (MB) degradation in an aqua medium exposed to sunlight. N-ion doped zinc oxide samples calcined at 400, 500, and 600°C are found to be highly efficient photocatalysts, with the MB almost completely degraded after 180 min. Per contra, N-ion doped zinc oxide sample calcined at 300°C is found to be less efficient, most likely caused by different defect chemistry.
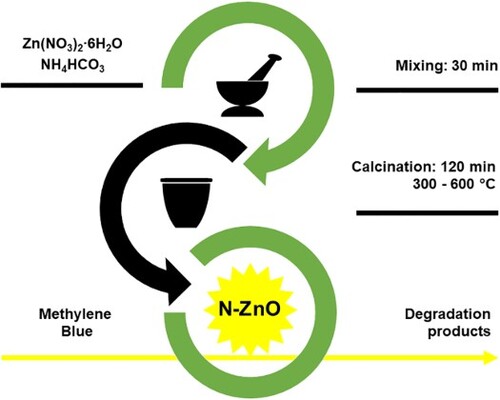
GRAPHICAL ABSTRACT
1. Introduction
Providing sufficient amounts of clean water has become one of the most important challenges in modern industrial society. Dyes are a class of organic compounds that are intensively used in various industries. The wastewaters by industries that use dyes are polluted by remnant dye leading to an environmental burden, especially since many of them are non-biodegradable and toxic (Citation1). Methylene blue (MB) is a thiazine dye, currently used for textile staining, and is carcinogenic and extraordinarily toxic (Citation2,Citation3). Among many approaches to MB degradation, semiconductor photocatalysis is a favorable technique due to applied materials’ non-toxicity, optical characteristics, and possibility for modification and adjustment (Citation4).
Zinc oxide (ZnO) has been extensively studied and used as a photocatalyst, due to its low cost, excellent photocatalytic activity, and environmental friendliness (Citation5–9). However, ZnO wide-bandgap inhibits functional photocatalytic application under solar light (Citation10). One of the most promising ways to overcome this bandgap limit is the N-ion doping of ZnO crystal lattice. The advantage of N-ion doped ZnO is based on the similarity of nitrogen and oxygen ionic radii, O 2p and N 2p energy states, low formation energy, and high solubility. N-ion doping is found to generate the creation of Zn interstitials and oxygen vacancies, resulting in a band gap narrowing (Citation10). Additionally, the formed nitrogen defective species are found to have a major effect on photocatalytic behavior (Citation11). The introduction of nitrogen into ZnO crystal lattice can be done from various sources, using different preparation methods. These methods include ammonium hydroxide and sol-gel technique (Citation12), as well as chemical precipitation (Citation13), hydrothermal method (Citation14), and pulsed laser deposition (Citation15). The N-ion doped ZnO was previously also prepared by decomposition of zinc nitrate under different temperatures (Citation16). The one-step synthesis was employed by Wu (Citation17) who used added NH4NO3 as a source of nitrogen. The method described within this research is found to be simple, cost-effective, and possibly suitable for the industrial preparation of N-ion doped ZnO.
In mechanochemical synthesis, chemical products are produced by avoiding or greatly reducing solvents as reaction media. However, the use of solvents in the purification and isolation of the products remains to be discussed (Citation18). In previous research, the standard synthesis approach was zinc acetate and ethylenediamine, which are dissolved in ethanol, and subsequently dried and calcined. Ethylenediamine is highly toxic when it reacts with moisture in the air and can cause serious health damage (Citation19). The method described in our study does not include any highly toxic compounds and products thus, it is ideal for large-scale production of an N-ion doped ZnO that can be used to treat wastewaters polluted by thiazine dyes. Other synthesis methods like chemical precipitation (Citation13), hydrothermal method (Citation14), and pulsed laser deposition (Citation15) are less cost-effective and used for the production of surfaces which are photocatalytic active.
This study describes the one-pot mechanochemically induced solvent-deficient synthesis of N-ion doped ZnO that follows the principles of green chemistry. Our study followed the calcination temperature of the N-ion doped ZnO and its effects on the morphological, structural, optical, and degradation properties of the MB by photocatalysis.
2. Experimental
Zinc nitrate hexahydrate (Zn(NO3)2·6H2O, ≥ 99% Sigma Aldrich), and ammonium bicarbonate (NH4HCO3, ≥ 99% Sigma Aldrich), are used for the synthesis of N-ion doped ZnO, were mixed in a molar ratio of 2:1 and then mechanically stirred (mortar and pestle) for half an hour. After that, samples were calcined for 2 h at 300°C, 400°C, 500°C, or 600°C, and marked ZnO 300, ZnO 400, ZnO 500, and ZnO 600, respectively. During calcination, the initial temperature was set to 50°C, and it was slowly raised to the calcination temperature (3°C min−1) to avoid overheating and uncontrolled reaction.
The calcination of the precursor powder was performed in a Nabertherm L3/11/B180 muffle furnace for two hours at 300°C, 400°C, 500°C, or 600°C with a heating/cooling rate of 3°C min−1. The thermal behavior of the precursor mixture was analyzed in an air atmosphere with SDT 2960 Simultaneous DSC-TGA, and TA Instruments, respectively. Analysis of gases during the reaction was done with a Bruker FTIR gas analyzer.
The phase identification of the samples was conducted using X-ray powder diffraction (XRD) on a PAN analytical X'Pert Powder XRD machine. The measurements were performed in the range from 20° to 80° of 2θ at 0.02° increments. XRD data are compared to standard XRD data of hexagonal wurtzite ZnO (JCPDS No. 00-036-1451) (Citation20). The crystallite size of the investigated samples was estimated using the Scherrer equation.
The FTIR spectrophotometer Bruker ‘Tensor 27’ was used for structure assessment of N-ion doped ZnO samples in the range of 4000 to 400 cm−1.
The semiconductor properties of ZnO were tested using an Agilent Cary 5000 UV-Vis-NIR spectrophotometer, equipped with a DRA-2500 diffuse reflection accessory. The measurements were performed in the wavelength range from 200 to 800 nm, with a one nm step resolution and a recording speed of 600 nm min−1. The spectrum of commercial PTFE was used as the baseline. The surface morphology of N-ion doped ZnO was examined with a scanning electron microscope (JEOL).
The XPS measurements were performed with a PHI VersaProbe II scanning XPS microprobe (Physical Instruments AG, Germany). The XPS analysis was performed using a monochromatic Al Kα X-ray source of 50.2 W power with a beam size of 200 µm. The pass energy was 46.95 eV yielding a full width at half maximum of 0.91 eV for the Ag 3d 5/2 peak. The energy scale was calibrated by fixing the adventitious carbon peak at 284.8 eV.
The BET surface area, that is, the N2 adsorption-desorption measurements of the samples, were measured using a 3P INSTRUMENTS Surface Area and Pore Size Analyzer, Sync 110A model. The sample was degassed at 200°C for 2 h under a nitrogen atmosphere.
The pH value was measured using the LLG-pH Meter 7 after dispersing 0.10 g of N-ion doped ZnO in 5 mL water. The dispersion is prepared with the help of a WiseMix vortex mixer.
The photocatalytic activity of ZnO was determined based on the color degradation of methylene blue (MB) dye. The photocatalysis of the synthesized material was monitored using sunlight as the only source of radiation. The experiments were set at room temperature with constant stirring on a magnetic stirrer. The 100 mL of MB solution (10 ppm) was mixed with 100 mg of ZnO powder. The mixture was left in the dark for the first hour, with constant stirring, to achieve the best possible dispersion and reach adsorption-desorption equilibrium. After that, the dispersion was exposed to sunlight, and, in 5, 10, 30, 60, 120, and 180 min time intervals, samples were taken, centrifugated for 5 min at 8000 rpm, separated from the particles, and scanned on a Perkin-Elmer Lambda 25 spectrophotometer. The light intensity was monitored by a lux meter and the average intensity was around 1000 lux. The concentration of MB solution was determined based on Lambert-Beer’s law.
3. Results and discussion
3.1. Thermal analysis of synthesis process
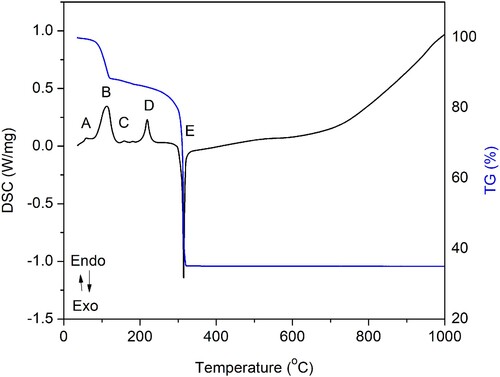
During precursor mixing for 30 min at room temperature, there was a mechanically induced reaction between zinc nitrate hexahydrate and ammonium bicarbonate. In the previous study done by Smith et al. (Citation21) dealing with the decomposition of such an unrinsed precursor mixture, it was determined that dried material consists of NH4NO3, Zn5(OH)6(CO3)2, Zn(OH)(NO3)·NH3, Zn(OH)(NO3)·H2O, and (NH4)Zn(CO3)(NO3)·NH3. The TG/DTA results () of the mixture of precursors heated up to 1000°C revealed four endothermic (A, B, C, and D) and one exothermic reaction (E) followed by an overall mass decrease.
Figure 1. TGA/DSC of the N-ion doped ZnO precursor (zinc nitrate hexahydrate and ammonium bicarbonate) after mechanical mixing. Four endothermic (A. B, C, and D) and one exothermic (E) peak can be distinguished, followed by the overall mass decrease.
The entire chemical reaction can be described by the set of chemical and phase transitions shown in .
Table 1. Reactions and phase transitions occur during the five stages in the solvent-deficient synthesis of N-ion doped ZnO.
The endothermic peak A with the maximum at 59.1 °C can be ascribed to NH4NO3 IV → II polymorphic phase transition. This transition is previously described by Simões et al. (Citation22), who recorded this transition at 57.5 ± 0.4 °C. Initially, the first weight loss increased slightly below 70°C, which was due to the evaporation of physically adsorbed water (H2O).
Simões et al. also described NH4NO3 II → I polymorphic phase transition occurring at 125.5 ± 0.3. This transition, in our case, is part of a much broader peak B with a maximum at 113.0°C. The exothermic change is followed by an 11.8% decrease in mass. This fact implies parallel reactions, which probably can be assigned to the decomposition of intermediate compounds. The proposed mechanism includes decomposition of Zn(OH)(NO3)·NH3 and Zn(OH)(NO3)·H2O followed by the release of NH3(g) and H2O(g). Previously done studies (Citation23,Citation24) dealing with the thermal decomposition of the zinc hydroxy nitrates Zn5(OH)8(NO3)2·2H2O and ZnOHNO3·H2O revealed that the first phase of decomposition happens at temperatures up to 140 °C. The thermal decomposition of (NH4)Zn(CO3)(NO3)·NH3 is not previously described but based on the FTIR analysis of byproduct gases (see Supplementary Materials, Fig. S1) and research on similar systems (Zn(NH3)(CO3) decomposition at 289°C (Citation27) the mechanism is proposed. This reaction mechanism includes the release of NH3 in the temperature interval up to 140°C, followed by (NH4)Zn(CO3)(NO3) decomposition at temperatures up to 300°C.
It is generally accepted that ammonium nitrate (AN) transition temperatures are dependent on several factors, including water and impurity content (Citation28). In a complex chemical environment, as is the case here, it is expected that absolute transition temperatures will be shifted. Apropos, endothermic peak C with the maximum at 158.5°C is marking AN melting. Simões et al. (Citation22) recorded AN melting at 164.4 ± 0.9. In the research by Oxley et al. (Citation25) dealing with the thermal stability of AN in the presence of various additives, it is confirmed that certain additives (including carbonates) mixed with AN, are depressing AN melting point. The presence of Zn5(OH)6(CO3)2 in the reaction system may have a similar effect.
The endothermic peak D can be ascribed to the Zn5(OH)6(CO3)2 decomposition. Virtudazo et al. (Citation26) have described this decomposition as a relatively sharp step, with peak decomposition temperature at 240–250°C (∼25.2% mass loss). The proposed reaction includes the release of CO2, which is in our study, confirmed by the FTIR gas analysis (see Supplementary Materials, Fig. S1). In this temperature region, there is also the decomposition of Zn(OH)(NO3). In research by Biswick et al. (Citation24), this decomposition is described as a two-step process. The first one involves Zn(NO3)2, ZnO, H2O, and HNO3 and the second one includes Zn(NO3)2 decomposition into ZnO, NO2, and O2. The first phase is suggested to happen in the temperature range from 160°C to 240°C, and the second one in the range from 240°C to 300°C. In our research, FTIR gas analysis (see Supplementary Materials, Fig. S1) confirmed the evaporation of HNO3, H2O, and NO2 from the system, which supports the proposed mechanism. It is noteworthy that Smith et al. (Citation21) failed to confirm the existence of HNO3 within the reaction mixture.
Oxley et al. (Citation25) also discussed the exothermic decomposition of AN. This decomposition is, in our case, marked by the prominent exothermic peak E with a maximum at 314.6°C, followed by a significant mass decrease (51.45%). Oxley et al. (Citation25) interpreted that a shift in the position of the exothermic maximum of the mixture from that of the near peak of AN (326.8°C) to lower temperatures as a certain indication of destabilization. Previous studies have shown that acidic species, such as ammonium ion, hydronium ion, or nitric acid, increase the rate of AN decomposition dramatically, while bases such as ammonia or water retard decomposition (Citation29,Citation30). Studies have shown that the decomposition of AN operates by an ionic mechanism in the temperature range of 200–300°C and the formation of nitronium ion (NO2+) is rate-determining. This is directly implying that in our study, a complex precursor mixture, the acidic HNO3 component is destabilizing AN. The proposed AN decomposition includes the formation of N2O and H2O, as confirmed by FTIR gas analysis (see Supplementary Materials, Fig. S1). The evolution of N2O is probably followed by its adsorption and reduction to N-ions, as described elsewhere (Citation31).
The complex nature and existence of parallel reactions during solvent-deficient synthesis are also noticed during the preparation of CeO2 (Citation32) and BiFeO3 (Citation33).
3.2. Structural analysis of synthesis products
To further examine the reaction products, ZnO 300, ZnO 400, ZnO 500, and ZnO 600 samples were investigated using XRD. The XRD patterns are well-matched with the JCPDS file #00-036-1451 of the standard ZnO that can be indexed as corresponding to the reflection of hexagonal wurtzite ZnO structure. No characteristic peaks of impurity phases were observed, as shown in .
Figure 2. XRD patterns of as-prepared N-ion doped ZnO powders calcined at 300°C, 400°C, 500°C, and 600°C with the ZnO Miller-indices (hkl) denoted above the pattern.
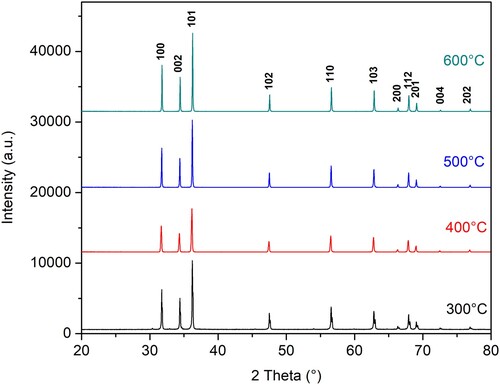
Comparing the sample diffraction data with the standard JCPDS #00-036-1451, a minor shift in peak position can be observed. Noted variation of the peak position and concerning temperature is found to be non-uniform. The displacement of the diffraction peaks can occur for several reasons. One of them is that at lower calcination temperatures, Zn/ZnO-type composites can be formed (Citation34). However, as the calcination temperature increases, pure ZnO emerges with a high degree of crystallinity. The shift of the peaks can also result in the incorporation of a very low percentage of nitrogen into the crystalline structure of ZnO, which is possible given the precursors used. According to the literature, the color of the synthesized material, which is in our case pink, is proof of nitrogen present in the sample (Citation13,Citation35,Citation36), and it was most intense in the ZnO 300 sample. Some authors have also examined the influence of calcination temperature on material properties and attributed the displacement of diffraction peaks to the presence of crystal lattice defects in the form of vacancies and interstitials (Citation37).
The follow-up of the ZnO (101) peak at all four temperatures () is elucidating the change. The peak position (Standard 2θ value = 36.253 (Citation20)) is first shifted to the lower 2θ values (from 300°C to 400°C) and then, in a regular manner to the higher 2θ values (from 400°C to 500°C and 600°C). The followed peak in the diffractogram recorded after annealing at 300°C consists of two peaks implicating a more complex chemical composition and possibly an unfinished transition from precursor compounds to crystalline ZnO structure. The peak shift from 400°C to 600°C is found to be regular. The peak shifting is previously found to be a signature of the doping effect and present defects (Citation38). Calcination at higher temperatures results in peak shift towards higher 2θ values suggesting compressional stress and lowering of N-ion content (Citation38).
Figure 3. The variation of (1 0 1) peak width and position following the calcination temperature for N-ion doped ZnO powders calcined at 300°C, 400°C, 500°C, and 600°C.
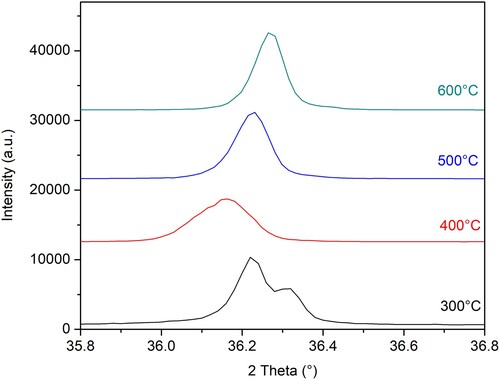
The other noticeable effect visible from is that the intensity of the (101) peak is increasing with increasing calcination temperature from 400°C to 600°C. An increase in peak intensity is previously found to correlate with a decrease in N-ion concentration within the structure (Citation38). In another research, the sharpening and attenuation of N-doped ZnO peaks with increased calcination temperature were found to indicate crystallinity increase (Citation16).
By using Scherrer’s equation (Citation39), the crystallite size was determined to be 57.05, 68.93, 85.28, and 102.49 nm for ZnO 300, ZnO 400, ZnO 500, and ZnO 600, respectively as reported in . In the previous research dealing with the solvent-deficient synthesis of N-ion doped ZnO, the obtained value of crystallite size after two hours long heating at 300°C was 60 ± 25 nm (Citation21).
Table 2. The crystallite size of N-ion doped ZnO obtained by the Scherrer equation.
3.3. Spectroscopic analysis of synthesis products
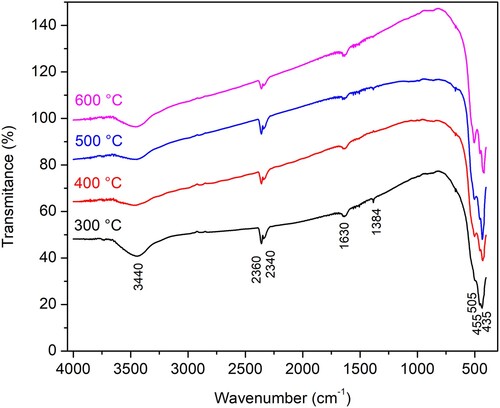
FTIR spectra of the N-ion doped ZnO are presented in . Regardless of the calcination temperature samples show absorption peaks around 3460 and 1650 cm−1, which corresponds to the O-H stretching and bending vibration of the water molecule (Citation40). The weak peak at 1380 cm−1 may correspond to the vibration of the Zn-N bonds (Citation41). The relative intensity of this peak decreases with increasing calcination temperature supporting the idea of nitrogen release from the material at higher temperatures. The absorption peaks below 600 cm−1 correspond to the characteristic absorption of the Zn-O bond in zinc oxide. The double peaks at 2340 and 2360 cm−1 correspond to the characteristic absorption of CO2 (Citation42).
Figure 4. FTIR spectra of N-ion doped ZnO powders calcined at 300°C, 400°C, 500°C, and 600°C.
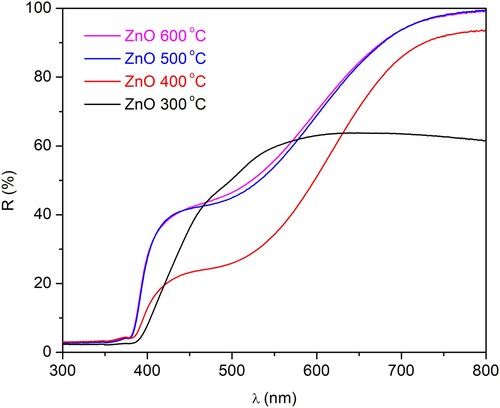
Diffuse reflection spectroscopy (DRS) of all synthesized N-ion doped ZnO is shown in . These spectra show that there are significant differences between the synthesized materials. The sample calcined at 300°C is showing remarkably different reflectance patterns in comparison to the other three samples. This is probably due to the remnant unreacted precursor and intermediate chemical species already recognized during XRD and FTIR analysis. On the other hand, samples calcined at 400, and especially samples calcined at 500°C and 600°C, result in highly similar reflectance spectra.
Figure 5. Reflectance spectra of N-ion doped ZnO powders calcined at 300°C, 400°C, 500°C, and 600°C.
The XPS spectra recorded for the ZnO 300 sample ((a)) indicate the appearance of the N 1s core-level peak with a binding energy of about 408.4 eV ((b)). This peak is due to the presence of chemical NO bonds, which is most probably caused by nitrogen ions adsorbed on the oxide surface (Citation43). As mentioned in the Thermal analysis of the synthesis process section, the formation of nitronium ion (formed by AN decomposition) is set in the temperature range of 200–300°C. Such an ion is further probably reacting with the ZnO surface, resulting in further reduction and nitrogen incorporation within the ZnO lattice.
Figure 6. (a) The survey of XPS results for the sample at 300°C; (b) high-resolution N1s peak of XPS spectra for the sample annealed at 300°C.
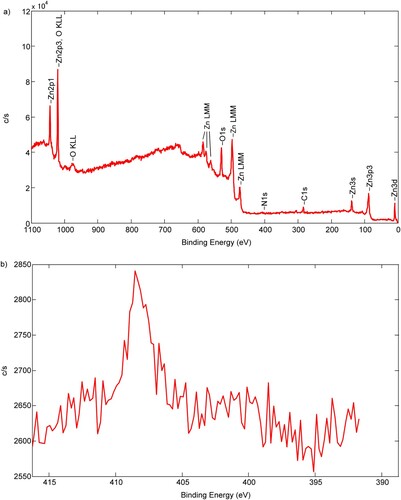
XPS spectra recorded for the ZnO 500 and ZnO 600 samples indicate the absence of peaks located at 396 and 400 eV demonstrating limited nitrogen incorporation (Citation44) (see Supplementary Materials, Fig. S2 to Fig. S5). The recorded absence of peaks from N 1s was previously reported for nitrogen-doped titania (Citation45). Cerrato et al. (Citation11) reported nitrogen content for N-doped ZnO for material annealed at 300°C and 500°C for 3 h, in both samples, nitrogen content was low, about 1%. This fact implies that the characteristic behavior of the material is solely due to the nature of defective species and not due to nitrogen content (see discussion below). In a study by Bhirud et al. (Citation46) the N-doped ZnO samples annealed at temperatures below 400°C show n-type conduction and samples annealed at 500°C, 600°C, and 700°C changed from n-type conduction to p-type conduction. However, for the sample formed by annealing at 800°C, the conduction gets back to n-type conduction. Bhirud et al. suggest that cause of the n-type conduction for the sample annealed at 800°C is the lower stability of the Zn-N bond compared to the Zn-O bond at 800°C. Using Raman spectroscopy, these authors found that the largest defect concentrations are in the sample annealed at 500°C.
The direct bandgap energies (Eg) of the N-ion doped ZnO samples were determined from the plots of Kubelka–Munk function versus photon energy (hν). The diffuse reflectance R is correlated to the Kubelka–Munk function F(R) by relation F(R) = (1-R2)/(2R), and the bandgap energy was estimated from the intercepts obtained by the extrapolation of linear curves on the y-axis on the diagram (F(R)×E)2 = f(hν) (). The determined bandgap values are 3.15, 3.20, 3.21 and 3.22 eV for N-ion doped ZnO calcined at 300°C, 400°C, 500°C and 600°C, respectively. The values of bandgap energy for all samples are smaller than ‘bulk’ ZnO (3.37 eV) (Citation47). The ZnO bandgap value (3.3 eV) is also reported in another research (Citation11). Although increasing calcination temperature has no significant influence on the bandgap energy, it changes from 0.01 to 0.02 eV. This implies that the change in the size of the energy gap, compared to ‘bulk’ ZnO, is due to changes in the structure of the material, the appearance of crystal lattice defects, in the form of oxygen vacancies, as well as the presence of N-ions in the structure (Citation48). Two main routes of nitrogen doping in ZnO structure are previously identified to be the replacement of oxygen with nitrogen and/or occupation of interstitial sites (Citation49).
Figure 7. Kubelka–Munk curves indicate the bandgap energies for the N-ion doped ZnO powders calcined at 300°C, 400°C, 500°C, and 600°C.
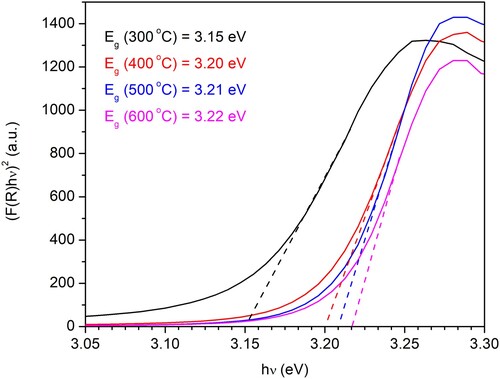
In the previous work, it is determined that the ZnO bandgap reduces with N-ion implantation (Citation50). This implies that in our study, synthesized ZnO powder has higher N-ion content after calcining at lower temperatures.
3.4. Surface and specific surface analysis of synthesis products
SEM images of ZnO samples synthesized at different temperatures are shown in . The ZnO particles are non-uniform of different shapes and sizes, in the range from 200 nm to 3 µm. ZnO 500 sample shows uniform particle size, which can affect the photocatalytic potential of this semiconducting material. Because of the high surface area during the annealing and storage at room temperature, the ZnO particles in all samples agglomerate into larger size particles to reduce the surface energy (Citation51).
Figure 8. SEM of ZnO synthesized at: (a) 300°C, (b) 400°C, (c) 500°C and (d) 600°C. Pictures are recorded under 15 keV SEI and at WD of 8 mm.
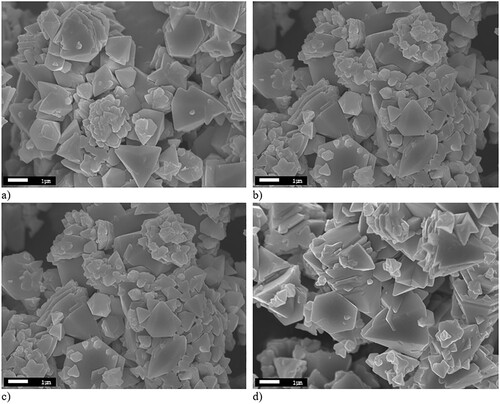
The result of such aggregation is visible in . This probably results from the process of ammonium nitrate exothermic decomposition (, Step E), which intensifies the process of nanoparticles aggregation. The previous studies (Citation21), showed that washing out ammonium nitrate would result in fine ZnO nanoparticles but without doped N-ions. The ammonium nitrate is therefore important as a source of nitrogen. At the same time, the decomposition of intermediate ammonium nitrate results in intense ZnO nanoparticle aggregation due to significant heating from the exothermic reaction. Wu (Citation17) has determined that using NH4NO3 as a nitrogen source leads to a smaller specific surface area for N-ion doped ZnO than for pure ZnO. The author found the specific surface area for the N-ion doped ZnO prepared at 600°C to be 37 m2 g−1. The reason is determined to be a collapse of small pores in the ZnO sample during calcination. In our study, the value of the specific surface area for ZnO 400 sample is found to be 39.8 m2 g−1, respectively. For the same sample, the total pore volume is determined to be 0.028 cm3 g−1, respectively.
3.5. N-ion doped ZnO photocatalytic activity
The MB dye degradation is a good system for the evaluation of photocatalytic properties of metallic oxides, such as ZnO (Citation52). Namely, if the ZnO sample is illuminated by the photon energy, hν (λ > 368 nm) which is equal to or greater than the bandgap value, two processes occur. First, the excitation from the valence to the conduction band happens, and afterward formation of electron-hole pairs as described by the equation:
Since the hole charge (h+) is positive, it can lead to the formation of ·OH radicals on the ZnO surface, while the charge of the conductive band (i.e. electron) is negative enough to lead to a reduction of oxygen molecule •O2−. •OH radicals are extremely reactive species and can oxidize different organic molecules (such as MB) adsorbed on the ZnO surface. It initiates their decomposition in less toxic molecules, such as water and carbon dioxide. The following mechanism has been proposed:
The radicals initiate a series of reactions, upon which the bonds in organic molecules and aromatic rings are broken, and intermediate species get transformed into final degradation products due to the oxidation process. So, both radicals, (O2·−) and (·OH) could equally contribute and have a significant role in MB decomposition (53). Here, we consider that hydroxyl radicals have a predominant role over oxidation species since (·OH) radicals favor the neutral and alkaline pH range. The pH value of N-ion doped ZnO water dispersions is found to be 8.01, 8.07, 8.13, and 8.11 for the ZnO 300, ZnO 400, ZnO 500, and ZnO 600 samples, respectively. Therefore, when the MB molecule adsorbs onto the catalyst surface, hydroxyl radicals are responsible for the degradation of MB. Likely, Cerrato et al. (Citation11) reported the temperature influence on N-ion doped ZnO and found that species heated at higher temperatures (i.e. 500°C) have an abundance of N*2- centers which are very effective in producing the hydroxyl radicals, which complies with our findings. On the other hand, N-ion doped ZnO catalyst species heated at 300°C, have more N2*- centers which are more efficient in reduction of water, producing more oxidation species. Overall, it seems that band gap value in N-ion doped ZnO catalyst is not a primary parameter to be considered for efficient photodegradation of MB molecules, but rather processes of oxidation and reduction, as well as species these processes produce.
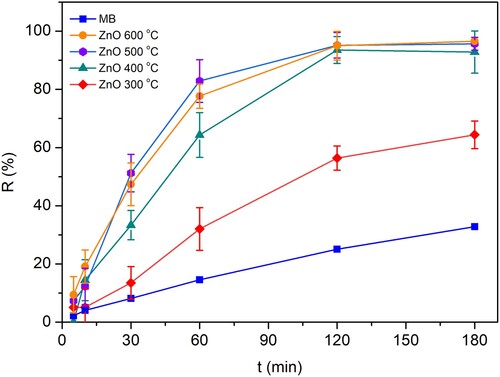
The photocatalytic activity and potential of as-prepared N-ion doped ZnO were evaluated according to the proposed MB decomposition. The MB decomposition process was monitored via UV/VIS spectrophotometry in the following time intervals: 5, 10, 30, 60, 120, and 180 min. The results are displayed in . The N-ion doped ZnO samples heated at 500°C and 600°C gave the most satisfactory results. The MB was almost completely degraded after 180 min in the presence of N-ion doped ZnO. Without photocatalyst present, the MB decomposition after 180 min was approximately 25%. All the N-ion doped ZnO samples showed positive contribution: ZnO 300 – 53%, ZnO 400 – 92%, ZnO 500 – 96% and ZnO 600 – 97% of degradation. The differences in the rate of degradation could be potentially ascribed to different N-ion incorporation into the lattice structure of ZnO, whether they occur as substitutional or interstitial defects (Citation49). The number of N-ions in doped ZnO in this research was found to result in an overall lowering of band gap values. The bandgap values of Zn 400, Zn 500, and Zn 600 are found to be just slightly different (), which is expected to further cause difficulties in their photocatalytic efficiency differentiation (). Samadi et al. reported that non-metal doping might contribute to an increase in defect formation but also valence band upward shifting, which can greatly affect the photocatalytic properties (Citation10). Additionally, Kumar et al. found that the photocatalytic degradation of acetaminophen under sunlight for 120 min using N-ion doped ZnO increases by increasing the N-ion doping concentration (Citation38). So, different heating treatments could produce various ZnO structures containing different amounts of non-metal doping agent (N2), which could consequently result in different photocatalytic potential. Nitrogen itself might cause the formation of oxygen vacancies, as well as zinc interstitials during doping, which generates an appropriate electronic structure with a narrower bandgap (Citation10). Consequently, such structure re-organization could contribute to different kinetics. Therefore, kinetics calculations were performed.
Figure 9. Photocatalytic activity (R%) of N-ion doped ZnO samples on MB degradation.
For the kinetic estimations, the standard zero, I, and II-order kinetics equations were fitted to the experimental data to conclude which appropriate model best describes the kinetics of degradation of MB. The first-order kinetics gave the best fit. As previously reported, the photocatalysis of MB dye follows the kinetics of pseudo-first-order (Citation52). summarizes the constant rate and half-time values for all the investigated samples of N-ion doped ZnO. From the kinetic point of view, the ZnO 500 sample gave the most desirable photocatalytic properties having a constant rate value amounted to 1.96·10−2 min−1 and a half-life of 35.33 min.
Table 3. The kinetic parameters for MB degradation by using N-ion doped ZnO as a photocatalyst.
Albiss et al. explored the photocatalytic properties of ZnO-ACF (activated carbon fiber), reporting the 99% of MB photodegradation after 120 min with k = 4.2·10−2 min−1 (Citation53). These results were obtained at neutral pH, which proved to be the most suitable and the most effective for MB degradation (Citation53,Citation54). The change is found to be small probably due to the minor oxygen to nitrogen ratio change. Prabakaran et al. determined the value of k to be 0.0585 min−1 for MB degradation by hydrothermally produced N-doped ZnO nanoparticles with cabbage morphology under visible light (Citation55). It is important to mention that the MB concentration used in this study was 15 ppm. The comparative results support the idea that further pH and MB concentration adjustment could intensify MB photodegradation in the presence of an N-doped ZnO catalyst. In another study, the thin film of N-ion doped ZnO and N-ion doped ZnO/CNT nanocomposite was successfully fabricated on a soda-lime glass substrate by a sol-gel drop-coating method. The k value reported for N-doped ZnO under vis and N-ion doped ZnO/CNT under vis was 0.0017 and 0.0040 min−1 (Citation56).
4. Conclusions
N-ion doped ZnO was synthesized by a mechanochemically induced solvent-deficient method by calcination at four different temperatures (300°C, 400°C, 500°C, and 600°C). The N-ion implantation is probably happening during the intermediate NH4NO3 decomposition. The exothermic nature of this reaction is responsible for an increase in the ZnO particle size. The calcination of N-ion doped ZnO at different temperatures is leading to XRD peaks shifting and band gap value change, all probably caused by the N-ion variable content.
The presence of N-ion in the ZnO crystal structure calcined at 400°C, 500°C and 600°C is causing a significant visible light absorption, enhancing the photocatalytic degradation of methylene blue. The N-ion doped ZnO calcined at 300°C, regardless of its smaller bandgap value, results in a modest MB photodegradation. This finding supports the idea that N-ion doped ZnO thermal treatment is yielding materials with different nitrogen defects and different chemistry. The most efficient N-doped ZnO catalyst obtained by the mechanochemically induced solvent-deficient method favors the production of hydroxyl radicals and temperatures above 400°C for the successful degradation of MB molecules.
Supplemental Material
Download MS Word (1.7 MB)Acknowledgments
This article is based upon work from COST Action Mechanochemistry for Sustainable Industry (Mech@SustInd), CA18112, supported by COST (European Cooperation in Science and Technology) – www.cost.eu.
Disclosure statement
No potential conflict of interest was reported by the author(s).
Correction Statement
This article has been republished with minor changes. These changes do not impact the academic content of the article.
References
- Yaseen, D.A.; Scholz, M. Textile Dye Wastewater Characteristics and Constituents of Synthetic Effluents: A Critical Review. Int. J. Environ. Sci. Technol 2019, 16 (2), 1193–1226.
- Mahapatra, K.; Ramteke, D.S.; Paliwal, L.J. Production of Activated Carbon from Sludge of Food Processing Industry Under Controlled Pyrolysis and Its Application for Methylene Blue Removal. J. Anal. Appl. Pyrolysis 2012, 95, 79–86.
- Gupta, V.K.; Suhas; Ali, I.; Saini, V.K. Removal of Rhodamine B, Fast Green, and Methylene Blue from Wastewater Using Red Mud, an Aluminum Industry Waste. Ind. Eng. Chem. Res 2004, 43 (7), 1740–1747.
- Serpone, N.; Emeline, A.V. Semiconductor Photocatalysis — Past, Present, and Future Outlook. J. Phys. Chem. Lett 2012, 3 (5), 673–677.
- Khalafi, T.; Buazar, F.; Ghanemi, K. Phycosynthesis and Enhanced Photocatalytic Activity of Zinc Oxide Nanoparticles Toward Organosulfur Pollutants. Sci. Rep 2019, 9 (1), 6866.
- Sobana, N.; Swaminathan, M. The Effect of Operational Parameters on the Photocatalytic Degradation of Acid Red 18 by ZnO. Sep. Purif. Technol 2007, 56 (1), 101–107.
- Dindar, B.; Içli, S. Unusual Photoreactivity of Zinc Oxide Irradiated by Concentrated Sunlight. J. Photochem. Photobiol. Chem 2001, 140 (3), 263–268.
- Farag, H.K.; Aboelenin, R.M.M.; Fathy, N.A. Photodegradation of Methyl Orange Dye by ZnO Loaded onto Carbon Xerogels Composites: ZnO/Carbon Xerogel Composite for Dye Degradation. Asia-Pac. J. Chem. Eng 2017, 12 (1), 4–12.
- El-Khouly, S.M.; Mohamed, G.M.; Fathy, N.A.; Fagal, G.A. Effect of Nanosized CeO2 or ZnO Loading on Adsorption and Catalytic Properties of Activated Carbon. Adsorpt. Sci. Technol 2017, 35 (9–10), 774–788.
- Samadi, M.; Zirak, M.; Naseri, A.; Khorashadizade, E.; Moshfegh, A.Z. Recent Progress on Doped ZnO Nanostructures for Visible-Light Photocatalysis. Thin Solid Films 2016, 605, 2–19.
- Cerrato, E.; Privitera, A.; Chiesa, M.; Salvadori, E.; Paganini, M.C. Nitrogen-Doped Zinc Oxide for Photo-Driven Molecular Hydrogen Production. Int. J. Mol. Sci. 2022, 23 (9), 5222.
- Ferrari-Lima, A.M.; de Souza, R.P.; Mendes, S.S.; Marques, R.G.; Gimenes, M.L.; Fernandes-Machado, N.R.C. Photodegradation of Benzene, Toluene and Xylenes Under Visible Light Applying N-Doped Mixed TiO2 and ZnO Catalysts. Catal. Today 2015, 241, 40–46.
- Kumari, R.; Sahai, A.; Goswami, N. Effect of Nitrogen Doping on Structural and Optical Properties of ZnO Nanoparticles. Prog. Nat. Sci. Mater. Int 2015, 25 (4), 300–309.
- Mahmood, K.; Swain, B.S.; Han, G.-S.; Kim, B.-J.; Jung, H.S. Polyethylenimine-Assisted Growth of High-Aspect-Ratio Nitrogen-Doped ZnO (NZO) Nanorod Arrays and Their Effect on Performance of Dye-Sensitized Solar Cells. ACS Appl. Mater. Interfaces 2014, 6 (13), 10028–10043.
- Allenic, A.; Guo, W.; Chen, Y.B.; Zhao, G.Y.; Pan, X.Q.; Che, Y.; Hu, Z.D.; Liu, B. Synthesis and Properties of p -Type Nitrogen-Doped ZnO Thin Films by Pulsed Laser Ablation of a Zn-Rich Zn3N2 Target. J. Mater. Res 2007, 22 (8), 2339–2344.
- Shifu, C.; Wei, Z.; Sujuan, Z.; Wei, L. Preparation, Characterization and Photocatalytic Activity of N-Containing ZnO Powder. Chem. Eng. J 2009, 148 (2–3), 263–269.
- Wu, C. Facile One-Step Synthesis of N-Doped ZnO Micropolyhedrons for Efficient Photocatalytic Degradation of Formaldehyde Under Visible-Light Irradiation. Appl. Surf. Sci 2014, 319, 237–243.
- James, S.L.; Adams, C.J.; Bolm, C.; Braga, D.; Collier, P.; Friščić, T.; Grepioni, F.; Harris, K.D.M.; Hyett, G.; Jones, W.; Krebs, A.; Mack, J.; Maini, L.; Orpen, A.G.; Parkin, I.P.; Shearouse, W.C.; Steed, J.W.; Waddell, D.C. Mechanochemistry: Opportunities for New and Cleaner Synthesis. Chem Soc Rev 2012, 41 (1), 413–447.
- Smyth, H.F.; Carpenter, C.P.; Well, C.S.; Pozzani, U.C.; Striegel, J.A. Range-Finding Toxicity Data: List VI. Am. Ind. Hyg. Assoc. J 1962, 23 (2), 95–107.
- Yadav, M.S.; Singh, N.; Bobade, S.M. Zinc Oxide Nanoparticles and Activated Charcoal-Based Nanocomposite Electrode for Supercapacitor Application. Ionics 2018, 24 (11), 3611–3630.
- Smith, S.J.; Huang, B.; Liu, S.; Liu, Q.; Olsen, R.E.; Boerio-Goates, J.; Woodfield, B.F. Synthesis of Metal Oxide Nanoparticles via a Robust “Solvent-Deficient” Method. Nanoscale 2015, 7 (1), 144–156.
- Simões, P.N.; Pedroso, L.M.; Portugal, A.A.; Campos, J.L. Study of the Decomposition of Phase Stabilized Ammonium Nitrate (PSAN) by Simultaneous Thermal Analysis: Determination of Kinetic Parameters. Thermochim. Acta 1998, 319 (1), 55–65.
- Auffredic, J.-P.; Louër, D. Etude thermodynamique de la décomposition thermique des hydroxynitrates de zinc. J. Solid State Chem 1983, 46 (2), 245–252.
- Biswick, T.; Jones, W.; Pacuła, A.; Serwicka, E.; Podobinski, J. The Role of Anhydrous Zinc Nitrate in the Thermal Decomposition of the Zinc Hydroxy Nitrates Zn5(OH)8(NO3)2·2H2O and ZnOHNO3·H2O. J. Solid State Chem 2007, 180 (4), 1171–1179.
- Oxley, J.C.; Smith, J.L.; Rogers, E.; Yu, M. Ammonium Nitrate: Thermal Stability and Explosivity Modifiers. Thermochim. Acta 2002, 384 (1–2), 23–45.
- Virtudazo, R.V.R.; Guo, Q.; Wu, R.; Takei, T.; Mori, T. An Alternative, Faster and Simpler Method for the Formation of Hierarchically Porous ZnO Particles and Their Thermoelectric Performance. RSC Adv 2017, 7 (51), 31960–31968.
- López, F.A.; Cebriano, T.; García-Díaz, I.; Fernández, P.; Rodríguez, O.; Fernández, A.L. Synthesis and Microstructural Properties of Zinc Oxide Nanoparticles Prepared by Selective Leaching of Zinc from Spent Alkaline Batteries Using Ammoniacal Ammonium Carbonate. J. Clean. Prod 2017, 148, 795–803.
- Ingman, J.S.; Kearley, G.J.; Kettle, S.F.A. Optical and Thermal Studies of Transitions Between Phases II, III and IV of Ammonium Nitrate. J. Chem. Soc. Faraday Trans. 1 Phys. Chem. Condens. Phases 1982, 78 (6), 1817.
- Brower, K.R.; Oxley, J.C.; Tewari, M. Evidence for Homolytic Decomposition of Ammonium Nitrate at High Temperature. J. Phys. Chem 1989, 93 (10), 4029–4033.
- Oxley, J.C.; Kaushik, S.M.; Gilson, N.S. Thermal Decomposition of Ammonium Nitrate-Based Composites. Thermochim. Acta 1989, 153, 269–286.
- Hussain, G.; Rahman, M.M. An Infrared Study of Co-Adsorption of N2O and CO on ZnO. Spectrochim. Acta. A. Mol. Biomol. Spectrosc 2006, 64 (4), 880–885.
- Zeljković, S.; Jelić, D.; Maruyama, H.; Nino, J.C. Solvent-Deficient Synthesis of Cerium Oxide: Characterization and Kinetics. Ceram. Int 2019, 45 (8), 10063–10071.
- Zeljković, S.; Ivas, T.; Maruyama, H.; Nino, J.C. Structural, Magnetic and Optical Properties of BiFeO3 Synthesized by the Solvent-Deficient Method. Ceram. Int 2019, 45 (16), 19793–19798.
- Zeng, H.; Duan, G.; Li, Y.; Yang, S.; Xu, X.; Cai, W. Blue Luminescence of ZnO Nanoparticles Based on Non-Equilibrium Processes: Defect Origins and Emission Controls. Adv. Funct. Mater 2010, 20 (4), 561–572.
- Ma, H.; Cheng, X.; Ma, C.; Dong, X.; Zhang, X.; Xue, M.; Zhang, X.; Fu, Y. Synthesis, Characterization, and Photocatalytic Activity of N-Doped ZnO/ZnS Composites. Int. J. Photoenergy 2013, 2013, e625024.
- Mekki, A.; Tabet, N.; Hezam, M. Synthesis and Characterisation of Nitrogen-Doped ZnO Thin Films. Int. J. Nano Biomater 2009, 2 (1/2/3/4/5), 216.
- Malevu, T.D.; Ocaya, R.O. Effect of Annealing Temperature on Structural: Morphology and Optical Properties of ZnO Nano-Needles Prepared by Zinc- Air Cell System Method. Int J Electrochem Sci 2015, 10, 10.
- Ranjith Kumar, D.; Ranjith, K.S.; Haldorai, Y.; Kandasami, A.; Rajendra Kumar, R.T. Nitrogen-Implanted ZnO Nanorod Arrays for Visible Light Photocatalytic Degradation of a Pharmaceutical Drug Acetaminophen. ACS Omega 2019, 4 (7), 11973–11979.
- Cullity, B.D.; Stock, S.R. Elements of X-Ray Diffraction, Prentice-Hall, New York, 2014.
- Jiménez-González, A.E.; Soto Urueta, J.A.; Suárez-Parra, R. Optical and Electrical Characteristics of Aluminum-Doped ZnO Thin Films Prepared by Slogged Technique. J. Cryst. Growth 1998, 192 (3–4), 430–438.
- Lu, J.; Zhang, Q.; Wang, J.; Saito, F.; Uchida, M. Synthesis of N-Doped ZnO by Grinding and Subsequent Heating ZnO-Urea Mixture. Powder Technol 2006, 162 (1), 33–37.
- Noei, H.; Wöll, C.; Muhler, M.; Wang, Y. Activation of Carbon Dioxide on ZnO Nanoparticles Studied by Vibrational Spectroscopy. J. Phys. Chem. C 2011, 115 (4), 908–914.
- Bian, J.M.; Li, X.M.; Gao, X.D.; Yu, W.D.; Chen, L.D. Deposition and Electrical Properties of N–In Codoped p -Type ZnO Films by Ultrasonic Spray Pyrolysis. Appl Phys Lett 2004, 84, 541–543.
- Saha, N.C.; Tompkins, H.G. Titanium Nitride Oxidation Chemistry: An x-ray Photoelectron Spectroscopy Study. J Appl Phys 1992, 72, 3072–3079.
- Yates, H.M.; Nolan, M.G.; Sheel, D.W.; Pemble, M.E. The Role of Nitrogen Doping on the Development of Visible Light-Induced Photocatalytic Activity in Thin TiO2 Films Grown on Glass by Chemical Vapour Deposition. J Photochem Photobiol Chem 2006, 179, 213–223.
- Bhirud, A.P.; Sathaye, S.D.; Waichal, R.P.; Nikam, L.K.; Kale, B.B. An eco-Friendly, Highly Stable and Efficient Nanostructured p-Type N-Doped ZnO Photocatalyst for Environmentally Benign Solar Hydrogen Production. Green Chem 2012, 14, 2790–2798.
- Kołodziejczak-Radzimska, A.; Jesionowski, T. Zinc Oxide – From Synthesis to Application: A Review. Materials 2014, 7 (4), 2833–2881.
- Marković, S.; Stanković, A.; Dostanić, J.; Veselinović, L.; Mančić, L.; Škapin, S.D.; Dražič, G.; Janković-Častvan, I.; Uskoković, D. Simultaneous Enhancement of Natural Sunlight- and Artificial UV-Driven Photocatalytic Activity of a Mechanically Activated ZnO/SnO2 Composite. RSC Adv 2017, 7 (68), 42725–42737.
- Di Valentin, C.; Pacchioni, G. Spectroscopic Properties of Doped and Defective Semiconducting Oxides from Hybrid Density Functional Calculations. Acc. Chem. Res 2014, 47 (11), 3233–3241.
- Kumar, P.; Malik, H.K.; Ghosh, A.; Thangavel, R.; Asokan, K. An Insight to Origin of Ferromagnetism in ZnO and N Implanted ZnO Thin Films: Experimental and DFT Approach. J. Alloys Compd 2018, 768, 323–328.
- Srivastava, V.; Gusain, D.; Sharma, Y.C. Synthesis, Characterization and Application of Zinc Oxide Nanoparticles (n-ZnO). Ceram. Int 2013, 39 (8), 9803–9808.
- Marković, S.; Rajić, V.; Stanković, A.; Veselinović, L.; Belošević-Čavor, J.; Batalović, K.; Abazović, N.; Škapin, S.D.; Uskoković, D. Effect of PEO Molecular Weight on Sunlight Induced Photocatalytic Activity of ZnO/PEO Composites. Sol. Energy 2016, 127, 124–135.
- Albiss, B.; Abu-Dalo, M. Photocatalytic Degradation of Methylene Blue Using Zinc Oxide Nanorods Grown on Activated Carbon Fibers. Sustainability 2021, 13 (9), 4729.
- Nasrollahpour, A.; Moradi, S.E. Photochemical Degradation of Methylene Blue by Metal Oxide-Supported Activated Carbon Photocatalyst. Desalination Water Treat 2016, 57 (19), 8854–8862.
- Prabakaran, E.; Pillay, K. Synthesis of N-Doped ZnO Nanoparticles with Cabbage Morphology as a Catalyst for the Efficient Photocatalytic Degradation of Methylene Blue Under UV and Visible Light. RSC Adv 2019, 9 (13), 7509–7535.
- Elias, M.; Uddin, M.N.; Saha, J.K.; Hossain, M.A.; Sarker, D.R.; Akter, S.; Siddiquey, I.A.; Uddin, J. A Highly Efficient and Stable Photocatalyst; N-Doped ZnO/CNT Composite Thin Film Synthesized via Simple Sol-Gel Drop Coating Method. Molecules 2021, 26 (5), 1470.