
ABSTRACT
We have characterized the deep eutectic solvent (DES) comprising a 1:1 equimolar mixture of choline chloride and guanidinium thiocyanate (‘guaniline–Cl’), alongside its halide counterparts wherein the bromide or iodide salts of choline are paired with guanidinium thiocyanate (‘guaniline–Br’ and ‘guaniline–I’), as electrolytes for solar photoconversion. These pared-down electrolyte systems containing only DES (up to 90 wt. %), water (up to 40 wt. %), and the I–/I3– redox couple were explored within dye-sensitized solar cells. Average device performance generally increased with a decrease in hydrogen bond affinity (Cl– < Br– < I– ), with guaniline–I yielding markedly higher photocurrents relative to guaniline–Cl and guaniline–Br. Indeed, 70 and 80 wt. % guaniline–I exceeded power conversion efficiencies of 2.0% despite producing lower photovoltages and fill factors than the corresponding Cl/Br-based electrolytes. Attributed in part to solution viscosity, this effect arises chiefly from the fact that guaniline–I contains substantial organic iodide built into the DES proper. Significantly, this self-contained electrolyte can function as the sole iodide source for forming the required electrolyte redox couple, yielding performance essentially equivalent to lower-viscosity electrolytes containing supplemental inorganic iodide, in spite of significant differences in solution viscosity.
GRAPHICAL ABSTRACT
Introduction
The development of more efficient, robust, and inexpensive solar energy harvesting technologies (e.g. photovoltaics) is paramount due to the ever-increasing global energy demand coupled with the frightening climatic consequences brought on by an exponential rise in fossil fuel combustion over the last century. Third-generation photovoltaics (PVs), such as dye-sensitized solar cells (DSSCs), have attracted much technological interest as easy-to-fabricate, highly efficient, and low-cost alternatives to commercialized renewable energy technologies (e.g. Si PVs) (Citation1). Indeed, single device power conversion efficiencies (η) of nearly 15% and certified efficiencies of over 12% have been reported for DSSCs that employ liquid electrolytes (Citation2,Citation3). The exact electrolytic composition (i.e. solvent, redox couple, additives, constituent concentration) within such devices is vital as the physicochemical properties have been shown to, often dramatically, affect both device performance and stability (Citation4,Citation5). Conventionally, organic solvents with high dielectric constants (e.g. acetonitrile) have been employed as the primary media for DSSC electrolytic systems due to their low viscosities and favorable donor numbers (Citation6). Unfortunately, devices utilizing such highly fluid and volatile solvents have a propensity towards electrolyte seepage during sealing, developing leaks post assembly, or, worse, catastrophically rupturing under long-term illumination or intense thermal conditions, flaws that severely hinder widespread commercialization.
To overcome these drawbacks, less fluid and more thermally robust electrolyte media, such as water (Citation7), designer solvents (e.g. ionic liquids (ILs)) (Citation8,Citation9), (quasi) solid-state (polymeric) ionic conductors (Citation10), and IL-based eutectic melts (Citation11,Citation12), have been proposed and explored. In recent years, an emerging class of designer solvent, deep eutectic solvents (DESs), has garnered extensive scientific interest due to similar properties to ILs (e.g. high thermal stabilities) while boasting more environmentally friendly, inexpensive components, as well as more facile syntheses (Citation13,Citation14). Indeed, simply by chemically associating two (or three) hydrogen-bond-capable compounds (typically via mild heating (i.e. 50–60 °C)) in an appropriate mole ratio of hydrogen bond donor (HBD) to hydrogen bond acceptor (HBA), deep freezing point depression can arise, leading to the formation of a eutectic mixture. Given these attributes, as well as offering minimal purification requirements, these novel, frontrunner solvent systems have been applied in many fields such as dissolutions, separations, electrodeposition, chemical/nanomaterials syntheses, (bio)catalysis, biomolecular stabilization, and biomedical therapies (Citation15–19). Of particular interest is their growing potential as cheaper, greener alternatives to organic-solvent- and ionic-liquid-based electrolytes in device technologies (Citation15, Citation20,Citation21), such as PVs (Citation22–24). While employing neat DESs as electrolyte media for DSSCs is an enticing prospect, co-solvents, such as acetonitrile, ethanol, IL, or water, are frequently added (often at high (> 40) vol. or wt. %) to decrease the viscosity or maintain fluidity, as some systems do not achieve the necessary freezing point depression to yield room temperature liquification (Citation25–28). Such dilution of the DES content, particularly by water, is problematic because (i) the DES microenvironment (e.g. intermolecular interactions, hydrogen bonding network) is known to be highly dependent upon water content (Citation29,Citation30), transitioning from hydrated DES to aqueously solvated DES components between 40–50 wt. % water depending on the HBD-HBA pair (Citation31), (ii) the exact role and effect that the DES is playing in and imparting on device performance is obfuscated, especially in systems where common, performance-enhancing additives also constitute the electrolyte composition (which further dilutes the DES content), and (iii) water concentrations greater than 40 vol. % are reported to be detrimental to DSSC performance due to sensitizer desorption, undesirable interactions with additives/salts, and disruption of necessary interfacial contacts (e.g. electrolyte-photoanode) (Citation7). In fact, very little work has been conducted on DSSC electrolytes with high DES content (i.e. > 80 wt. %), systems that could indeed be considered DES (based) electrolytes (Citation32–34).
Furthermore, many of these previous works employed a choline (Ch) halide salt (e.g. ChCl, ChI) as the HBA; however, currently it is unclear if the choice of halide impacts the DES and electrolyte properties, and, thus, PV device performance. Indeed, the HBD is known to strongly compete with the cation of the HBA for intermolecular interactions with the halide counterion (e.g. Cl–) and the extent of these interactions (i.e. hydrogen bonding) has been reported to be greater than the interactions between the HBA ion pair (e.g. Ch+–Cl–), with the halide ion being vital to the formation of the hydrogen bonding network (Citation35,Citation36). Therefore, the choice of halide counterion will undoubtedly influence the resulting halide-HBD interactions, and, thus, the DES microenvironment, electrolyte properties, and PV performance. Additionally, the charge delocalization occurring through hydrogen bonding between the halide anion and the hydrogen-donating moiety on the HBD is reported to be responsible for the decrease in the freezing point of the mixture relative to the melting points of the individual components (Citation37), thus, making not only the choice of HBD and HBA important but also the halide identity. To investigate these potential halide effects, in this work we prepared and characterized simplistic electrolyte systems composed of only the I–/I3– redox couple dissolved in aqueous ChX-based DES (< 40 wt. % water), where X = Cl, Br, or I. Specifically, the novel DES guaniline, a superior DES consisting of a 1:1 molar ratio mixture of choline chloride (ChCl) and guanidinium thiocyanate (GuSCN) (Citation34), as well as two derivatives featuring choline bromide (ChBr) and choline iodide (ChI) as the HBAs, were investigated. The different DESs are denoted as guaniline–X, where X is the halide of the choline salt used as the HBA. Due to the peculiar effects that water can impart on the physiochemical properties of DESs (Citation29, Citation38), electrolyte solvent systems containing 10–40 wt. % water were generated and characterized with rheologic measurements and extensive PV analyses. Additionally, in an effort to further simplify the electrolyte composition, a system in which the inorganic iodide source (i.e. KI) was omitted was also prepared to probe if the iodide present in the gualiline-I DES was of a sufficient concentration for adequate redox couple formation and, thus, efficient charge transfer between the electrodes.
Experimental
Materials and reagents
Choline chloride (C1879, approx. 99%), guanidinium thiocyanate (G9277, ≥ 99%), TiO2 paste (791547, 19.0 wt%), platinum paste (791512), tert-butyl alcohol (36053-8, 99.6%), and acetonitrile (34998, ≥ 99.9%) were purchased from Sigma-Aldrich (St. Louis, MO). Potassium iodide (P410500) was acquired from Fisher Scientific (Pittsburg, PA). The ruthenium dye sensitizer, di-tetrabutylammonium cis-bis(isothiocyanato)bis(2,2′-bipyridyl-4,4′-dicarboxylato)ruthenium(II) (N719; 003190), and iodine (I3380, approx. 99%) were procured from GreatCell Energy® (formerly Dyesol; Queanbeyan, Australia) and Honeywell, respectively. Iodolyte AN-50 (31112) was acquired from Solaronix (Aubonne, Switzerland). Choline bromide (C0328, approx. 98%) and choline iodide (C2573, approx. 98%) were procured from TCI (Portland, OR). All chemicals were used as received without further purification. Ultrapure Millipore water polished to a resistivity of 18.2 MΩ·cm was employed for all aqueous solutions and substrate rinsing.
Deep eutectic solvent and electrolyte preparation
The eutectic mixture of choline chloride and guanidinium thiocyanate, denoted as guaniline–Cl, was prepared by heating a 1:1 mol ratio mixture of the individual components at 70 °C in a scintillation vial under stirring until a clear solution was obtained (approximately 30 min). Guaniline–Br and guaniline–I, which employed choline bromide and choline iodide, respectively, were made in an identical fashion except a higher temperature (80 °C) was required to yield a liquid. As noted in our previous work (Citation34), GuSCN was chosen as the HBD as it has been shown to positively affect device performance as a co-additive in many electrolyte systems (Citation39–41). Upon natural cooling to ambient temperature, all three DESs solidified, meaning the exploration of a liquid electrolyte system featuring solely DES was not feasible. Thus, for all electrolyte systems explored, at least 10 wt. % of a co-solvent and secondary hydrogen bond donor, in this case, water, was added to obtain a liquid DES. Specifically, DES:water weight ratios of 90:10, 80:20, 70:30, and 60:40 were explored. To generate the electrolyte solutions, the solid DESs were heated to 70–80 °C to induce melting and a known mass was then combined with an appropriate volume of an aqueous stock solution of the redox couple (I–/I3– originating from KI and I2) to yield 60–90 wt. % DES, 0.5 M I–, and 0.025 M I3–, respectively. The specific masses and volumes employed to generate the various electrolytes are provided in Table S1. Additionally, a DES-free (i.e. aqueous I–/I3–) electrolyte was prepared and a commercial (i.e. Iodolyte) electrolyte was procured, for control and benchmark comparisons, respectively.
Characterization techniques
DES density measurements were conducted by carefully but quickly pipetting pre-heated (∼80 °C) liquid DES into a pre-massed 1 mL volumetric flask and the mass was recorded once 1 mL had been delivered. The melting range of guaniline–Cl, guaniline–Br, and guaniline–I were assessed using an SRS OptiMelt Automated Melting Point System. For each sample, three glass capillaries were individually filled with approximately 0.5 cm of solid DES and placed in the capillary holders of the melting point apparatus. The temperature was ramped from 25 to 100 °C at 1 °C min–1. The assessed densities and melting ranges are provided in Table S2. Viscosity measurements of all aqueous DES solutions explored in this work were acquired with a DV-III Ultra Rheometer. The desired gap between the CPE-42 cone (range: 0.2–6 K cP) and the plate was achieved by moving the plate (built into the sample cup) towards the cone until the pin in the center of the cone touched the surface of the plate, after which the plate was lowered by 12.7 μm (5.0 × 10⁻⁴ in.), and 1.00 mL of a DES sample was micropipetted into the sample cup. The cone RPM was then gradually increased by 0.5 RPM every 10–15 s until the torque percentage stabilized at a value in the range of 10–90%, at which point the viscosity measurement was recorded. The measured solution viscosities are provided in Table S4.
Dye-sensitized solar cell assembly
TEC™ 7 fluorine-doped tin oxide (FTO) coated glass was sourced from Pilkington Glass (Toledo, OH). The large glass sheets (12” x 12”) were cut down to electrode size (1” x 0.670” or ∼25 mm x 17 mm) with a laboratory glass cutting table (GC0101) procured from MSE Supplies (Tucson, AZ). The cut glass was then cleaned by sequentially sonicating the substrates for 60 min in a dilute solution of Alconox® detergent (0.5 wt%), an ethanolic solution of 0.1 M HCl, isopropanol, and acetone. After cleaning with detergent and ethanolic HCl, the glass was thoroughly rinsed with water before proceeding and after sonication in acetone the substrates were dried upright at 50–70 °C. The substrates were then placed in a 40 mM aqueous TiCl4 solution for 40 min at 70 °C (FTO side up), after which the treated substrates were rinsed with water and EtOH and dried upright at 50–70 °C. Transparent titania (TiO2) nanoparticle (20 nm) paste was applied to the FTO side of the glass via a doctor blade approach using precut vinyl masks (∼100 μm thick) to define the film area. The adhesive-backed, removable masks were cut from a 12” x 48” roll of black Cricut® Premium Vinyl™ - Removable using Cricut Explore Air™ 2 or Cricut Maker® machines with each individual mask possessing outer dimensions of 1” x 0.620” (or ∼25 mm x 15.8 mm) and a 1 cm2 (1 cm x 1 cm) centered window. After carefully removing the masks, the films were allowed to relax at room temperature in the dark for 24 h and were then dried in a muffle furnace at 125 and 200 °C for 24 and 4 h, respectively, before sintering the films at 525 °C for 1 h using a ramp rate of 1 °C min–1. After the 1 h sintering period, the furnace was shut off and allowed to cool naturally with the films inside. The films were then subjected to another TiCl4 treatment at 70 °C for 40 min and sequentially rinsed with water and ethanol followed by another sintering process in the muffle furnace where they were first dried at 100 °C for 4 h and then sintered at 525 °C for 1 h using a ramp rate of 1 °C min–1. Upon naturally cooling to ambient temperature, the films were sensitized for 24 h in the dark in a 0.5 mM solution of N719 dissolved in 1:1 v/v acetonitrile:t-butyl alcohol, after which the films were rinsed with ethanol to remove any physisorbed dye; these final electrodes are denoted as photoanodes. Device cathodes, more commonly referred to as counter electrodes, were prepared by placing a strip of Scotch™ brand tape along each long edge of a precleaned FTO-coated glass substrate (FTO side up) to generate a ‘trough’ and commercial Pt paste was applied atop the taped glass via the doctor blade technique. After carefully removing the strips of tape, the films were dried at 100 °C for 24 h and then fired at 475 °C for 1 h in a muffle furnace. To assemble a device, a DuPont™ Surlyn® 25 μm spacer (Meltonix 1170-25; sourced from Solaronix, Aubonne, Switzerland) with a precut window (∼1.5–2.5 cm2) was placed around the sensitized TiO2 film and an aliquot of electrolyte solution was carefully dropped atop the film with a needleless plastic syringe until the ‘well’ generated by the spacer was filled. A counter electrode was then carefully but firmly pressed on top of the electrolyte coated photoanode and the device was clamped together with 1” binder clips on each side to keep the device sealed throughout the duration of the photovoltaic measurements. The external areas of the devices were carefully wiped down with an EtOH-soaked Kimwipe™ to remove all residual electrolyte and potential light scattering contaminants.
Photovoltaic device measurements
Solar irradiation (1 sun or 100 mW cm–2) was simulated with a Newport® Oriel® LCS-100™ solar simulator (94011A-ES) equipped with a Newport® AM1.5G air mass filter (81088A-LCS) and calibrated with a certified Newport® Oriel® silicon reference cell and meter (91150 V). Current–voltage data were collected with a Keithley 2400 SourceMeter™ and Oriel® I-V Test Station software under reverse bias from 0.75 to –0.20 V at 0.08 V s–1 with a 0.5 s presweep delay and 30 ms dwell time per voltage increment. At least five devices were characterized per electrolyte with the PV metrics summarized in Table S3. Monochromatic light for external quantum efficiency (EQE) measurements was generated with a 300 W Xe arc lamp whose collimated irradiation was directed through 280 or 550 nm longpass filters prior to wavelength selection with a Newport® CS 130 dual grating monochromator using only ‘grating 2” (blaze: 500, grating lines: 1200). The power density at each wavelength (i.e. 300–800 nm every 10 nm) was measured with a Newport® power meter (1936-R) equipped with a UV silicon detector (918D-UV-OD3R). For the collection of the power density readings, the monochromator and power meter were simultaneously controlled with Newport’s TracQ™ Basic software. The wavelength-dependent JSC values were measured with the Keithley 2400 SourceMeter™ controlled by the Oriel® I-V Test Station software collecting 15 JSC values at each wavelength while holding the voltage at 0 V with a 0.5 s premeasurement delay and 1 s dwell time per data point. The collected JSC values for each wavelength were averaged and the resulting photocurrent was used in the equation shown below to calculate the EQE at each tested wavelength (λx), where Pin is the measured power density at each of these wavelengths.
Note, for the majority of the systems explored, the JSC values calculated from the entire EQE spectra were within 20% of the measured JSC values, which, according to Zimmermann et al., (Citation42) represent reasonable correlations. However, the electrolyte systems with the highest DES content (i.e. 90 wt.%) often displayed larger deviations (>>20%) between the measured and calculated JSC value, discrepancies that are tentatively attributed to a combination of the higher solution viscosities and low light intensities present in single wavelength illumination. Explorations into the exact origins of these deviations are currently underway. Despite these discrepancies though, the trends observed in the EQE spectra, and, thus, the calculated JSC values, were consistent with those trends observed for the measured JSC values.
For the chronoamperometry studies, devices were characterized with three illuminated/dark cycles where each cycle consisted of ∼30 s of illumination followed by 20 s in dark conditions. During these illuminated/dark cycles, current–voltage data was collected with the Keithley 2400 SourceMeter™ and Oriel® I-V Test Station software. The voltage was held at 0.0 V and after a 0.5 s precollection delay, 500 short-circuit current data points were collected across the entire three-cycle period at a 50 ms dwell time per point. Short-time approximations of Cottrell’s law were assessed by plotting the photocurrent decay against time–0.5 and performing a regression analysis on the linear portion to determine the apparent I3– diffusion coefficients. In addition to chronoamperometry measurements, the temporal effects on electrolyte diffusion and penetration into the mesoporous photoanode were also assessed by performing a reverse-biased J-V sweep at 0, 2, 4, 8, and 16 h after filling and sealing the device. The scan parameters for these studies were identical to those described above. Note, for all photovoltaic measurements, the entire 1 cm2 TiO2 film was illuminated (i.e. photomasks were not employed).
Results and discussion
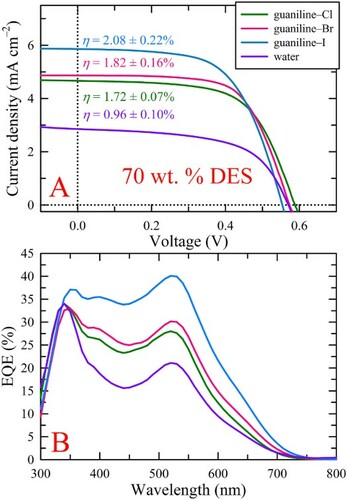
To better understand how DES constituents, in this case, the choline (Ch) counterion, affect PV performance, ChCl in the previously reported, novel DES, guaniline-Cl, (Citation34) was substituted with ChBr or ChI to yield guaniline-Br or guaniline-I versions. The three DESs were characterized with density and melting range measurements, the results of which are provided in Table S2. Both the densities and melting point ranges of the DESs increased in the following order, guaniline–Cl < guaniline–Br < guaniline–I, which is attributed to the increasing atomic mass and decreasing hydrogen bonding capabilities. Pared-down electrolytes were then formulated with only DES (60–90 wt. %), water (10–40 wt. %), and redox couple (i.e. I–/I3–) to further explore how DES and water content influence PV device performance. In line with our previous work, (Citation34) the highest average device performances for the DES systems explored herein were generally obtained for electrolyte compositions containing 30 wt. % water. Although, employing 80 wt. % guaniline–I (i.e. 20 wt. % water) yielded comparable performance to the electrolyte containing 30 wt. % water. A displays the average current density–voltage (J-V) sweeps for devices employing the 70 wt. % DES-based electrolytes. At this DES wt. %, all three DES-based electrolyte systems vastly outperformed the aqueous control. Specifically, when compared to the aqueous control, employing guaniline–Cl at 70 wt. % DES resulted in a slight increase in the average open-circuit voltage (VOC) and fill factor (FF) from 0.571 ± 0.012 to 0.589 ± 0.005 V and 58.70 ± 0.33 to 64.37 ± 0.94%, respectively, while also producing a marked increase in short-circuit current density (JSC) from 2.86 ± 0.32 to 4.32 ± 0.39 mA cm−2, all of which led to an improvement in η from 0.96 ± 0.10 to 1.63 ± 0.18%. Guaniline–Br produced similar trends in photovoltaic metric enhancement over the control, presenting with average JSC, VOC, and FF of 4.87 ± 0.47 mA cm−2, 0.574 ± 0.004 V, and 65.31 ± 1.10%, respectively, yielding an η of 1.82 ± 0.16%. Interestingly, incorporation of 70 wt. % guaniline–I into the aqueous electrolyte composition produced a substantial jump in device performance relative to the Cl and Br counterparts. Although greater than 0.03 V and 2.5% drops in average VOC and FF were observed for guaniline–I, the noteworthy increase in average JSC by 1.5–2 mA cm–2 to 6.32 ± 1.17 mA cm−2, resulted in the highest efficiency (η = 2.08 ± 0.22%) obtained for all systems studied. Since the concentration of inorganic iodide (i.e. KI) used in this work was based on our previous work, as well as average reported literature values, and is, therefore, not optimized, it is likely that the increased iodide content when employing guaniline–I, from 0.50 M to 3.11 M, results in more efficient charge transfer across the electrodes, thus leading to faster dye regeneration and higher photocurrent collection. Additionally, the increase in the concentration of I– possibly shifted the redox potential of the I–/I3– redox couple per the Nernst equation, (Citation43) although, an increase in iodide concentration with a static triiodide concentration would lead to slight increases in VOC. Since this marked increase in iodide concentration should lead to a more complete conversion of I2 to I3– per Le Chatelier’s principle, the increase in I3– concentration relative to the (negligible) decrease in I– concentration could lead to minor decreases in VOC per the steady-state open-circuit voltage expression (Citation43). However, as the VOC decreases monotonically with anionic radii, the drastic difference in iodide concentration is likely playing a trivial role in the observed photovoltage, while the DES properties (e.g. extent of hydrogen bonding) and varying surface effects on TiO2 may be the driving force for the decreasing VOC. The average performance metrics for all device sets tested are provided in Table S3.
Figure 1. (A) Average illuminated J-V curves for the different halide-containing guaniline DES systems at 70 wt. % DES. Although the VOC decreased from Cl to I, the JSC showed the opposite trend. In fact, the JSC for guaniline–I was almost 2 mA cm–2 higher than that for the Cl and Br versions, yielding a marked increase in average efficiency. (B) Average EQE for the 70 wt. % DES systems. The trends in EQE closely track with those observed for JSC. Note, the results for an aqueous control, containing only water and the redox couple, are included for comparison.

To better understand the origin of the observed photocurrent, external quantum efficiency (EQE) measurements were conducted on the devices employing the 70 wt. % DES electrolytes. The trends observed in the EQE spectra correlate extremely well with the trends seen in JSC. The spectra contain a prominent peak centered between 340 and 350 nm, a weak shoulder/peak centered near 400-410 nm, and a broad peak at 520 nm, where the former is attributed to the mesoporous TiO2 film while the latter two arise from the employed sensitizer (i.e. N719). Interestingly, both guaniline–Br and guaniline–I bathochromically shifted the EQE maximum of TiO2 by 10 nm, implying that these DES electrolytes modified the surface chemistry of TiO2, leading to a slight change in bandgap. Additionally, guaniline–I improved the photon-to-electron conversion by TiO2, increasing the EQE from 34.0–37.5%, relative to the control. Therefore, not only does guaniline–I yield a marked improvement in photocurrent production by the sensitizer, but it also positively impacts TiO2.
Similar trends in performance metrics were also observed for the other DES wt. % tested. Specifically, for both 60 and 80 wt. % DES, the photocurrent increased in the following order, guaniline–Cl < guaniline–Br < guaniline–I, as shown in panels A and B of Figure S1, as well as Table S3. Similar to the photocurrent trends for 70 wt. %, guaniline–Cl and guaniline–Br yielded relatively comparable photocurrents to one another whereas guaniline–I produced a marked improvement in JSC (typically > 1 mA cm–2) over the Cl and Br versions at both 60 and 80 wt. %. Given the moderately consistent FFs (∼60-65%) and the comparable VOC values, except for guaniline–I, which again presented with decreased photovoltages, the observed trends in device efficiency were mostly dictated by the photocurrent, thus, for both 60 and 80 wt. %, the efficiency increased in the same order as JSC. Although we have already mentioned that guaniline–I yielded the highest performance among the 70 wt. % DESs, we note that the average JSC and efficiency for 80 wt. % gualiline-I are slightly higher, however, the increase is not statistically significant. Similar to the 70 wt. % DES electrolytes, the trends in EQE for 60 and 80 wt. % correlated well with their respective trends in JSC and each individual electrolyte system displayed similar spectral features to those observed at 70 wt. % (Figure S1C and D). Note, J-V and EQE data for devices using a propriety, commercial I–/I3– electrolyte blend (i.e. Iodolyte) are provided in Figure S1 as an in-house benchmark. Conversely, when the DES content in the electrolyte was increased to 90 wt. %, the photocurrent and efficiency for guaniline–Br dropped below the values obtained for guaniline–Cl while guaniline–I remained the top performing electrolyte system despite an even further decrease in VOC to 0.484 ± 0.012 V (Table S3), presumably due the even higher I– concentration. Note, the J-V and EQE data for the 90 wt. % DES electrolytes are provided in as part of a subsequent discussion.
The aforementioned trends between the different electrolyte systems and weight percentages are better visualized in , which summarizes the performance metrics, specifically, JSC, η, FF, and VOC, as a function of DES wt. %. To better understand the observed trends, namely, those seen for photocurrent, which predominantly dictates the efficiency achieved, rheological measurements were conducted on DES:water solutions (i.e. with no redox couple) at the four different DES percentages to assess solution viscosity and gain insight into charge carrier diffusion. The obtained viscosity values are provided in Table S4 and plotted as a function of DES wt. % in E for correlation to the performance metrics. As the DES content increased, solution viscosity increased at almost the same rate for all DES electrolyte systems studied, however, the viscosities of the guaniline–Cl solutions were always higher than guaniline–Br, which, in turn, were always higher than guaniline–I. This trend of decreasing viscosity from guaniline-Cl to guaniline-I undoubtedly arises from the degree of intermolecular interactions that these halides participate in with the HBD. That is, the extent of hydrogen bonding decreases as Br is substituted for Cl and I is substituted for Br which makes the DES microenvironment less confining and rigid (i.e. increased ion/molecular mobility), thereby decreasing viscosity. In general, the trends in solution viscosity correlate well with the trends observed for the photocurrent and, thus, efficiency. That is, as viscosity increases, photocurrent and efficiency decrease, likely due to hindered charge transport. As anticipated, based on our previous observations, (Citation34) the most rapid increase in viscosity occurred upon increasing the DES content from 80 to 90 wt. %, which led to a substantial decrease in photocurrent, and thus, efficiency, except for guaniline–Cl, whose values remained relatively static. The origin of this plateau behavior is currently unclear as 90 wt. % guaniline–Cl has the highest viscosity of all solutions tested. Additionally, a substantial lowering of VOC was observed upon increasing the DES content from 80 to 90 wt. %, which is consistent with our previous observations, (Citation34) and likely stems from the increased concentration of GuSCN within the DES. While all three systems produced higher photocurrent and efficiency upon increasing the DES content from 60 to 70 wt. %, only guaniline–I showed an increase in performance, albeit marginal, upon increasing the DES content to 80 wt. %, despite a near doubling in solution viscosity (from 2.58 to 4.50 cP), an observation that may result from the increased, and tentatively more optimized, iodide concentration. Thus, in general, 70 wt. % DES appears to provide an optimal balance of desirable solution viscosity (and thus sufficient charge transport), alongside adequately-low water content so as not to induce deleterious effects evident at 60 wt. % DES.
Figure 2. (A)-(D) Device metrics as a function of DES wt. %. In all instances, employing 70 wt. % DES resulted in the highest photocurrent and efficiency while increasing to 90 wt. % produced substantial drops in VOC, JSC, and η (except for guaniline–Cl), as well anomalously high FFs. At 60 wt. % DES, the high water content likely caused deleterious effects to device components. (E) Solution viscosity as a function of DES wt. %. The results clearly show that solution viscosity directly affects the photovoltaic device metrics, namely, JSC, FF, and η, due to increasing diffusion limitations hindering charge carrier transport as the DES content increases. The PV metrics and solution viscosity of an aqueous control are included for comparison.
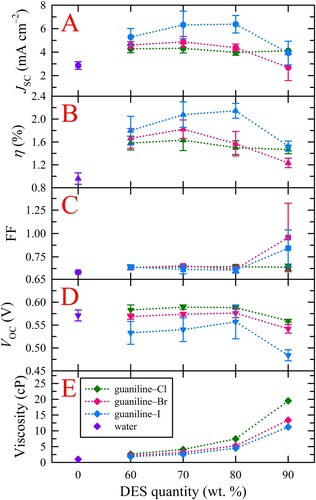
As shown in C, unconventionally high device FFs arose when employing 90 wt. % DES electrolytes. This observed phenomenon was discussed in our previous work (Citation34) but, briefly, it originates from conducting reverse-biased voltage sweeps on devices employing highly viscous electrolytes that likely suffer from diffusion-limited current and thus produce an anomalous hump in the J-V curve near the maximum power point (A). This diffusion limitation results in a current density value at the maximum device power (JMP) that is significantly higher than JSC, an occurrence typically not observed in well-behaved devices. As FF is equivalent to the ratio of the product of JMP and VMP to the product of JSC and VOC, devices with diffusion-limited JSC can result in uncharacteristically high or even theoretically-implausible FFs (i.e. greater than 100%). Surprisingly, the degree to which the photocurrent is limited by diffusion appears to increase with decreasing hydrogen bonding ability (A), evidenced by the increasing ‘hump’ size in the J-V curves for guaniline–Cl, guaniline–Br, and guaniline–I, which is at odds with the trends in solution viscosity; the origins of this observation are still under investigation.
Given the viscous nature of these electrolytes, despite having appreciable water content, as well as our previous results showing that highly viscous DES electrolyte systems require substantial time (> 4 h) to thoroughly penetrate the TiO2 mesopores, (Citation34) devices employing the 90 wt. % electrolyte solutions were characterized with J-V measurements 0, 2, 4, 8, and 16 h after filling. A representative plot of these results, specifically those for 90 wt. % guaniline–I, is provided in Figure S2A, while the extracted device metrics for all three electrolyte systems are shown in panels B-E of the same figure. Oddly, 90 wt. % guaniline–I was the only system to exhibit apparent poor penetrability of the electrolyte into the TiO2 mesopores, evidenced by the substantial increase in JSC over time (from 3 mA cm–2 to nearly 6 mA cm–2 over 16 h after filling), despite this system possessing the lowest viscosity of the three 90 wt. % electrolytes. Although both 90 wt. % guaniline–I and –Br displayed small humps in their J-V curves at 0, 2, and 4 h after filling (due to diffusion limitations), neither system produced anomalously high FFs since the photocurrent steadily rose as the applied voltage decreased from 0.4 to −0.1 V, which led to a higher JSC than JMP, as is typically expected. Thus, 90 wt. % guaniline–Cl was the only DES electrolyte system to produce FFs over 100% 16 h after filling due to its substantially higher solution viscosity, although the FF decreased from 160% to 120% over this time period, indicating an improvement in the apparent diffusion limitation, presumably due to better penetration into the photoanode titania mesopores.
To further confirm that these electrolytes cause diffusion-limitation photocurrent, chronoamperometric measurements were conducted on all electrolyte systems to arrive at the apparent I3– diffusion coefficient, as described in the Experimental section. A representative three-cycle chronoamperogram for 90 wt. % guaniline–Br and its corresponding current decay fittings are provided in Figure S3, while the assessed apparent I3– diffusion coefficients for all DES electrolytes explored are summarized in and Table S5. Although all DES weight percentages showed a temporal decrease in photocurrent, the decay was more pronounced as DES content increased due to higher electrolyte viscosity, however, no clear trends emerged in I3– diffusion coefficient as a function of DES wt. %. Additionally, guaniline–I and guaniline–Br produced smaller relative photocurrent decays within a single cycle compared to guaniline–Cl. Such observations and trends are on par with the viscosity measurements as both guaniline–I and guaniline–Br are less viscous than guaniline–Cl, irrespective of DES wt. %.
Figure 3. (A-C) Extracted I3– diffusion coefficients for all studied weight ratios of guaniline–I, guaniline–Br, and guaniline–Cl, respectively. The trends observed are consistent with those seen for solution viscosity. Guaniline–Br shows the most variable data.

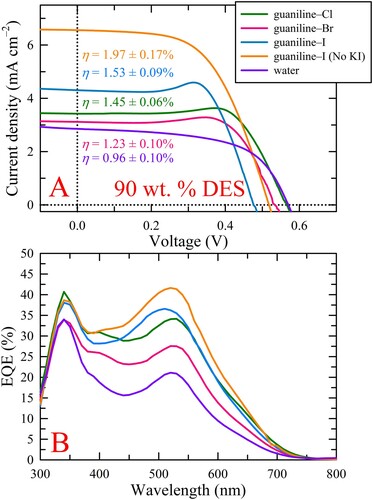
Lastly, as higher iodine concentrations are typically required for more efficient device operation when employing viscous electrolyte solutions, designing DESs with the redox couple "built-in" is attractive since markedly higher concentrations can be achieved compared to conventional aqueous or organic solvation, therefore, the effect of foregoing the inorganic iodide (e.g. KI) addition to the ChI electrolytes was explored to ascertain whether the self-contained iodide content was adequate for redox couple formation and device operation. For example, at 90 wt. %, the iodide concentration for guaniline–I with KI added is 6.40 M, whereas for guaniline–I without KI (denoted ‘no KI’) it is still 5.14 M, which should introduce ample iodide for redox couple formation. Surprisingly, not only was the iodide content within 90 wt. % guaniline–I sufficient for redox couple formation and successful device operation, foregoing KI addition actually led to markedly higher average performance over the corresponding DES containing KI (as well as the chloride and bromide versions), as shown in A and Table S3. Specifically, the average photocurrent increased by more than 2.5 mA cm–2, from 3.92 ± 1.01 to 6.55 ± 0.46 mA cm–2, which led to an increase in efficiency from 1.53 ± 0.09 to 1.97 ± 0.17% since the photovoltages were relatively consistent. That is, the VOC for guaniline–I without KI was only ∼0.04 V higher (0.484 ± 0.012 vs. 0.520 ± 0.045 V) which is likely due to the decreased iodide content affecting the redox potential. These results directly conflict with previous conclusions that inorganic iodide sources yield higher performance than organic iodides (Citation23). Even more interesting is that 90 wt. % guaniline–I absent KI produces a higher photocurrent than 60 wt. % guaniline–I containing KI by nearly 1 mA cm–2 (6.55 ± 0.46 vs. 5.28 ± 0.73 mA cm–2) despite a large 6-fold difference in solution viscosity (11.2 cP vs. 1.83 cP), resulting in a higher efficiency (1.97 ± 0.17 vs. 1.80 ± 0.25%), even though the former presents slightly lower VOC and FF values. Additionally, the average photocurrent for 90 wt. % guaniline–I without KI was also slightly higher than the values obtained for the 70 and 80 wt. % guaniline–I electrolytes containing KI, although the marginally lower photovoltage and FF led to nearly comparable efficiencies. Furthermore, foregoing the KI addition to 90 wt. % guaniline–I resulted in the disappearance of the anomalous hump, which led to a more reasonable FF (84.23 ± 19.59% vs. 58.15 ± 1.36%), implying that this electrolyte system does not suffer from the same diffusion-limited photocurrent that the electrolytes containing KI apparently do. Additionally, the results suggest that KI may be detrimental to device performance and may not be the best inorganic iodide source for such DES-based electrolytes. That said, given the above results, we postulate that increasing the iodide (and possibly I2) concentration in the guaniline–Cl and guaniline–Br compositions may result in an increase in device performance for these systems, although such optimization studies have yet to be conducted for DES-based electrolytes. However, fully dissolving very high concentrations of iodide in water (or possibly DESs) presents challenges due to solubility limits, which might be circumvented by direct incorporation of the iodide into the DES, as illustrated by the current results. Lastly, guaniline–I electrolytes without KI were also tested at 70 and 80 wt. % to see if the above trends hold. A head-to-head comparison of the average J-V curves obtained for the 70, 80, and 90 wt. % guaniline–I electrolytes with and without KI is shown in Figure S4 with the metrics provided in Table S3. In this case, despite having slightly lower average VOC and FF, the 70 and 80 wt. % electrolytes containing additional KI outperform their KI-free guaniline-I counterpart due to substantially higher average photocurrent that undoubtedly arises from a more optimal iodide concentration leading to improved charge transport and cycling.
Figure 4. (A) Average J-V curves for illuminated devices employing all 90 wt. % DES electrolyte systems studied as well as guaniline–I without KI addition, denoted as guaniline–I (no KI). The results clearly indicate that inorganic iodide salt addition is not necessary for sufficient redox couple formation within DES systems that have a self-contained iodide source, evidenced by the disappearance of diffusion limitation (i.e. no "hump") and improved device metrics. (B) Average EQE for the 90 wt. % DES electrolytes. The trends observed in EQE track closely with those seen for JSC.
Conclusions
In conclusion, by utilizing pared-down DES-based electrolytes composed solely of a redox couple, DES, and minimal water content, we can deconvolute the complexity typically seen in DES electrolyte systems to better understand the exact roles that the DES and its components play in device performance. Specifically, as the halide affinity for hydrogen bonding decreases, the viscosity decreases in parallel, which is a major contributing factor to the observed device metrics, particularly, the impressive performance by guaniline–I. For both guaniline–Cl and guaniline–Br, device performance apexed at 70 wt. % DES, with guaniline–Br surpassing guaniline–Cl at all explored DES contents except 90 wt. %. Notably, the maximum performance for guaniline–I was achieved at 80 wt. % DES, with device efficiencies far surpassing the other two 80 wt. % DES systems studied. Additionally, even at 90 wt. %, guaniline–I produced the highest efficiency, despite a lower VOC and FF, due to an offsetting advantage in higher photocurrent, implying that future DES electrolyte work might focus on iodide-containing HBAs. Most importantly, further paring down the electrolyte by exploiting the iodide within ChI as the source for redox couple formation drastically boosted the performance of the 90 wt. % DES, increasing efficiency from 1.53 to 1.97%, while also seemingly ridding the electrolyte system of the diffusion-limited photocurrent normally seen with high DES wt. % electrolytes. Looking forward, as higher iodide concentrations are typically required for more efficient device operation when employing viscous electrolyte solutions, (Citation44) designing task-specific DESs with the redox couple built-in will be advantageous since markedly higher concentrations can be achieved than in normal aqueous or organic solution, which should lead to higher efficiencies. Thus, we advocate that future research should focus on developing novel DES chemistries that incorporate the majority (or all) of the electrolyte components into the DES formulation (e.g. redox couple, additives) whilst retaining ideal solvent characteristics such as room temperature fluidity and low viscosity (∼20 cP or lower). Notably, smaller HBA cations (e.g. shorter substituents) are reported to decrease viscosity (Citation45). Synthesizing DES electrolytes formulated with small HBDs such as betaine, (Citation30, Citation46) tetramethyl ammonium, or formocholine, as well as chemical derivatives of these paired with known performance-enhancing additives (e.g. GuSCN, 4-guanidinobutyric acid, alkylaminopyridines) (Citation5) may represent a promising path forward for high fluidity, co-solvent-free DES electrolytes.
Associated content
Supporting information
J-V and EQE results for 60 and 80 wt. % DES electrolytes, time-dependent J-V curves and extracted PV metrics for 90 wt. % DES electrolytes, 90 wt. % guaniline–Br (representative) chronoamperometric data, tabulated PV metrics, and solution viscosities.
Supplemental Material
Download MS Word (16.8 MB)Acknowledgments
The authors would like to acknowledge the University of Missouri for supporting this work through the Mizzou Advantage funding program.
Disclosure statement
No potential conflict of interest was reported by the author(s).
References
- Sharma, K.; Sharma, V.; Sharma, S.S. Dye-Sensitized Solar Cells: Fundamentals and Current Status. Nanoscale Res. Lett. 2018, 13, 381.
- Tomar, N.; Agrawal, A.; Dhaka, V.S.; Surolia, P.K. Ruthenium Complexes Based dye Sensitized Solar Cells: Fundamentals and Research Trends. Sol. Energy 2020, 207, 59–76.
- National Renewable Energy Laboratory (NREL), Best Research-Cell Efficiencies. https://www.nrel.gov/pv/cell-efficiency.html (accessed December 16, 2021).
- Iftikhar, H.; Sonai, G.G.; Hashmi, S.G.; Nogueira, A.F.; Lund, P.D. Progress on Electrolytes Development in Dye-Sensitized Solar Cells. Materials. (Basel) 2019, 12, 1998.
- Wu, J.; Lan, Z.; Lin, J.; Huang, M.; Huang, Y.; Fan, L.; Luo, G. Electrolytes in Dye-Sensitized Solar Cells. Chem. Rev. 2015, 115, 2136–2173.
- Wu, J.; Lan, Z.; Hao, S.; Li, P.; Lin, J.; Huang, M.; Fang, L.; Huang, Y. Progress on the Electrolytes for Dye-Sensitized Solar Cells. Pure Appl. Chem. 2008, 80, 2241–2258.
- Bella, F.; Gerbaldi, C.; Barolo, C.; Grätzel, M. Aqueous Dye-Sensitized Solar Cells. Chem. Soc. Rev. 2015, 44, 3431–3473.
- Gorlov, M.; Kloo, L. Ionic Liquid Electrolytes for Dye-Sensitized Solar Cells. Dalton Trans. 2008, 20, 2655–2666.
- Abu Talip, R.A.; Yahya, W.Z.N.; Bustam, M.A. Ionic Liquids Roles and Perspectives in Electrolyte for Dye-Sensitized Solar Cells. Sustainability 2020, 12, 7598.
- Mahmood, A. Recent Research Progress on Quasi-Solid-State Electrolytes for Dye-Sensitized Solar Cells. Journal of Energy Chemistry 2015, 24, 686–692.
- Bai, Y.; Cao, Y.M.; Zhang, J.; Wang, M.; Li, R.Z.; Wang, P.; Zakeeruddin, S.M.; Gratzel, M. High-Performance Dye-Sensitized Solar Cells Based on Solvent-Free Electrolytes Produced from Eutectic Melts. Nat. Mater. 2008, 7, 626–630.
- Pengfei, S.; Bingkun, P.; Jie, Z.; Yun, W.; Fayun, Z.; Senlin, R.; Guifu, Z. Multi-Component Eutectic Salts to Enhance the Conductivity of Solvent-Free Ionic Liquid Electrolytes for Dye-Sensitized Solar Cells. Electrochim. Acta 2019, 314, 219–226.
- Wagle, D.V.; Zhao, H.; Baker, G.A. Deep Eutectic Solvents: Sustainable Media for Nanoscale and Functional Materials. Acc. Chem. Res. 2014, 47, 2299–2308.
- Abbott, A.P.; Edler, K.J.; Page, A.J. Deep Eutectic Solvents—the Vital Link Between Ionic Liquids and Ionic Solutions. J. Chem. Phys. 2021, 155, 150401.
- Hansen, B.B.; Spittle, S.; Chen, B.; Poe, D.; Zhang, Y.; Klein, J.M.; Horton, A.; Adhikari, L.; Zelovich, T.; Doherty, B.W.; Gurkan, B. Deep Eutectic Solvents: A Review of Fundamentals and Applications. Chem. Rev. 2021, 121, 1232–1285.
- Kist, J.A.; Zhao, H.; Mitchell-Koch, K.R.; Baker, G.A. The Study and Application of Biomolecules in Deep Eutectic Solvents. J. Mater. Chem. B 2021, 9, 536–566.
- Kist, J.A.; Henzl, M.T.; Bañuelos, J.L.; Baker, G.A. Calorimetric Evaluation of the Operational Thermal Stability of Ribonuclease a in Hydrated Deep Eutectic Solvents. ACS. Sustain. Chem. Eng. 2019, 7, 12682–12687.
- Adhikari, L.; Larm, N.E.; Baker, G.A. Batch and Flow Nanomanufacturing of Large Quantities of Colloidal Silver and Gold Nanocrystals Using Deep Eutectic Solvents. ACS. Sustain. Chem. Eng. 2020, 8, 14679–14689.
- Adhikari, L.; Larm, N.E.; Baker, G.A. Argentous Deep Eutectic Solvent Approach for Scaling up the Production of Colloidal Silver Nanocrystals. ACS. Sustain. Chem. Eng. 2019, 7, 11036–11043.
- Cruz, H.; Jordão, N.; Branco, L.C. Deep Eutectic Solvents (Dess) as Low-Cost and Green Electrolytes for Electrochromic Devices. Green Chem. 2017, 19, 1653–1658.
- Cruz, H.; Jordão, N.; Amorim, P.; Dionísio, M.; Branco, L.C. Deep Eutectic Solvents as Suitable Electrolytes for Electrochromic Devices. ACS. Sustain. Chem. Eng. 2018, 6, 2240–2249.
- Gao, J.; Yan, J.-Y.; Guo, X.-Y.; Yang, Y.; Lin, Z.-H.; Zhang, Z. Deep Eutectic Solvent Based Polymer Electrolyte for Dye-Sensitized Solar Cells. Int. J. Inorg. Mater 2017, 32, 25–32.
- Heydari Dokoohaki, M.; Mohammadpour, F.; Zolghadr, A.R. Dye-Sensitized Solar Cells Based on Deep Eutectic Solvent Electrolytes: Insights from Experiment and Simulation. J. Phys. Chem. C 2021, 125, 15155–15165.
- Nguyen, D.; Van Huynh, T.; Nguyen, V.S.; Doan Cao, P.-L.; Nguyen, H.T.; Wei, T.-C.; Tran, P.H.; Nguyen, P.T. Choline Chloride-Based Deep Eutectic Solvents as Effective Electrolytes for Dye-Sensitized Solar Cells. RSC Adv. 2021, 11, 21560–21566.
- Jhong, H.-R.; Wong, D.S.-H.; Wan, C.-C.; Wang, Y.-Y.; Wei, T.-C. A Novel Deep Eutectic Solvent-Based Ionic Liquid Used as Electrolyte for Dye-Sensitized Solar Cells. Electrochem. Commun. 2009, 11, 209–211.
- Nguyen, P.T.; Nguyen, T.-D.T.; Nguyen, V.S.; Dang, D.T.-X.; Le, H.M.; Wei, T.-C.; Tran, P.H. Application of Deep Eutectic Solvent from Phenol and Choline Chloride in Electrolyte to Improve Stability Performance in Dye-Sensitized Solar Cells. J. Mol. Liq. 2019, 277, 157–162.
- Boldrini, C.L.; Manfredi, N.; Perna, F.M.; Trifiletti, V.; Capriati, V.; Abbotto, A. Dye-Sensitized Solar Cells That Use an Aqueous Choline Chloride-Based Deep Eutectic Solvent as Effective Electrolyte Solution. Energy Technol. 2017, 5, 345–353.
- Nguyen, T.-D.T.; Nguyen, P.T.; Tran, P.H. Dye-Sensitized Solar Cells Using Deep Eutectic Solvents Mixed with Ethanol as an Effective Electrolyte Medium. Sci. Techno. Dev. J. 2018, 21, 15–23.
- Ma, C.; Laaksonen, A.; Liu, C.; Lu, X.; Ji, X. The Peculiar Effect of Water on Ionic Liquids and Deep Eutectic Solvents. Chem. Soc. Rev. 2018, 47, 8685–8720.
- Abranches, D.O.; Silva, L.P.; Martins, M.A.R.; Coutinho, J.A.P. Differences on the Impact of Water on the Deep Eutectic Solvents Betaine/Urea and Choline/Urea. J. Chem. Phys. 2021, 155, 034501.
- Hammond, O.S.; Bowron, D.T.; Edler, K.J. The Effect of Water Upon Deep Eutectic Solvent Nanostructure: An Unusual Transition from Ionic Mixture to Aqueous Solution. Angew. Chem., Int. Ed. 2017, 56, 9782–9785.
- Boldrini, C.L.; Manfredi, N.; Perna, F.M.; Capriati, V.; Abbotto, A. Designing Eco-Sustainable Dye-Sensitized Solar Cells by the Use of a Menthol-Based Hydrophobic Eutectic Solvent as an Effective Electrolyte Medium. Chem. A Eur. J. 2018, 24, 17656–17659.
- Boldrini, C.L.; Manfredi, N.; Perna, F.M.; Capriati, V.; Abbotto, A. Eco-Friendly Sugar-Based Natural Deep Eutectic Solvents as Effective Electrolyte Solutions for Dye-Sensitized Solar Cells. Chem. Electro. Chem 2020, 7, 1707–1712.
- Boogaart, D.J.; Essner, J.B.; Baker, G.A. Evaluation of Canonical Choline Chloride Based Deep Eutectic Solvents as Dye-Sensitized Solar Cell Electrolytes. J. Chem. Phys. 2021, 155, 061102.
- Wagle, D.V.; Baker, G.A.; Mamontov, E. Probing the Ultrafast Energy Dissipation Mechanism of the Sunscreen Oxybenzone After UVA Irradiation. J. Phys. Chem. Lett. 2015, 6, 1363–1368.
- Wagle, D.V.; Deakyne, C.A.; Baker, G.A. Quantum Chemical Insight Into the Interactions and Thermodynamics Present in Choline Chloride Based Deep Eutectic Solvents. J. Phys. Chem. B 2016, 120, 6739–6746.
- Carriazo, D.; Serrano, M.C.; Gutiérrez, M.C.; Ferrer, M.L.; del Monte, F. Deep-eutectic Solvents Playing Multiple Roles in the Synthesis of Polymers and Related Materials. Chem. Soc. Rev. 2012, 41, 4996–5014.
- Kuddushi, M.; Nangala, G.S.; Rajput, S.; Ijardar, S.P.; Malek, N.I. Understanding the Peculiar Effect of Water on the Physicochemical Properties of Choline Chloride Based Deep Eutectic Solvents Theoretically and Experimentally. J. Mol. Liq. 2019, 278, 607–615.
- Zhang, C.; Huang, Y.; Huo, Z.; Chen, S.; Dai, S. Photoelectrochemical Effects of Guanidinium Thiocyanate on Dye-Sensitized Solar Cell Performance and Stability. J. Phys. Chem. C 2009, 113, 21779–21783.
- Stergiopoulos, T.; Rozi, E.; Karagianni, C.-S.; Falaras, P. Influence of Electrolyte Co-Additives on the Performance of Dye-Sensitized Solar Cells. Nanoscale Res. Lett. 2011, 6, 307.
- Kopidakis, N.; Neale, N.R.; Frank, A.J. Effect of an Adsorbent on Recombination and Band-Edge Movement in Dye-Sensitized TiO2 Solar Cells: Evidence for Surface Passivation. J. Phys. Chem. B 2006, 110, 12485–12489.
- Zimmermann, E.; Ehrenreich, P.; Pfadler, T.; Dorman, J.A.; Weickert, J.; Schmidt-Mende, L. Erroneous Efficiency Reports Harm Organic Solar Cell Research. Nat. Photonics 2014, 8, 669–672.
- Boschloo, G.; Hagfeldt, A. Characteristics of the Iodide/Triiodide Redox Mediator in Dye-Sensitized Solar Cells. Acc. Chem. Res. 2009, 42, 1819–1826.
- Wang, P.; Wenger, B.; Humphry-Baker, R.; Moser, J.-E.; Teuscher, J.; Kantlehner, W.; Mezger, J.; Stoyanov, E.V.; Zakeeruddin, S.M.; Grätzel, M. Rationale for Kinetic Heterogeneity of Ultrafast Light-Induced Electron Transfer from Ru(II) Complex Sensitizers to Nanocrystalline TiO2. J. Am. Chem. Soc. 2005, 127, 12150–12151.
- Nowosielski, B.; Jamrógiewicz, M.; Łuczak, J.; Śmiechowski, M.; Warmińska, D. Experimental and Predicted Physicochemical Properties of Monopropanolamine-Based Deep Eutectic Solvents. J. Mol. Liq. 2020, 309, 113110.
- Abranches, D.O.; Silva, L.P.; Martins, M.A.R.; Pinho, S.P.; Coutinho, J.A.P. Understanding the Formation of Deep Eutectic Solvents: Betaine as a Universal Hydrogen Bond Acceptor. Chem. Sus. Chem. 2020, 13, 4916–4921.