
ABSTRACT
Environmental pollution is a global issue, and the contamination of water by dyes is a matter of concern. This work reports an environmentally friendly method for degrading methyl orange dye using iron nanoparticles (INPs) synthesized from pasteurized cow and goat milk and ferric chloride (FeCl3). INPs were synthesized using FeCl3 and milk mixed in a 1:2 (v/v) ratio and subsequently heated at 70 0C. The formation of INPs was monitored by visualizing the color changes. The synthesized NPs were characterized by FTIR, SEM, EDS, TEM, XRD, and XPS. The XRD results showed that INPs were formed and had an amorphous structure. TEM data showed smaller semi-spherical particles with sizes of 8-27 nm, and they were present in an aggregated state. Dye degradation studies were conducted using INP with UV light exposure and H2O2 addition. Both the processes were monitored using UV/Vis scans at different time intervals. The results showed that the degradation of methyl orange was faster in the presence of H2O2 (over 85% efficiency in 60 min) than in the presence of UV light. The current study shows that the INPs formed using milk have the potential to be used as catalysts in azo dye degradation reactions.
GRAPHICAL ABSTRACT
Introduction
Environmental pollution is a global problem, with water pollution being one such issue. Water contamination by toxic chemicals, such as azo dyes, is a serious matter of concern. Azo dyes are used as colorants in the textile industry. Previous studies have shown that untreated dyes can accumulate in the environment, harm humans, and threaten the ecosystem (Citation1). In the last few decades, many academic and industrial research studies have focused on developing new highly active and stable catalysts for selective oxidation and total degradation of organic substances (Citation2). Hence, eco-friendly, cheap methods with shorter processing times are required to remove these dyes from wastewater. Metallic nanoparticles (NPs) have recently gained increased research attention owing to their applicability in many fields. Nanomaterials offer distinctive structural and physiochemical properties compared to their bulk counterparts owing to their high surface-to-volume ratio (Citation3–8). Attempts are being made to produce new cost-effective NPs. In the past, many chemical and physical methods have been used for dye degradation studies; however, recently, biological routes have been investigated. This route of synthesizing NPs produces environmentally friendly and less toxic NPs of varying sizes (Citation1, Citation3, Citation6). One of the drawbacks of this approach is the low yield, which is insufficient for commercialization (Citation8).
Several attempts have been made to synthesize green NPs for environmental remediation, specifically for degrading organic pollutants in wastewater. Metals such as Au, Ag, Fe, Cu, and Ni have been used (Citation8–10) for synthesizing such NPs. Ag is used in many green NP approaches because Ag ions have a low reduction potential. However, Ag has many drawbacks, including being expensive, and toxic to aquatic systems. According to the United States Occupational Safety and Health Administration (US OSHA), the regulated and recommended exposure limits for Ag metal and soluble compounds are 0.01 mg/m3 (https://www.osha.gov/annotated-pels/table-z-1). Therefore, finding alternative, less toxic metals for NP synthesis is important. Fe, the fourth most abundant element in the earth’s crust, is found in trace amounts in water and soil and has fewer toxic effects (Citation9). The OSHA exposure limit for iron oxide is only 5.0 mg/m3, hence they are less toxic than Ag. There are two forms of iron: Ferrous ion (Fe2+) and Ferric ion (Fe3+). In water, the bivalent ion is soluble, whereas the trivalent ion is insoluble (Citation11). Fe3+ ionic compounds are water-soluble in strongly acidic conditions and are reduced to Fe2+ ions under different conditions. In addition to its low toxicity, Fe has other advantages such as biodegradability, low cost, abundance, high chemical reactivity, and affinity for the substrate (Citation9,Citation12). Therefore, the synthesis of iron NPs (INPs) is preferred. Of the many synthetic methods, synthesis of INPs using a green method will minimize the negative impacts of the synthesis procedures and salts of Fe2+ and Fe3+ have been used in many applications (Citation9, Citation12–17). The formation of INP was visually observed by the color changes and precipitate formation that occurred when the Fe salt was mixed with the chosen green source (Citation18). From the published studies on green synthesis methods for INP preparation, the main green source has been plant-based extracts (Citation19). Biological molecules in natural sources are responsible for reducing metal ions to another oxidation state and acting as capping and stabilizing agents.
Metal ions surround these biological molecules and stabilize NPs. NPs of different sizes and shapes can be synthesized via green methods using other starting materials and metals (Citation20–24), and these NPs have shown antioxidant, antimicrobial, catalytic, and even redox properties (Citation25–28). INP synthesized using plant extracts has been tested for the successful removal of azo dyes (Citation3, Citation9, Citation16). Among the different dyes used as models to test the applicability of the green NPs, methyl orange (MO) and methylene blue are the two common dyes tested (Citation10, Citation14, Citation16, Citation29, Citation30). Adsorption and photocatalysis are the most popular methods applied for the reduction of pollutants in water (Citation10, Citation12). In the removal of organic dyes, the degradation process has been achieved by exposure to ultra violet (UV) light, sunlight, or catalyst hydrogen peroxide (H2O2), and sometimes with the combination of light with H2O2 and NPs (Citation13, Citation16, Citation31). In recent decades, photocatalysis has attracted a lot of attention and the interest of many researchers, who consider the use of photocatalyst technology a new approach for cleaning environmental pollutants (Citation7, Citation9, Citation32). Photocatalyst degradation has several advantages over traditional technologies (Citation32, Citation33). It is relatively simple with low toxicity and has a high efficiency (Citation7). Iron/iron oxide NPs have been used as a photocatalyst for the remediation of organic dyes (Citation9). In this process, hydroxyl radical (OH.) acts as an oxidizing agent (Citation32) in advanced oxidation processes in the presence of H2O2 and UV radiation (Citation34). OH. is used inefficiently in oxidizing organic pollutants, such as azo dyes. Previous studies have proposed that UV light can be replaced with solar light because there are no consistent differences between the reactions in the presence of solar light and UV radiation (Citation35).
Milk has long been considered a healthy drink owing to its rich nutrients and the presence of all the essential amino acids. It is a readily available product compared to plant extracts, and studies have demonstrated that AgNPs can be formed using milk (Citation25, Citation27, Citation28). Proteins in milk are thought to be responsible for reducing metal ions (Citation25, Citation27, Citation28, Citation36–39). In addition to their antifungal and antibacterial properties, milk NPs exhibit electrochemical behavior (Citation25). The most common animal milk are cow (CW) and goat (GT) milk. As milk has been used to prepare NPs using other metals, in this study we used CW and GT milk to prepare INPs and investigated the possibility of using milk INP in the degradation process because milk contains no toxic materials (Citation36). Herein, we report the synthesis of INPs using ferric chloride (FeCl3) (Citation3) and pasteurized CW and GT milk and characterization of the INPs using different techniques. MO was used as a model dye to study the degradation process. The degradation process was performed in the presence of H2O2, UV light, and INP of both the milk types.
Materials and methods
Materials and instrumentation
FeCl3, H2O2, and MO of high purity were purchased from Sigma Aldrich (St. Louis, MO). Pasteurized CW (Borden Vitamin D Whole Milk Grade A, Borden dairy company, Dallas, TX, USA) and GT (Meyenberg-Goat Milk, Meyenberg, Turlock, CA, USA) were purchased from local stores in TX. A BT Lab system shaker, Jasco V-770 spectrophotometer, Thermo Fisher Scientific Nicolet iS5 Fourier Transform infrared (FTIR) spectrometer, JEOL JSM-6010LA, scanning electron microscope (SEM), Bruker Endeavor x-ray diffraction (XRD) spectrometer, Kratos Ultra DLD spectrometer, and a BASI C3 cell stand model serial # C3 1532S cyclic voltammeter were used in the characterization studies.
Synthesis of Fe nanoparticles
CW and GT INPs were prepared following the method described by Bibi et al. with minor modifications (Citation3). Herein, two volumes of pasteurized CW or GT milk was mixed with one volume of 1M FeCl3 solution (2:1 v/v milk:FeCl3). The mixture was heated at 70 °C for 15 min, with continuous stirring, on a magnetic stirrer until the pale-yellow color changed to orange. The mixture was centrifuged at 15,000 rpm for 10 min, and the precipitate was washed with distilled water (4–5 times). After centrifugation, the collected precipitate was dried at 60 °C for 3 h and stored until characterization and dye degradation studies were performed.
SEM, energy dispersive X-ray spectroscopy (EDS), transmission electron microscopy (TEM), and XRD measurements
SEM and EDS analyses were performed using a scanning electron microscope and In TouchScope software (Citation25), and the samples were prepared on carbon-coated adhesive tape. Backscattered electron images were collected using an accelerating voltage of 10 kV and a load current of approximately 90 µA with a working distance of 9 mm. EDS spectra were gathered at a magnification of 2000x, and the analyzed area was 0.15 mm2 (110 µm x 135 µm). A silicon-drift detector performed qualitative analysis and quantification of the elemental composition with the characteristic X-rays. Semi-quantification is based on theoretical correction of the ZAF (Z-atomic number, A-absorption, and F-fluorescent excitation) effect. The TEM images were obtained using a JEOL 1200 EX microscope at an accelerating voltage of 100 kV. INPs were sonicated in distilled water and filtered through a 0.2-micron filter, and the sample solution was pipetted onto a size 300 carbon-coated Cu grid. The particle size distribution of the INPs were obtained from TEM images and analyzed using ImageJ version 1.53t freeware (http://imagej.nih.gov/ij). Images were spatially calibrated, and the largest diameter (length) of the particles was measured manually using the line selection tool in ImageJ. XRD experiments were performed using a wavelength of 1.540598 Å, with a 40 kV, 25 mA source, and scan type 2Ɵ (Citation25).
FTIR measurements
The formation of INPs was initially confirmed visually by the color changes observed between the flask containing milk alone (2:1 volume ratio with milk:water) and milk containing FeCl3. Interactions of biomolecules with INPs of pasteurized CW and GT were observed by recording FTIR spectra of the synthesized INPs using an FTIR spectrometer. FTIR spectra were recorded in the range of 500–4000 cm−1. The samples were directly applied to the diamond crystal, the spectra were recorded using the attenuated total reflection (ATR) method, and the data were analyzed using the Omnic FTIR software (Citation25).
X-ray Photoelectron Spectroscopy (XPS)
XPS measurements were performed on a Kratos Ultra DLD spectrometer using a monochromatic Al-Kα source operating at 150 W (1486.6 eV). The operating pressure was 2 × 10⁻⁹ Torr. Charge compensation was achieved by using low-energy electrons. All spectra were charge-referenced by adjusting the C 1s region to 284.6 eV. The survey scans were acquired at a pass energy of 120 eV. The high-resolution spectra were acquired at a pass energy of 20 eV. The XPS data were processed using Casa XPS software.
Cyclic voltammetry studies
Cyclic voltammetry experiments on the INPs were performed using a BASI C3 cyclic voltammeter, and different potential ranges were established based on the type of analyte. The scan rate was 100 mVs−1, and the current was 10 mA. The carbon, silver, and platinum wires were used as the working, reference, and counter electrodes (Citation25, Citation40). Electrochemical measurements were performed at 250C using a 50 mM phosphate buffer (pH = 7.4).
MO degradation Using H2O2
All the MO degradation experiments were performed in a beaker with a magnetic stirrer at room temperature (25 °C). Herein, 2 mg of INPs were added to 8.9 ml of distilled water containing 100 µL of MO solution (2.25 mM concentration, calibration curve in supplementary material) 1.0 ml of 10% H2O2 was added to obtain a total volume of 10.0 ml. The suspension was continuously stirred using a magnetic stirrer. The mixture was scanned by UV Visible (UV/Vis) spectrometer for 2 h and 30 min. The results are presented for the first 60 min. The color disappeared after 2 h and 30 min.
Photocatalytic effect on Dye degradation
All experiments were performed in a manner similar to that mentioned above, with H2O2, and 5 mg of INP. The suspension was continuously stirred using a magnetic stirrer under exposure to 12 W UV light of long wavelength (365 nm) in a dark room. An experiment using a short wavelength (252 nm) was attempted but it was unsuccessful. Hence, the entire experiment was performed at a long wavelength. This preparation method was based on a study conducted by Tharunya et al. (Citation1), with slight modifications. The mixture was scanned using UV/Vis spectrometer every 10–15 min for up to 3 h.
Results and discussion
CW and GT INPs
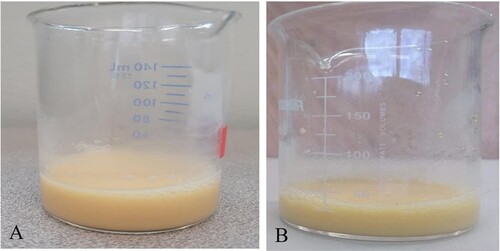
Many metals have been used in green NP synthesis (Citation8, Citation9, Citation25, Citation26, Citation41, Citation42). Among these, iron salts have been used in many studies. NPs obtained using these substrates and plant extracts have produced INPs that can potentially degrade many environmental pollutants (Citation1, Citation3, Citation8, Citation14, Citation15, Citation18, Citation26, Citation43). Although milk has been used in NP preparation studies, no report is available on the preparation of INPs using CW and GT milk, and the application of INPs for any environmental use. INP formation was visually observed by the color change from white to yellow-orange/orange in milk, as shown in . This was confirmed later using different characterization techniques. In contrast to the previous reports, the black color was not observed during the synthesis, even with longer preparation time (Citation3, Citation14, Citation16).
Figure 1. Visual images of the INP formed using cow (A) and goat (B) milk.
SEM-EDS and TEM Characterization of CW and GT INPs
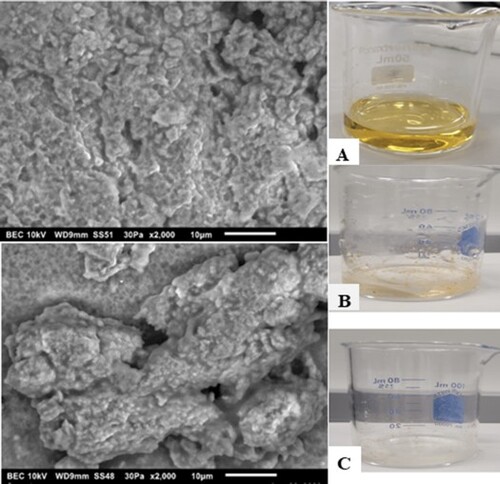
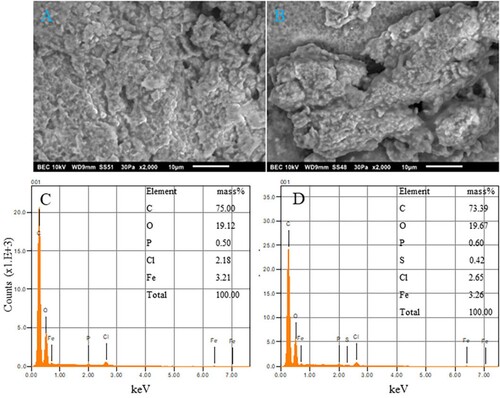
To better understand the size, shape, and presence of Fe in the NPs, SEM-EDS analysis was performed. shows the SEM (upper panels) and EDS (lower panels) images obtained using both types of milk. The synthesized CW and GT INPs generated strong energy dispersion, as observed using EDS and SEM. The SEM images displayed the morphology; as seen in the , they appeared semi-spherical, aggregated, and amorphous. The EDS spectrum provides quantitative information on the synthesized INP. The quantitative data of both INP samples exhibit absorption peaks for Fe between 6.00 and 8.00 keV (). Characteristic Fe peaks were seen at 6.5 and 7.1 keV. The EDS data presented below demonstrate the presence of Fe in both INPs, and the amount of Fe present by mass was 3.21% in CW INP and 3.26% in GT INP. The amount of Fe present may be low because the biological molecules surrounding the surface of Fe do not interact with the X-ray. In addition to Fe, both NPs contained other elements: carbon (C), oxygen (O), phosphorous (P), and chlorine (Cl). GT NP had a small percentage of S (0.42%). The biomolecules in milk act as capping and reducing agents (Citation25, Citation27, Citation28,Citation37). Hence, we observe peaks other than Fe and O. These results are consistent with other published studies where green sources are used in the NP preparations (Citation21, Citation22, Citation25).
Figure 2. SEM and EDS spectrum of synthesized INPs obtained from cow (CW) and goat (GT) milk. The upper panels represent the SEM images of CWINP (A) and GTINP (B) and the lower panels represents the EDS data for CWINP (C) and GTINP (D). The insets in C and D represents the % of elements present in each case.
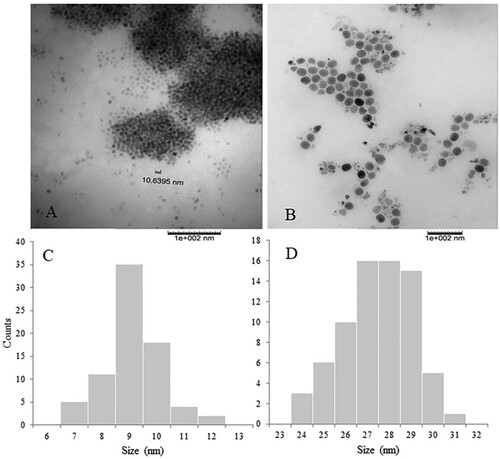
The presence of an oxygen peak at 0.6 keV indicates the formation of iron oxides (Citation16). Previous reports suggest that the trace elements present may also be responsible for the protein capping of the synthesized nanoparticles (Citation27). The surface morphology was observed at a magnification of 2000x, and the SEM image showed the aggregation of the INPs. Similar to the synthesis of AgNPs using CW and GT milk, we observed a tendency of the INPs to congregate due to the presence of lipids and proteins surrounding the INPs (Citation24). TEM images and size distribution analysis of TEM images of CW INP and GT INP are shown in . The TEM images clearly show that they are in the nanometer range, semi-spherical, and highly aggregated. Size distribution analysis of the TEM images show that CWINPs are smaller than GTINPs and the average sizes are 8.6 ± 0.9 and 26.9 ± 1.5 nm. These sizes are consistent with previous reports (Citation3, Citation13, Citation1414).
Figure 3. TEM images and image analysis of synthesized INPs obtained from cow (CW) and goat (GT) milk. The upper panels represent the TEM images of CWINP (A) and GTINP (B) and the lower panels represent the particle size distribution histograms of CWINP (C) and GTINP (D).
UV-visible and FTIR Characterization of CW and GT INPs
UV-Vis spectroscopy is widely used to observe the optical properties of particles. Peak maxima were observed owing to surface plasmon resonance (SPR), resulting in an absorption band. Sharp peaks were obtained for the individual NPs, whereas broadbands were visible for the aggregated NPs. For the INPs, the spectra were obtained in the range of 200–500 nm with a weak broad peak at approximately 280 nm (data not shown). Our results indicated that the prepared NPs were aggregated. Aggregation could be a result of H-bonding present in organic moieties present in milk samples (Citation3, Citation27, Citation28). Previous work has shown that individual Fe2O3-NP exhibit SPR at approximately 370 nm (Citation3, Citation15). However, no prominent peaks were observed in this range. Our data are consistent with those reported by Pan et al. (Citation23), where the peak maximum was observed at 278 nm. The detection of the SPR ranges with varying energy bandgaps, and it is shifted from the observed spectra for pure metallic Fe (268 nm) (Citation18). Bandgaps helps us to understand the electronic behavior of a material and many materials that have been used as photocatalysysts have band gap values ranging from 1.5–3.5 eV (Citation7). Shifting of absorption is expected based on the size and shape of the metal oxide (Citation44, Citation45), and our results indicate that the geometrical parameters of the metal oxides remain similar in all preparations.
Furthermore, the INPs synthesized using both milk preparations were subjected to ATR-FTIR analysis to identify the functional groups in milk responsible for reducing Fe (III) ions. The spectra were obtained from 500 to 4000 cm−1. This method provides details of the vibrational frequencies of different molecules present in milk that are involved in INP preparations and the capping and stabilization of the INPs. displays the FTIR spectra, and lists the vibrational modes and wavenumbers for different stretching and bending modes of different functional groups. Strong and medium bands corresponding to the O-H stretching and bending of carboxylic acids were observed. C = C stretching and bending of alkenes, N-O stretching of nitro compounds, C–H bending of alkanes and aromatic compounds, strong C–O stretching of alkyl aryl compounds, strong N-O stretching of nitro compounds, and C–N stretching of amines. The band at 600 cm−1 indicates a possible Fe-O stretching vibration [14, 16]. As shown by the FTIR data, the presence of various functional groups demonstrates that these groups surround INPs. Peaks suggest a biological coating on the surface of nanoparticles and agree with previous studies where milk was used in NP synthesis using other metals (Citation25).
Figure 4. Fourier transform infrared (FTIR) spectrum of INPs synthesized using cow (A) and goat (B).
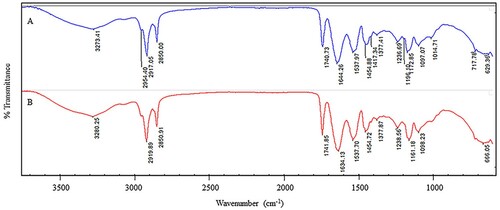
Table 1. FTIR spectrum data of cow (CW) and goat (GT) milk INP.
XRD and XPS Characterization of the CW and GT INPs
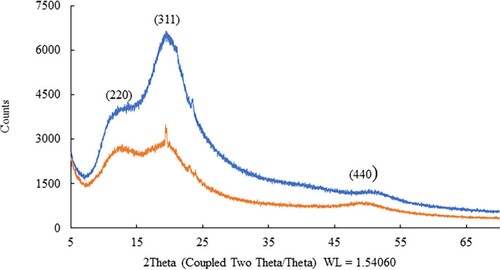
The XRD patterns of the synthesized NPs are shown in . This method provided detailed information on the chemical composition and crystallographic nature of the synthesized NPs. In , the reflection peaks appear broader, indicating the formation of the INPs. Both INPs showed diffraction peaks at 2Ɵ = 12.50 & 12.70, 20.50 & 19.50 and 51.50 & 49.60 for GT INP (blue) and CW INP (yellow), respectively. These peaks correspond to crystalline peaks planes of (220), (311) and (440) of Fe2O3 (Citation15) and matched with the Joint Committee on Powder Diffraction Standars (JCPDS) File No. (4-755). The broader peaks and lack of many crystalline peaks indicate that the INPs may be amorphous, which are consistent with previous observations (Citation13, Citation14). Our previous work on silver NP preparations (Citation25) with these types of milk resulted in XRD data indicating that in the NPs, crystallization of the bio-organic phase occurs on the surface of the AgNPs.
Figure 5. X-ray diffraction (XRD) pattern of INPs synthesized using cow (yellow) and goat (blue) milk.
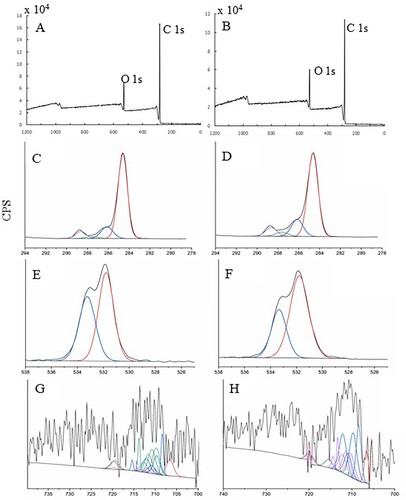
XPS analysis was performed to better understand the core levels. The results are shown in . Among the elements C, O, and Fe in both INP preparations, the amount of Fe was much less than that of the other elements. Multiple XPS scans were performed to investigate the changes in the oxidation state of Fe associated with INP formation. In addition to elemental Fe, C and O scans were also performed, and the individual scans of O (1S), C (1S), and Fe (2p) are shown in . The high-resolution spectra of C1s for CW and GT INPs can be fitted with four peaks corresponding to C–C, C–H, C–O, C = O, and O–C = O bonds, respectively (Citation46–48). O1s spectra for both samples were fitted with two peaks corresponding to O–C = O and C–O bonds. Scans on Fe (2P) revealed its low amount, and the curve was fitted with peaks corresponding to Fe metal, Fe-O, Fe2O3, and FeOOH. We did not observe any Fe in the FeCl3 form during NP preparation.
Figure 6. XPS survey spectrum (A and B), high resolution spectra of C1s (C and D), O1s (E and F) and Fe2p (G and H) of CWINP (left) and GINP (right).
Redox properties of CW and GT INPs
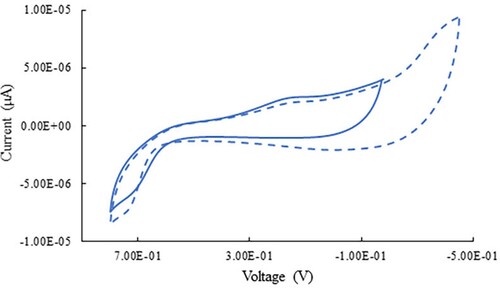
The electron transfer properties of the CW and GT INPs were investigated using a phosphate buffer system. Fe can exist in various oxidation states. Cyclic voltammetry is a technique used to study the electrochemical performance of a working electrode (Citation49). shows the INP response to the applied chemical potentials for both CW and GT INPs. The area under the curve shows the stability of INP in electrochemical applications. All experiments were performed with the C as the working electrode to ensure that Fe oxidation was easily achieved, while Ag and Pt electrodes served as the reference and counter electrodes, respectively. The results shown in show the potential windows for both types of NPs in the buffer system (Citation50). The starting potentials for both types of INP were the same; however, the switching potentials were different, with the GT INPs reaching a higher potential. Small oxidative and reduction peaks were observed in both cases. Because the average particle sizes are in a similar range, the different electrochemical stabilizing effects can be accounted for the protein molecules that act as capping and stabilizing agents and are present on the surface of the INPs. Here, we demonstrate for the first time that INPs synthesized using CW and GT milk exhibit electron transfer properties and may be valuable for biosensing, electrocatalysis, and nanoelectronics applications. A similar observation was made previously by us when AgNPs were formed using the same starting materials (Citation25), indicating that milk NP can be used in electrochemical applications.
Figure 7. A comparison of cyclic voltammograms of INPs obtained using cow (solid) and goat (dashed) milk. At different temperatures and in different buffers.
Dye degradation studies
Green iron-oxide NPs have been used in many dye degradation studies (Citation1, Citation13, Citation14, Citation1616). In these studies, the INPs were formed using Fe(II) or Fe(III) salts in conjunction with plant extracts. Previous in vivo and in vitro investigations of the metal NPs suggest low toxicity excreted by Fe/FeO NPs (Citation9, Citation51). In previous studies, INPs acted as a heterogeneous Fenton-like catalyst in the degradation process. Many different dyes (Citation3, Citation15) have been used as model pollutants in these studies, and the most common dyes are MO (Citation13, Citation14) and methylene blue (Citation16). The common precursor in both these dyes is the azo group, and the metal NPs act as effective catalysts in the reduction reactions. Degradation reactions were performed in the presence of 10% H2O2 (Citation9, Citation11), UV light (Citation3, Citation15), or sunlight (Citation1, Citation15, Citation16).
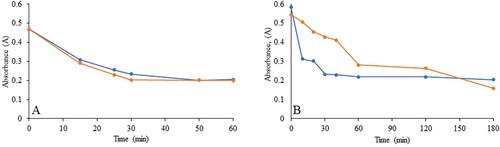
In our experiments, we used H2O2 and UV light to observe the degradation of the dye MO. shows the MO solution before the addition of the NPs and after the complete reaction. The color of dyes disappeared when both types of INPs were added. The reactions were monitored using a UV-Vis spectrometer, and the spectra were scanned at different time intervals. We used a minimal amount of INP (2 mg) for the experiments with 10% H2O2, whereas 5 mg of INPs was used with UV light. In the case of the experiments with 10% H2O2, when 5 mg of INPs were used, the reaction was very fast and difficult to monitor. Hence, we reduced the amount so that we could reasonably observe the reaction. and show the experimental scans obtained for the degradation of the dye with 10% H2O2 and UV light. Upon 10% H2O2 application, scans were performed for the first 60 min, whereas for the experiments with UV light, the reaction was monitored for a longer time (180 min). The plots of absorbance versus time for both reactions and types of NPs are shown in . The data showed that the degradation of MO with both types of NPs proceeded at a similar rate as that in the presence of H2O2. However, in the presence of UV light, in the first 60 min, the GT INP particles degraded the dyes much faster than the CW INPs. This result may be due to the higher potential difference observed for the GT INPs. The presence of 10% H2O2 made the reaction much faster, and a higher percentage of the dye was degraded in a shorter time. Previous work has suggested that during the degradation of MO, the particle size of the INPs is directly proportional to the reaction time (Citation42). In our study, both INPs had similar sizes, and catalysis occurs only on the surface of metals. The effectiveness of a catalyst can be achieved by increasing its surface area (Citation1, Citation4, Citation6, Citation52). However, a critical size exists in this case (Citation1). Herein, the investigation of the dye degradation mechanisms using H2O2 and UV light was not performed. The degradation mechanisms of both processes have already been documented (Citation3, Citation9, Citation26, Citation42). Our goal was to examine the synthesis and applicability of INPs (Citation53) using milk in the dye degradation process because milk is more easily obtained than plant extracts. The size of the NPs plays a vital role in catalysis. The smaller the size, the greater the efficiency. Increasing the amount of catalyst resulted in an increased surface area of the catalyst, leading to the adsorption of dye molecules and photons onto the active site of the catalyst surface (Citation26). Hence, the INP synthesis method should be optimized, as the size varies based on many factors. Furthermore, our dye degradation studies used minimal amounts of INP (2 and 5 mg). EDS and XPS data showed that the amount of Fe present in the synthesized INP was minimal, which significantly affected the presence of NPs in the water. NPs are synthesized using biological sources; however, the presence of NPs in effluent water is a major concern (Citation42). Therefore, limiting the presence of metal NPs and recovering and reusing them would be more effective in the waste water and other industries. The method presented in this study is more environmentally friendly. Among the metal NPs, Fe has low toxicity. However, excess of this metal can be toxic to humans, plants, and other sources (Citation51). Therefore, finding green INPs with less Fe percentage that are usable in multiple applications is significant.
Figure 8. Visual images of methyl orange before reaction and after reaction. A – methyl orange before the addition on any INP, B (CWINP) and C (GTINP) after reaction with H2O2, and after exposure to UV light D (CWINP) and E (GTINP).
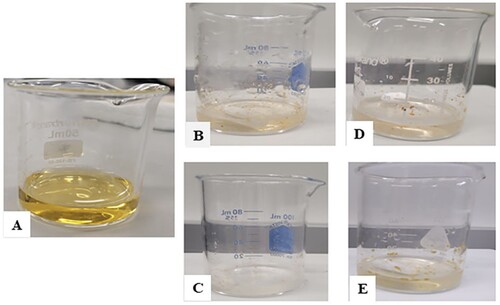
Figure 9. UV-Vis spectral scans for the Methyl orange solution before and after reaction in the presence of H2O2. A represents the scans with CWINP and B represent the scans with GTINP. The color lines in each case indicates the scan time after the reaction. The reaction monitored at 464 nm.
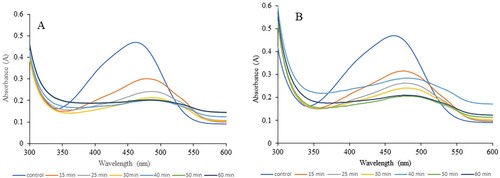
Figure 10. UV-Vis spectral scans for the Methyl orange solution before and after reaction when exposed to UV light. A represents the scans with CWINP and B represent the scans with GTINP. The color lines in each case indicates the scan time after the reaction. The reaction monitored at 464 nm.
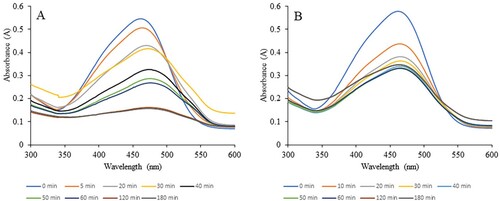
Figure 11. Absorbance vs Time plots for the degradation reaction of methyl orange. A represents the plot in the presence of H2O2 and B represent the plot for UV light exposure. The reaction monitored at 464 nm. In both cases, orange line represents the curve for CWINP reaction and the blue line represent the curve for GTINP.
Conclusion
INPs have gained considerable attention in recent years because they have the potential to be used in biomedical applications and environmental remediation. The availability of green sources limits the large-scale production of green metallic NPs. Hence, it is essential to explore the synthesis of INPs using green sources, which can be obtained easily. In this study, we demonstrate the synthesis of INPs using commercially available milk. The milk-based synthesis of INPs is an environmentally nontoxic method; it can be used as a heterogeneous Fenton-like catalyst to degrade the azo dye methyl orange. Further studies are needed to optimize the synthesis parameters, understand the kinetics, mechanism, optical properties, reusability of the INPs (Citation54, Citation55) and explore the possibility of obtaining particles of different sizes for other applications.
Supplemental Material
Download JPEG Image (235.7 KB)
Disclosure statement
No potential conflict of interest was reported by the author(s).
Acknowledgements
The authors would like to thank Dr. Richard Littleton and Dr. Vitha Stanislav Texas A&M University (Microscopy Imaging Center) for there assistance with the TEM analysis of the samples, Dr. Joseph Reibenspies of Texas A&M University (X-ray Diffraction laboratory) for his assistance with the XRD analysis of the samples and Dr. Angelica Benavidez of University of New Mexico for the XPS analysis of the samples.
Additional information
Funding
References
- Tharunya, P.; Subha, V.; Kirubanandan, S.; Sandhaya, S.; Renganathan, S. Green Synthesis of Superparamagnetic Iron Oxide Nanoparticle from Ficus Carica Fruit Extract, Characterization Studies and Its Application on Dye Degradation Studies. Asian J. Pharm. Clin. Res 2017, 10, 125–128.
- Trendafilova, I.; Šuligoj, A.; Ristic, A.; Velde, N.; Dražić, G.; Opresnik, M.; Zabukovec Logar, N.; Novak Tusar, N. Evolution of Surface Catalytic Sites on Bimetal Silica-Based Fenton-Like Catalysts for Degradation of Dyes with Different Molecular Charges. Nanomaterials 2020, 10, 2419. doi:10.3390/nano10122419.
- Bibi, I.; Nazar, N.; Ata, S.; Sultan, M.; Ali, A.; Abbas, A.; Jilani, K.; Kamal, S.; Sarim, F.M.; Khan, M.I.; Jalal, F.; Iqbal, M. Green Synthesis of Iron Oxide Nanoparticles Using Pomegranate Seeds Extract and Photocatalytic Activity Evaluation for the Degradation of Textile Dye. J. Mater. Res. Technol 2019, 8, 6115–6124.
- Baig, N.; Kammakakam, I.; Falath, W. Nanomaterials: A Review of Synthesis Methods, Properties, Recent Progress, and Challenges. Mater. Adv 2021, 2, 1821–1871.
- Flieger, J.; Flieger, W.; Baj, J.; Maciejewski, R. Antioxidants: Classification, Natural Sources, Activity/Capacity Measurements, and Usefulness for the Synthesis of Nanoparticles. Materials. (Basel) 2021, 14, 4135.
- Ijaz, M.; Zafar, M.; Iqbal, T. Green synthesis of silver nanoparticles by using various extracts: a review. Inorg. Nano-Met. Chem. 2021, 51, 744–755.
- Silva-Osuna, E.R.; Vilchis-Nestor, A.R.; Villarreal-Sanchez, R.C.; Castro-Beltran, A.; Luque, P.A. Study of the Optical Properties of TiO2 Semiconductor Nanoparticles Synthesized Using Salvia Rosmarinus and its Effect on Photocatalytic Activity. Opt. Mater. 2022, 124, 112039.
- Ying, S.; Guan, Z.; Ofoegbu, P.C.; Clubb, P.; Rico, C.; He, F.; Hong, J. Green Synthesis of Nanoparticles: Current Developments and Limitations. Environ. Technol. Innov. 2022, 26, 102336.
- Kumar, B. Green Synthesis of Gold, Silver, and Iron Nanoparticles for the Degradation of Organic Pollutants in Wastewater. J. Compos. Sci. 2021, 219, 5.
- Miri, A.; Mahabbati, F.; Najafidoust, A.; Miri, M.J.; Sarani, M. Nickel Oxide Nanoparticles: Biosynthesized, Characterization and Photocatalytic Application in Degradation of Methylene Blue Dye. Inorg. Nano-Met. Chem 2022, 52, 122–131.
- Kamble, R.K.; Thakare, M.G.; Ingle, A. B. Indian J. Environ. Prot 2013, 33, 881–888.
- Saif, S.; Tahir, A.; Chen, Y. Green Synthesis of Iron Nanoparticles and Their Environmental Applications and Implications. Nanomaterials 2016, 209, 6.
- Lohrasbi, S.; Kouhbanani, M.A.J.; Beheshtkhoo, N.; Ghasemi, Y.; Amani, A.M.; Taghizadeh, S. Green Synthesis of Iron Nanoparticles Using Plantago Major Leaf Extract and Their Application as a Catalyst for the Decolorization of Azo Dye. Bionanoscience. 2019, 9, 317–322.
- Kouhbanani, M.A.J.; Beheshtkhoo, N.; Amani, A.M.; Taghizadeh, S.; Beigi, V.; Bazmandeh, A.Z.; Khalaf, N. Green Synthesis of Iron Oxide Nanoparticles Using Artemisia Leaf Extract and Their Application as a Heterogeneous Fenton-like Catalyst for the Degradation of Methyl Orange. Mater. Res. Express 2018, 5, 115013.
- Nathan, V.K.; Ammini, P.; Vijayan, J. Photocatalytic Degradation of Synthetic Dyes Using Iron (III) Oxide Nanoparticles (Fe2O3-Nps) Synthesised Using Rhizophora Mucronata Lam. IET Nanobiotechnol. 2019, 13, 120–123.
- Bishnoi, S.; Kumar, A.; Selvaraj, R. Facile Synthesis of Magnetic Iron Oxide Nanoparticles Using Inedible Cynometra Ramiflora Fruit Extract Waste and Their Photocatalytic Degradation of Methylene Blue Dye. Mater. Res. Bull 2018, 97, 121–127.
- Hassan, S.S.M.; Abdel-Shafy, H.I.; Mansour, M.S.M. Removal of Pyrene and Benzo(a)Pyrene Micropollutant from Water via Adsorption by Green Synthesized Iron Oxide Nanoparticles. Adv. Nat. Sci: Nanosci. Nanotechnol 2018, 9, 015006.
- Pattanayak, M.; Nayak, P.L. Ecofriendly Green Synthesis of Iron Nanoparticles from Various Plants and Spices Extract. Int. J. Plant Animal Env. Sci 2013, 3, 68–78.
- Kaur, M.; Chopra, D.S. Green Synthesis of Iron Nanoparticles for Biomedical Applications. Glob J Nanomed 2018, 4, 68–76.
- Firdhouse, M.J.; Lalitha, P. Biosynthesis of Silver Nanoparticles and Its Applications. J. Nanotechnol 2015, 2015, 829526.
- Selvan, D.; Dharmasivam, D.; Raju, S. K.; Rahiman A. Garlic, Green Tea and Turmeric Extracts-Mediated Green Synthesis of Silver Nanoparticles: Phytochemical, Antioxidant and in Vitro Cytotoxicity Studies. J. Photochem. Photobiol. B: Biol. 2018, 180, 243–252.
- Mahiuddin, M.; Saha, P.; Ochiai, B. Green Synthesis and Catalytic Activity of Silver Nanoparticles Based on Piper Chaba Stem Extracts. Nanomaterials (Basel) 2020, 10, 1777.
- Pan, Z.; Lin, Y.; Sarkar, B.; Owens, G.; Chen, Z. Green Synthesis of Iron Nanoparticles Using Red Peanut Skin Extract: Synthesis Mechanism, Characterization and Effect of Conditions on Chromium Removal. J. Colloid Interface Sci 2020, 558, 106–114.
- Nadaroglu, H.; Gungor, A.A.; Ince, S.; Babagil, A. Green Synthesis and Characterisation of Platinum Nanoparticles Using Quail Egg Yolk. Spectrochim. Acta A: Mol. Biomol. Spectrosc 2017, 172, 43–47.
- Williams, B.; Gautham, I.; Grady, T.L.; Fernando, H. Redox Properties and Temperature Dependence of Silver Nanoparticles Synthesized Using Pasteurized Cow and Goat Milk. Green Chem. Lett. Rev 2022, 15, 71–82.
- Kumar, A.; Kumari, S.; Parmanand Sharma, S.K. Constructing the Nanomixture of Guar Gum and Fe3O4 for Photocatalytic Degradation of Dyes and Heavy Metal. J. Mater. Sci. Mater. Electron 2022, 33, 2643–2653.
- Athreya, A.G.; Shareef, M.I.; Gopinath, S.M. Silver Nanoparticles from Cow’s Milk to Combat Multidrug-Resistant Gram-Negative Bacteria from Clinical Isolates. Proc. Natl. Acad. Sci. India Sect. B Biol. Sci 2020, 90, 863–871.
- Lee, K.-J.; Park, S.-H.; Govarthanan, M.; Hwang, P.-H.; Seo, Y.-S.; Cho, M.; Lee, W.-H.; Lee, J.-Y.; Kamala-Kannan, S.; Oh, B.-T. Synthesis of Silver Nanoparticles Using Cow Milk and Their Antifungal Activity Against Phytopathogens. Mater. Lett 2013, 105, 128–131.
- Prabhu, N. Green Synthesis of Iron Oxide Nanoparticles (IONPs) and Their Nanotechnological Applications. J. Bacteriol. Mycol. 2018, 6, 260–262.
- Pinheiro, A.C.N.; Bernardino, T.S.; Junior, F.E.B.; Lanza, M.R.V.; Barros, W.R.P. Enhanced Electrodegradation of the Sunset Yellow Dye in Acid Media by Heterogeneous Photoelectro-Fenton Process Using Fe3O4 Nanoparticles as a Catalyst. J. Environ. Chem. 2020, 8, 103621.
- Navarro, P.; Pellicer, J.A.; Gómez-López, V.M. Degradation of Azo Dye by an UV/H2O2 Advanced Oxidation Process Using an Amalgam Lamp. Water Environ. 2019, 33, 476–483.
- Akbari, A.; Sabouri, Z.; Hosseini, H.A.; Hashemzadeh, A.; Khatami, M.; Darroudi, M. Effect of Nickel Oxide Nanoparticles as a Photocatalyst in Dyes Degradation and Evaluation of Effective Parameters in Their Removal from Aqueous Environments. Inorg. Chem. Commun 2020, 115, 107867.
- Razavi-Esfali, M.; Mahvelati-Shamsabadi, T.; Fattahimoghaddam, H.; Lee, B.-K. Highly Efficient Photocatalytic Degradation of Organic Pollutants by Mesoporous Graphitic Carbon Nitride Bonded with Cyano Groups. Chem. Eng. J 2021, 419, 129503.
- Luo, M.; Xu, W.; Jeong, T. Development and Numerical Modelling of a Novel UV/H2O2 Rotating Flow Reactor for Water Treatment. Water Sci. Technol. 2021, 83, 1217–1229.
- Melián, J.A.H.; Rodrı́guez, J.M.D.; Suárez, A.V.; Rendón, E.T.; Campo, C.V.d.; Arana, J.; Peña, J.P. The Photocatalytic Disinfection of Urban Waste Waters. Chemosphere 2000, 41, 323–327.
- Pandey, S.; De Klerk, C.; Kim, J.; Kang, M.; Fosso-Kankeu, E. Eco Friendly Approach for Synthesis, Characterization and Biological Activities of Milk Protein Stabilized Silver Nanoparticles. Polymers. (Basel) 2020, 12, 1418.
- Ihum, T.; Iheukwumere, C.; Ogbonna, I.; Gberikon, G. M. Antimicrobial Activity of Silver Nanoparticles Synthesized Using Goat Milk Against Pathogens of Selected Vegetables. Int. J Biochem. Res. Rev. 2019, 25, 1–9.
- Gholami-Shabani, M.; Shams-Ghahfarokhi, M.; Gholami-Shabani, Z.; Akbarzadeh, A.; Riazi, G.; Razzaghi-Abyaneh, M. Biogenic Approach Using Sheep Milk for the Synthesis of Platinum Nanoparticles: The Role of Milk Protein in Platinum Reduction and Stabilization. Int. J Nanosci. Nanotechnol 2016, 12, 199–206.
- Roncada, P.; Gaviraghi, A.; Liberatori, S.; Canas, B.; Bini, L.; Greppi, G.F. Identification of Caseins in Goat Milk. Proteomics 2002, 2 (6), 723–726.
- Saravanan, T.; Anandan, P.; Shanmugam, M.; Jayakumari, T.; Arivanandhan, M.; Azhagurajan, M.; Hayakawa, Y.; Jayavel, R. Impact of Graphene on the Enhancement of Electrochemical and Photocatalytic Performance of Gd2O3 - Graphene Nanocomposites. Solid State Sci. 2018, 83, 171–180.
- Arasu, M.V.; Arokiyaraj, S.; Viayaraghavan, P.; Kumar, T.S.J.; Duraipandiyan, V.; Al-Dhabi, N.A.; Kaviyarasu, K. One Step Green Synthesis of Larvicidal, and Azo Dye Degrading Antibacterial Nanoparticles by Response Surface Methodology. J. Photochem. Photobiol. B: Biol 2019, 190, 154–162.
- Nandhini, N.T.; Rajeshkumar, S.; Mythili, S. The Possible Mechanism of Eco-Friendly Synthesized Nanoparticles on Hazardous Dyes Degradation. Biocatal. Agric. Biotechnol 2019, 19, 101138.
- Krishnamoorthy, R.; Roy Choudhury, A.; Arul Jose, P.; Suganya, K.; Senthilkumar, M.; Prabhakaran, J.; Gopal, N.O.; Choi, J.; Kim, K.; Anandham, R.; Sa, T. Long-Term Exposure to Azo Dyes from Textile Wastewater Causes the Abundance of Saccharibacteria Population. Appl. Sci 2021, 11, 379.
- Mahmudin, L.; Suharyadi, E.; Utomo, A.; Abraha, K. Optical Properties of Silver Nanoparticles for Surface Plasmon Resonance (SPR)-Based Biosensor Applications. J. Mod. Phys 2015, 06, 1071–1076.
- Sherry, L.J.; Jin, R.; Mirkin, C.A.; Schatz, G.C.; Van Duyne, R.P. Localized Surface Plasmon Resonance Spectroscopy of Single Silver Triangular Nanoprisms. Nano Lett. 2006, 6, 2060–2065.
- Lin, Y.; Zhang, L.; Liu, H. ZnMn2O4/Milk-Derived Carbon Hybrids with Enhanced Lithium Storage Capability. Int. J. Hydrog. Energy 2020, 45, 6874–6884.
- Baikeli, Y.; Mamat, X.; He, F.; Xin, X.; Li, Y.; Aisa, H.A.; Hu, G. Electrochemical Determination of Chloramphenicol and Metronidazole by Using a Glassy Carbon Electrode Modified with Iron, Nitrogen Co-Doped Nanoporous Carbon Derived from a Metal-Organic Framework (Type Fe/ZIF-8). Ecotoxicol. Environ. Saf 2020, 204, 111066.
- Biesinger, M.C. Accessing the Robustness of Adventitious Carbon for Charge Referencing (Correction) Purposes in XPS Analysis: Insights from a Multi-User Facility Data Review. Appl. Surf. Sci 2022, 597, 153681.
- Rahman, S.S.U.; Qureshi, M.T.; Sultana, K.; Rehman, W.; Khan, M.Y.; Asif, M.H.; Farooq, M.; Sultana, N. Single Step Growth of Iron Oxide Nanoparticles and Their Use as Glucose Biosensor. Results Phys. 2017, 7, 4451–4456.
- Giovanni, M.; Pumera, M. Size Dependant Electrochemical Behavior of Silver Nanoparticles with Sizes of 10, 20, 40, 80 and 107 nm. Electroanalysis 2012, 24, 615–617.
- Valdiglesias, V.; Fernández-Bertólez, N.; Kilic, G.; Costa, C.; Costa, S.; Fraga, S.; Bessa, M.; Pásaro, E.; Teixeira, J.P.; Laffon, B. Are Iron Oxide Nanoparticles Safe? Current Knowledge and Future Perspectives. J. Trace Elem. Med. Biol 2016, 38, 53–63.
- Frelink, T.; Visscher, W.; Veen van, J.A.R. Particle Size Effect of Carbon-Supported Platinum Catalysts for the Electrooxidation of Methanol. J. Electroanal. Chem 1995, 382, 65–72.
- Gautam, S.; Agrawal, H.; Thakur, M.; Akbari, A.; Sharda, H.; Kaur, R.; Amini, M. Metal Oxides and Metal Organic Frameworks for the Photocatalytic Degradation: A Review. J. Environ. Chem. Eng. 2020, 8, 103726.
- Shakil, M.; Inayat, U.; Tanveer, M.; Nabi, G.; Gillani, S.S.A.; Rafique, M.; Tariq, N.H.; Shah, A.; Mahmood, A. NiO and Ag-Cd co-Doped NiO Nanoparticles: Study of Photocatalytic Degradation of Rhodamine B dye for Wastewater Treatment. Int. J. Environ. Sci. Technol 2023, 20, 2021–2036.
- Shakil, M.; Inayat, U.; Khalid, N.R.; Tanveer, M.; Gillani, S.S.A.; Tariq, N.H.; Shah, A.; Mahmood, A.; Dahshan, A. Enhanced Structural, Optical, and Photocatalytic Activities of Cd-Co Doped Zn Ferrites for Degrading Methyl Orange dye Under Irradiation by Visible Light. J. Phys. Chem. Solids 2022, 161, 110419.