
 ?Mathematical formulae have been encoded as MathML and are displayed in this HTML version using MathJax in order to improve their display. Uncheck the box to turn MathJax off. This feature requires Javascript. Click on a formula to zoom.
ABSTRACT
The photocatalytic degradation of the organic pollutants using the green synthesized catalysts is an environmentally safe approach for the wastewater treatment. In this study, ZnO and CuO nanoparticles (NPs) and ZnO/CuO nanocomposites (NCs) with various CuO weight percents were synthesized using extract of Musa acuminata fruit peel as the stablizing and capping agent. The synthesized nanomaterials were characterized by TGA/DTA, XRD, SEM, TEM, SAED, HR-TEM, UV-DRS and FTIR techniques. The degradation of methylene blue (MB) dye using the synthesized catalysts was investigated under a visible light source. XRD analysed average crystalline sizes were 24.9, 17.0 and 22.6 nm for ZnO, CuO, and ZnO/CuO nanomaterials, respectively. The SEM and TEM analysis confirms that ZnO NPs, CuO NPs, and ZnO/CuO NCs possessed the spherically shaped monoclinic structure. The bandgap energies of ZnO NPs, CuO NPs and ZnO/CuO NCs were found to be 3.25, 1.7 and 3.18 eV respectively. The FT-IR analysis confirms presence of various reducing and capping agents. The photocatalytic activities of ZnO NPs, CuO NPs, and ZnO/CuO NCs were evaluated using the degradation of MB dye under the visible light irradiation. The photocatalysts CuO, ZnO, and ZnO/CuO exhibited the degradation efficiencies of 50%, 57%, and 90%, respectively.
GRAPHICAL ABSTRACT

1. Introduction
The increase in waste production and the contamination of various ecosystem components have been attributed mostly to the rapid urbanization that has been accompanied by the acceleration of industrialization and economic development. In particular, many kinds of water bodies, which are the foundational resource for the existence of every living thing, have become contaminated, which has led to a number of health issues for every living thing inside an ecosystem. The textile industries, leather and dye industries, pesticide factories, cosmetic, detergent, and chemical producer factories involve the use of highly reactive carcinogenic dyes, such as methylene blue and methyl orange, which are toxic to the natural ecosystem due to their high carcinogenic and mutagenic nature and as well their less degradation nature by conventional techniques. When those pollutants and dyes are discarded into the water bodies without adequate treatment, they could results in changing the color of the water bodies, imparting the significant changes in the hydrological cycle which could lead to severe diseases and even to the death of human beings (Citation1). Thus, the degradation and removal of those toxic non-biodegradable organic dyes from the water bodies is of great environmental and industrial importance. Previously, a number of miscellaneous methods such as ion exchange (Citation2), reverse osmosis (Citation3), membrane filtration (Citation4), adsorption processes (Citation5), chlorination (Citation6), chemical precipitation and electrochemical methods, sedimentation-flocculation and coagulation, and molecular sieving have been widely explored for the treatment of water containing wastes. Unfortunately, it has been discovered that these methods fall short in their ability to entirely remove the wastes and also produce secondary pollutants that harm the environment. Recently, reports have shown that the use of advanced oxidation process (AOPs) in the presence of heterogeneous green mediated nano-based catalysis in the presence of visible light irradiation is the best alternative techniques for the decontamination of the wastewater as compared to the conventional methods (Citation7); due to their enhanced physico-chemical properties and the potential to degrade and remove the recalcitrant carcinogenic organic pollutants into less and zero harmful forms (Citation8).
The heterogeneous photocatalysis using metal oxide NPs, especially prepared via green methods, has attracted the attention of researchers world wide. Accordingly, the electron–hole pairs of the catalyst can degrade the targeted dye molecules present within water into less or zero harmful components (Citation9). A few previous reports showed that the oxides of titanium, zinc, iron and tin NPs have been highly explored as the better option as photo-catalysts. Among these, titanium oxide and zinc oxide NPs are well known as the most prominent photocatalysts to treat the waste water, which might be attributed to their high photocatalytic activities with excellent thermal, biological, and chemical stabilities and long lifespans, non-toxicity (Citation10). The current reports revealed that, the ZnO is found to be suitable catalyst as compared to TiO2 for the effective degradation of different types of pollutants present in water due to its high quantum efficiency (Citation11). However, it is known that ZnO is a wide direct band gap material having defects such as recombination efficiency of photo-generated electrons and holes and the ZnO can absorb only ultraviolet light with energy higher than its band gap value. To increase ZnO NPs’ photo-catalytic effectiveness in degrading water contaminants, these obstacles must be removed (Citation12). To improve the photocatalytic performance of ZnO NPs toward the degradation of water contaminanats, various modification techniques such as doping and coupling with other semiconductors is reported (Citation12). The coupling with a p-type metal nano oxide such as CuO prepared via a green protocol is preferable to improve the photocatalytic degradation efficiency of ZnO NPs by inhibiting charge carrier recombination and extending the absorption of light to the visible region, due to the low band gap of the CuO NPs, which is in the visible range (1.2–2.4 eV) and also improved in surface area (Citation13–16).
The earlier reports showed that numerous techniques have been explored and employed for the synthesis of metal oxide-based NCs such as hydrothermal (Citation17), electrochemical (Citation18), wet chemical (Citation19), microwave (Citation17), coprecipitation, sol–gel, precipitation, wet impregnation and thermal decomposition methods (Citation20). However, it has been found that these classical methods involves the use of hazardous toxic and expensive chemicals as capping and reducing agent, which could results in the introduction of toxic by-products into the natural ecosystem. As a result, an alternative synthesis via green templates has received an exceptional attention of the researchers, due to their availability, cost effectiveness and environment friendly nature. Furthermore, the green synthesis method could be performed using various parts of green plants such as roots, stems, flowers, fruits, peels, and their combinations.
Moreover, application of peel extract as a green alternative templete for the preparation of various types of MONPs and MONCs could be the most preferable technique. Green methodology provides more advantages such as in one way the environment is cleaned while using the peels which pollutes the environment once discarded to the environment as a waste and in the other side, those peels could be accessed from the environment with zero cost (Citation21). There is no report on the green synthesis of ZnO/CuO NCs in the presence of extract of Musa acuminata (banana) peel as stabilizing and capping agent in the synthesis of ZnO and ZnO/CuO NCs within various w/w% of CuO NPs for the degradation and decontamination of MB dye. Herein, green protocol was employed to synthesize ZnO and CuO NPs and ZnO/CuO NCs within various volume rations and w/w% of CuO using the extract of Musa acuminata peel followed by the characterization by numerous techniques for the photocatalytic degradation of MB dye under visible light irradiation under various photocatalytic parameters.
2. Materials and methods
2.1. Chemicals and reagents
In this research, different types of reagents and solvents were used; [Zn(CH3COO) 2⋅2H2O] (99% pure), [Cu(NO3)2.3H2O](99% pure), (NaOH 97% pure), ethanol (97% pure), methylene blue dye (99% pure) and distilled water. All those chemicals, solvents, and reagents were of analytical grades and so used without any further analysis and purification process.
2.2. Instruments
The instruments used for the characterization of crystal phase, surface morphology, and optical properties of the synthesized nanomaterials includes X-ray diffraction (XRD-700Shimadzu Co., Japan, λCuK1 = 0.15406 nm, tube voltage 40 kV, current 30 Ma), Fourier transform infrared spectroscopy (FTIR) (FT/IR-6600Co, Jasco), TGA/DTA (DTG-60H Shimadzu Co., South Korea), UV- Vis DRS spectrometer (UV-3600 Shimadzu Co., Japan), scanning electron microscopy (SEM), TEM (HRTEM and SAED) and photoreactor having 400 W Osram lamps.
2.3. Collection and preparation of sample
The Musa acuminata fruit peels were collected from Awash Melkasa agricultural research cneter, Ethiopia. The collected peels were then surface cleaned and washed several times with distilled water to avoid any contaminants ().
Figure 1. Schematic representations of Musa acuminata fruit peel extract.
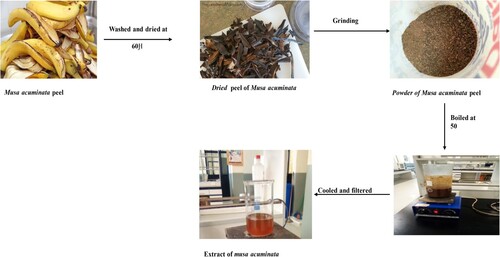
The shadow dried peels were then ground to get powder. Afterwards, 30 g of the fine peel powder was mixed with 300 mL of distilled water with constant stirring for 60 min at 50°C. Later, the mixture was allowed to cool to the room temperature and filtered using Whitman filter paper number 2. The obtained solution was then packed within a glass bottle covered with aluminum foil followed by putting it within a refrigerator at 4°C for further use (Citation22).
2.4. Synthesis of green ZnO NPs
ZnO NPs were synthesized using the extract of Musa acuminata peel via sol-gel method by mixing 4.04 g of zinc (II) acetate dihydrate [Zn(CH3COO)2⋅2H2O] in 66 mL of distilled water to get 0.27 M Zinc solution. This solution was added drop wise into 33 mL of peel extract with constant stirring. After 2 h of stirring, NaOH (1M) solution was added dropwise into the suspension to adjust the pH to 12 and also to enhance the precipitation. Later, the formed suspension was continuously stirred for additional 2 h to maintain the homogenous distribution. The formed suspension mixture was kept for about 24 h in a refrigerator. Then after, the formed gel was centrifuged three times followed by washing with distilled water and ethanol at each consecutive step. Then, the formed (ZnOH)2 NPs were dried in an oven at 60°C for an hour followed by thermal stability analysis and based on this verified result, it was calcined at 500°C for about 2 h (Citation23). The same step was repeated for 0.36 and 0.55 M soultions of zinc acetate while keeping the volume of the peel extract constant. For easy understanding, the synthesized samples were labeled as 1:1, 1:2, and 1:3 indicating 0.27 M, 0.36 M, and 0.55 M solutions of zinc acetate for the same volume of peel extract, respectively. The same procedure was carried out for the green synthesis of CuO NPs, which was performed by dissolving 4.56 g of Cu(NO3)2.3H2O in 66 mL of distilled water while using the same volume of the peel extract.
2.5. Synthesis of green ZnO/CuO NCs
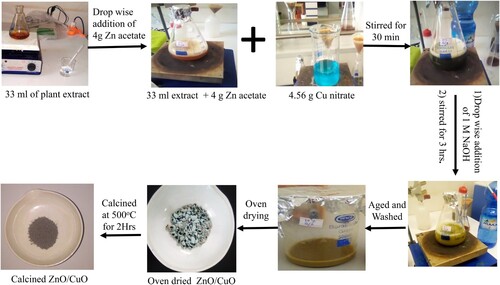
The green synthesis of ZnO/CuO NCs was carried out via the sol–gel method using the peel extract. The preparation of the resulting ZnO/CuO NCs was carried out within different proportions of ZnO and CuO precursor salts such as 10, 15, 20 and 25%. The synthesis of ZnO/CuO (10%) NCs was carried out by dissolving 2.29 g of Zn(CH3COO)2⋅2H2O and 0.337 g of Cu (NO3)2.3H2O in 40 mL of distilled water separately in different beakers. Then after, 40 mL of Zn(CH3COO)2⋅2H2O solution was added drop by drop into the 33 mL of peel extract. After 30 min of continuous stirring, 40 mL copper nitrate solution was then added to the suspension containing 40 mL of Zn(CH3COO)2⋅2H2O solution and 33 mL of peel extract. After an additional 30 min continual stirring, the pH of the solution was adjusted to 12. Then the mixed suspensions were continuously stirred for about 3 h and later allowed to settle for about 24 h at room temperature in a dark. The obtained product was washed with distilled water and ethanol three times at each step of centrifugation. Then, the resulting formed gel was dried in an oven at 60°C and calcined at 500°C for 2 h to obtain the required ZnO/CuO (10%) NCs. For the synthesis of ZnO/CuO NCs with (15%), 20% and (25%) proportions, the quantity of copper nitrate used were 0.53, 0.76, and 1.01 g, respectively for the same amount of Zn(CH3COO)2⋅2H2O and volume of extract (Citation24). The green synthesized NCs were labeled as ZC10, ZC15, ZC20, and ZC25, to represent ZnO/CuO(10%), ZnO/CuO (15%), ZnO/CuO(20%) and ZnO/CuO(25%), respectively. depicts the schematic green synthesis protocol for the ZnO/CuO (20%) NCs.
Figure 2. Schematic green synthesizes representation of ZnO/CuO NCs (20%).
2.6. Photocatalytic experiment
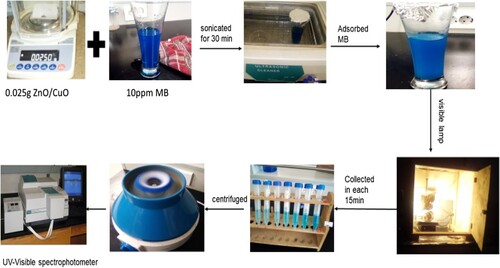
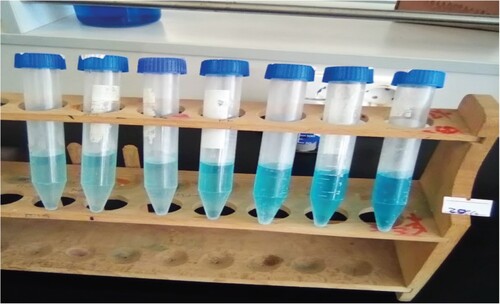
The photocatalytic degration performance of the green synthesized ZnO and CuO NPs and their NCs were evaluated toward MB dye in the presence of visible light (). The degradation of MB dye was carried out in a discontinuous mechanical stirring photoreactor. Before the irradiation of sample begins, 35 mg of catalyst from each type were added to the MB dye solution (0.22 L) individually and sonicated in the dark for about 30 min to reach the adsorption–desorption equilibrium. Afterward, the visible lamp was then switched on and the aliquots of the aqueous suspension were collected from the reactor for every 15 min interval and then centrifuged to remove the precipitated photocatalyst particles setteled at the bottom, as illustrated in . The concentrations of MB were determined from the absorbance of UV-Vis spectrophotometer adjusted to 664 nm. Finally, the percentage of the degradation efficiencies of the green nanocatalysts were calculated using Equation (1) (Citation25).
(1)
(1) where the A0 reperesents the initial absorbance of dye solution, and At represents the dye solution absorbance at a certain reaction time.
Figure 3. Schematic degradation of MB under visible light irradiation in the presence of green nanocatalyst.
3. Results and discussion
3.1. TGA-DTA analysis
The TGA/DTA characterization was performed to determine thermal stability and weight percentages of the synthesized samples and as well to determine the calcination temperature of the NPs. The TGA/DTA curves of the as-prepared ZnO and CuO NPs are displayed in . (a) presents the TGA/DTA curve of ZnO NPs with three basic stages of weight losses. The three endothermic peaks presented by bends labeled as Ed1, Ed2, and Ed3 in the DTA curve. The first weight loss of 5.76% observed at around 80°C and from 140 to 155°C in the TGA curve could be associated to the removal of surface accumulated water molecules and the decomposition of chemically bound groups of bioactive ingridents especially alcohol containing functional groups, respectively. As can be seen in the curve of , the second weight loss (6.4%) is depicted within the range of 175–380°C, which could be accompanied by one endothermic and one strong exothermic peak indicated by bend Ed4 and Ex in the DTA curve; which might be attributed to the decomposition of organic compounds of the peel extract (Citation26). Furthermore, the thermal stability of ZnO NPs was achieved after the third weight loss (0.134%) which was observed between the temperature range of 380–450°C. These weight losses were found to have occurred due to the decomposition of the residual precursors and removal of gases such as CO2 in air during the formation of the ZnO NPs phase. Similar result was reported earlier in the published work (Citation25). Moreover, beyond 450°C, no significant weight losse was observed confirmin the thermal stability of ZnO NPs. The temperature of 450°C was taken as a calcination temperature for ZnO NPs.
Figure 4. (a) TGA-DTA curve of as-synthesized ZnO; (b) CuO NPs.
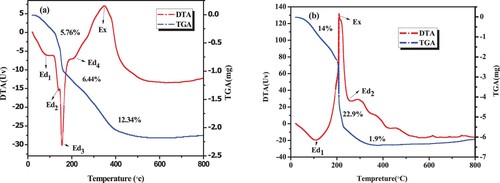
Furthermore, (b) depicts the resulting TGA/DTA curve of green synthesized CuO NPs. The first endothermic peak (Ed1, 80–100°C in DTA curve with 14% of weight loss) is associated with the dehydration of water molecules from the surface of the sample. In the temperature range of 200–350°C, 22.9% of weight loss was observed with strong exothermic and weak endothermic peaks (Ex and Ed2) as presented in the DTA curve. This could be associated with the decomposition of organic compounds from the peel extract (Citation26). Furthermore, the last thermal stability of CuO sample was obsreved after 1.9% of weight loss in the presence of weak endothermic peaks in the temperature range of 350–450°C. Moreover, this peak could ascribes to desorption and subsequent evaporation of some organic molecules with high molecular weight. In the same manner, based on the TGA/DTA analysis, 450°C would be found to be a suitable temperature for the calcination of the formed Cu(OH)2 to get CuO NPs, followed by the synthesis of ZnO/CuO NCs in th presence of the peel extract of Musa acuminata.
3.2. XRD analysis
The crystalline structure and degree of phase purity of the synthesized ZnO NPs, CuO NPs, and ZnO/ZnO NCs were characterized by XRD technique. (a) depicts the XRD pattern of the green synthesized ZnO NPs formed within different volume ratios of precursor salt and peel extract such as 1:1, 1:2, and 1:3. As can be clearly depicted in , all the green ZnO NPs displayed a similar pattern as that of the standard ZnO sample. The diffraction peaks for each of the three volume ratios were located at (100), (002), (101), (102), (110),(103), (100), (112), (20 1), (004), and (202) with its corresponding 2θ values of ≈ 31.83°, 34.49°, 36.32°, 47.60°, 56.67°, 63.52°, 67.60°, 68.03°, and 69.15°, respectively which were found to be in good agreement with the JCPDS of 00-036-1451 (Citation27). This intern confirms the hexagonal wurtzite structure of ZnO and hence the green synthesized ZnO NPs formed were found to be highly pure in the absence of any secondary phase formation (Citation28). Similar results related to the present work were also reported earlier (Citation29), where by the sharp and narrow diffraction peak indicates that the ZnO NPs were well crystalline in structure. However, in the present findings, especially in case of the 1:1, relatively broader peaks were observed, which might be due to the equivalent quanity of the precursor salt and the peel extract; this again results in the formation of ZnO NPs having smaller calculated average crystalline size. The Scherrer’s formula (Equation 2) was applied to calculate the average crystallite size of the prepared samples (Citation30).
(2)
(2) where the K represents the Scherrer’s constant having 0.9 value and λ is the wavelength of the X-ray radiation which is 0.15406 nm, β is peak width at half maximum, and θ is Bragg’s angle. The calculated average crystalline size was estimated as 24.9, 27.8, and 28.3 nm for the 1:1, 1:2, and 1:3 ratios of ZnO NPs, respectively. The synthesized ZnO NPs (with1:1 ratio) was found to possess a small average crystallite size and therefore the precursor concentration 0.27M (1:1) was considered for further studies (for the synthesize of the ZnO/CuO NCs within various compositions in the presence of peel extract).
Figure 5. (a) XRD spectra of synthesized ZnO within (1:1, 1:2, and 1:3) NPs and (b) CuO NPs and ZnO/CuO (10%, 15%, 20% and 25%) NCs.
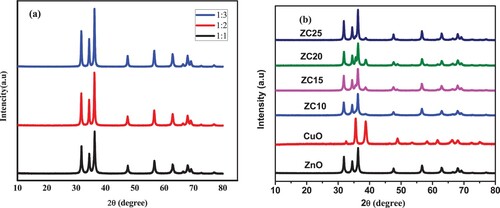
The XRD pattern of the pure ZnO (1:1) NPs, CuO NPs, and ZnO/CuO NCs are presented in (b). As explained in detail in (a), the XRD results of pure ZnO NPs demonstrated the hexagonal wurtzite structure. Similarly, the resulting XRD patterns of pure CuO are presented in (b). The peaks appeared at 2θ values of 32.55°, 35.57°, 38.77°, 48.87°, 53.50°, 58.23°, 61.59°, 66.138°, 68.02°, 72.40° and 75.10° corresponding to the planes (110), (002), (111), (202), (020), (202), (113), (311), (113), (311) and (004), respectively, confirm CuO monoclinic phase which is in compliance with JCPDS of 0481548) (Citation31).
In the case of the ZnO/CuO NCs, in addition to the hexagonal crystalline phase of ZnO, the diffraction peaks of CuO were also observed≈at 2θ values of 32.54,35.57°, 38.7°, 48.84°, 53.48° and 58.16° which corresponds to the (110), (002), (111), (202), (020), and (202), respectively. This intern revealed that the formation of the monoclinic phase for CuO (JCPDS CuO 048-1548) (Citation31). The nanocomposites of ZnO/CuO were found to be pure without any external impurities (Citation32). Furthermore, as can be depicted in (b), both the ZnO and CuO NPs phases are present and the peaks do not affect each other, which confirms the formation of stable ZnO/CuO NCs.
The addition of 10 wt% of copper precursor into the ZnO precursor (ZC10) proved the diffraction peaks of CuO with low intensity attributed due to the low content of CuO in the formed NCs. However, with an increase in the copper content from 15% to 25%, CuO peaks in the ZnO/CuO NCs have been observed with increased intensity. Furthermore, minor shifts were also observed in the 2θ values of ZnO/CuO NCs. The minima shift from 31.84° to 31.76°, 34.49° to 34.41° and 36.32° to 36.23° were also observed, which might presnts that the typical peak of ZnO was changed within the ZnO/CuO NCs. The trivial shifts indicate that the modification of ZnO with CuO can change the structure of ZnO (Citation24). presents the calculated average crystallite size of the synthesized NPs and NCs.
Table 1. Average crystallite size of green synthesized NPs and NCs.
Previously, for synthesized ZnO via microwave-assisted method and the calculated averge cyrtalline size was estimated to be 29 nm (Citation23). However, the synthesized ZnO NPs in the present work exhibited an average crystallite size in the range of 24–28. Likewise Ruan et al. (Citation33) synthesized ZnO/CuO photocatalyst without plant extract and the calculated average crystalline size was estimated within the range of 32–35 nm. However, in the current findings, the calculated average crystallite size of ZnO/CuO NCs was found to in between 22.6 and 22.9 nm; which is too small as compared to the counter parts, synthesized via the chemical method. This was achived due to the presence of different functional groups such as phoneol, kitone, carboxylic acid and flavonoades in peel of Musa acuminate. The existence of those bioactive molecules stabilize particles of ZnO during their growth and formation as an effective template. Similar results have been observed during fabrication of ZnO NPs by using various plant extract (Citation34, Citation35).
3.3. SEM analysis
The morphological characterization of ZnO NPs, CuO NPs, and their NCs was carried out using SEM micrographs. (a–h) represents the SEM images of the green synthesized ZnO (1:1, 1:2, and 1:3) NPs, CuO NPs, and ZnO/CuO (10%, 15%, 20% and 25%) NCs.
Figure 6. SEM image of ZnO NPs (1:1, 1:2, and 1:3) represented by (a), (b), and (c), respectively, CuO NPs (d), ZnO/CuO NCs (10%, 15%, 20% and 25%) represented by (e), (f), (g) and (h), respectively, which was synthesized in the presence of Musa acuminata peel extract.
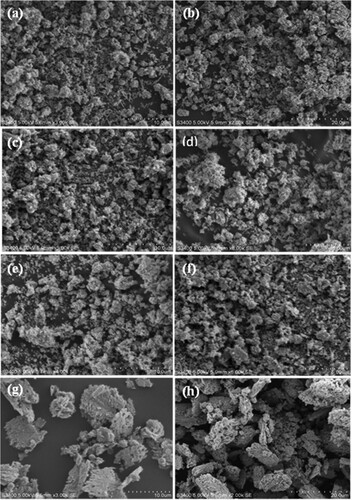
(a–c) depicts the SEM images of the synthesized ZnO NPs. The SEM images showed clear crystals of spherical shape in which the particles are inclined together and polydispersed due to the presence of numerous bioactive phytochemicals in the plant extract which prevents the overgrowth followed by stabilization of the ZnO nanoparticles (Citation36). Among the three ratios of ZnO NPs, ZnO (1:1) NPs provides a more homogenized shape due to the well bi-association of molecules of Musa acuminata peel extract with the Zn2+ ions during the synthesis process; and again, this prevents from the formation of aggregation. Moreover, eventhough the spherical shape is dominant in all of the ZnO NPs, rod shaped structure is also observed, which is in compliance with the results reported earlier (Citation37). (d) displays the SEM image of the CuO NPs. The SEM image proves the presence of well polydispersed, spherical shaped distribution of CuO NPs with clear distribution of particles. In addition to this, the image shows the effect of biomolecules of the peel due to the existence of some aggregation/agglomeration (Citation38). The agglomeration actually develops as a result of the self-organization of tiny structures, which could be caused by CuO NPs.
(e–h) showed the SEM images of ZnO/CuO NCs containing various wt% of CuO. The nanocomposites were found to possess spheroid and rice grains like morphology. The synthesized nanocomposites exhibited low levels of agglomeration without the formation of big clusters (Citation24). It has been observed that as the wt% of CuO is increased in the presence of the peel extract, the ZnO/CuO particles were accumulated as particles on the surface that resembles a sponge. This agglomeration might be brought on by densification, which would leave little room between the particles and this could be also attributed by the narrow pores size of the ZnO NPs.
3.4. TEM and HR-TEM analysis
(a–c) and (d–f) displays the TEM and HRTEM images of the ZnO (1:1) NPs, CuO NPs, and ZnO/CuO (20%) NCs, respectively. (a) contains the TEM micrograph of ZnO (1:1) NPs. Moreover, (a) indicates that the ZnO NPs possess quasi-spherical shape and irregular shapes. In the sample, there is a low level of agglomeration that creates a cluster-like structure. Individual particles are also present in the images which proves the role of the peel extract, confirming the formation of green ZnO NPs catalysts (Citation39). The particle sizes of ZnO NPs were found to be around 20 nm. (b) showed the resulting TEM micrograph of CuO NPs. The TEM micrograph (100 nm resolution) revealed that the particles are polydispersed, spherical and less-agglomerated. The polydispersion of the particles is a confirmation of the role of the peel extract, which was also confirmed from the thermal and SEM analysis (Citation40).
Figure 7. TEM micrograph of (a) ZnO (1:1) NPs, (b) CuO NPs, (c) ZnO/CuO (20%) NCs, (d) HRTEM image of ZnO (1:1) NPs, (e) HRTEM image of CuO NPs and (f) HRTEM image of ZnO/CuO (20%) NCs.
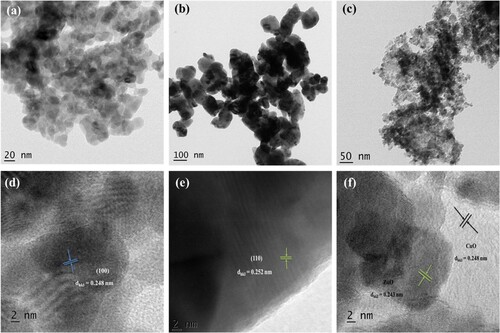
Furthermore, (c) depicts the TEM image of ZnO/CuO (20%) NCs. As can be seen from (c), the NCs showed spherical shape with less agglomeration and polydispersed surface. Moreover, the image showed relatively homogenized surface as compared to the individual metal oxides due to the insertion of CuO into the pore size of ZnO NPs in addition to the presence of the peel extract.
(d–f) depicts the HRTEM image of the ZnO (1:1) NPs, CuO NPs, and ZnO/CuO (20%) NCs, respectively. The presence of particles having d-spacing values of 0.248 and 0.252 nm confirmed the formation of crystalline ZnO and CuO NPs, respectively. The HRTEM image of ZnO/CuO (20%) NCs with a clean nanocrystalline surface was also displayed in (f). The image also demonstrates the presence of tiny and porous particles. The image also demonstrates the creation of a heterojunction between ZnO and CuO, with the lattice spacing of the (100) and (110) planes of ZnO matching at 0.243 and 0.248 nm, respectively (Citation41). Furthermore, (f) demonstrates the presence of the defect sites between the fringes, which are caused by the coupling phenomenon. Hence, the HRTEM results shows that the strongly anchored surfaces in the green ZnO and CuO NCs with a small mismatched lattice.
3.5. SAED analysis
The crystalline nature of the green ZnO (1:1), CuO NPs and ZnO/CuO (20%) NCs was analyzed using the selective area electron diffraction (SAED) pattern analysis, as represented in (a–c), respectively.
Figure 8. SAED pattern of (a) ZnO (1:1) NPs, (b) CuO NPs, and (c) ZnO/CuO (20%) NCs.
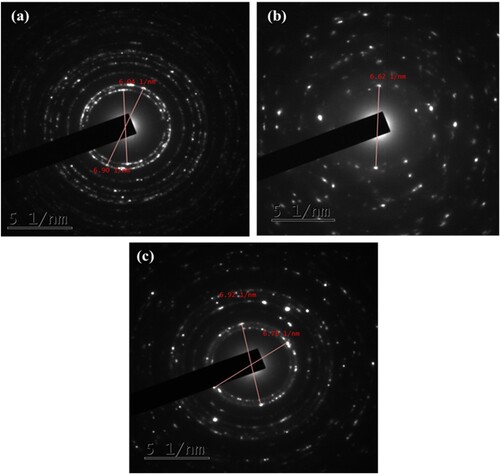
Moreover, the presence of a bright spot in the center of the SAED pattern within (a–c), confirms the polycrystalline nature as well as nanocrystalline nature of ZnO (1:1), CuO NPs and ZnO/CuO (20%) NCs. In addition to (100) and (110) planes of hexagonal ZnO NPs and lattice planes of monoclinic CuO NPs within the XRD analysis, the same phenomenon was also observed in the SAED pattern, which again strongly confirms the formation of green ZnO/CuO (20%) NCs. In all of the NPs and NCs, the presence of the ring like diffraction pattern is also another confirmation of nanocrystalline formation (Citation42). Therefore, based on the SEM, TEM, HRTEM and SAED analysis, it is possible to deduce the formation of ZnO (1:1) NPs, CuO NPs and ZnO/CuO (20%) NCs by the application of Musa acuminata peel waste extract.
3.6. UV-DRS analysis
The optical absorption properties of the as-prepared NPs and NCs were evaluated by using UV-DRS method (a–d). (a) depicts the absorption spectra of the ZnO NPs with different concentration of zinc precursor. With an increase in zinc acetate content, it was seen from the spectra that the strength of light absorption by the resulting ZnO NPs increases from 387 nm to 400 nm. The increase in the absorption intensity is directly attributed to the increase in the crystalline size with precursor concentration, as revealed in similar kind of reports (Citation43). Tauc plot was used to determine the band gap (Eg) of ZnO NPs, as illustrated in (b). The Eg vales of ZnO (1:1, 1:2, and 1:3) NPs and CuO NPs as well ZnO/CuO (10–25%) NCs were deduced using the Kubelka–Munk theory (Equations 3 and 4).
(3)
(3)
(4)
(4) where R = percentage of reflected light, h = planck constant, v = incident light frequency, n = power index related to the characteristic transition in a semiconductor, and A = constant depending on transition probability (Citation44).
Figure 9. (a) UV-Vis DRS spectra of ZnO NPs; (b) Tauc plot of ZnO NPs; (c) UV-Vis DRS spectra of ZnO NPs, CuO NPs, and ZnO/CuO NCs; (d) Tauc plot of ZnO NPs, ZnO/CuO NCs and that of CuO NPs in the inset.
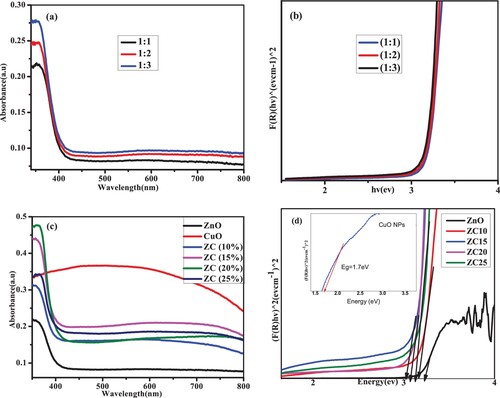
The Eg values of ZnO NPs were found to be 3.24, 3.25 and 3.24 eV for the 1:1, 1:2, and 1:3 ratios, respectively. The result is in close agreement with the values reported by the researches in the past studies (Citation45, Citation46). All of the synthesized ZnO NPs have Eg values that are lower than the Eg of bulk ZnO (3.37 eV). The quantum confinement effect is responsible for the drop in band gap energy (Citation47). In addition, the variation in band gap energy of the synthesized ZnO NPs within various volume ratios is due to the variation in the amount of extract and precursor salt. Since, as the amount of extract added into the precursor salt is increased, the optical property of the formed NPs will be decreased and so light absorption behavior also altered. Moreover, (c) depicts the absorption spectra of the ZnO NPs, ZC(10%), ZC(15%), ZC(20%) and ZC (25%) NCs and CuO NPs.
As can be clearly presented in the graph, ZnO and CuO NPs displayed significant absorption peaks around 390 nm. However, the band edges of the NCs’ peaks have been red shifted, suggesting the presence of CuO, which expands the band gap of ZnO and causes the band edge of the NCs to extend into the visible range. When compared to pure ZnO NPs, the absorption intensities of ZC NCs were found to be higher. Further investigation shows that the absorbance in the visible and UV light regions rises with Cu dose, as well as all the advantages of the synergistic interaction between CuO and ZnO. It is evident that adding the right quantity of CuO to ZnO causes the optical absorption edge to shift to the right, which may be caused by the strong interfacial interaction between ZnO and CuO NPs (Citation48). The photo-catalytic degradation of MB dye would depend on the development of red-shift in absorption.
(d) illustrated the Tauc plots of ZnO NPs, ZC(10%), ZC(15%), ZC(20%), ZC(25%) NCs and CuO NPs. The values were found to be 3.25, 3.22, 3.21, 3.18, 3.16 and 1.7 eV for ZnO NPs, ZC(10%), ZC(15%), ZC(20%), ZC(25%) NCs and CuO NPs respectively. The obtained result is identical to the the reported values in the earlier work (Citation25, Citation49). The creation of the interfacial contact between ZnO NPs and CuO NPs was attributed to the observed band gap narrowing with the loading of CuO content (Citation50) and also due to ZnO NPs network defects as a result of incorporation of CuO (Citation51).
The oxide semiconductor's narrower band gap suggests simpler electron excitation from the valence band to the conduction band. The fact that the band gaps of ZnO/CuO NCs become low while those of green produced ZnO NPs are comparatively high demonstrates that an increase in CuO ratio in the NCs causes a real decrease in the band gap energy. Due to the presence of biomolecules from the leaf extract, ZnO/CuO (15%) and ZnO/CuO (20%) NCs displayed high absorption in the visible range.
3.7. FTIR analysis
In order to inspect the role of the peel extract in the synthesis of NPs and NCs, FTIR spectral characterization was employed. The FT-IR spectra of the peel extract and the prepared NPs and NCs are shown in . The FT-IR spectra of Musa acuminata peel extract, NPs, and NCs showed a broad absorption band within the range of 3400–3700 cm−1, corresponding to O-H vibration (Citation52), from the phytochemicals of polyphenols, alkaloids and flavonoids of the peel extract (Citation53). This intern confirms the availability of various capping and reducing bioactive molecules within the peel of Musa acuminata. Furthermore, the peel extract of musa acuminata displayed carbonyl groups (C = O), C = C aromatic and C–N stretching groups. All of the absorption bands indicate the existence of secondary metabolite chemicals in the peel waste extract. The FTIR bands at 2854 and 2922 cm−1 corresponds to C–H vibrations in CH2 and CH3 groups, respectively (Citation54). The weak band presented at around 2280 cm−1 is due to the C–H stretching of aldehyde molecules (Citation55). Additionally, at 1637 and 1411 cm−1, respectively, the alcohol absorption peaks for carbonyl C = O stretching and O-H bending were noted (Citation27). According to Fardood, Ramazani et al. (Citation56), the peaks around 1086 and 1040 cm−1 were caused by the C–O stretching in secondary alcohol and the C–N stretching modes of aliphatic amines, respectively.
Figure 10. FTIR spectra of BP extract, uncalcined ZnO and CuO NPs, calcined ZnO and CuO NPs and ZnO/CuO (20%) NCs.
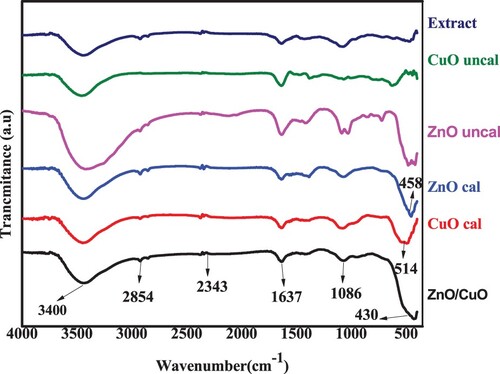
These peaks might also relate to the anti-symmetric stretching vibration of NO3-, caused by the precursor groups. Additionally, faint bands at wavelengths of 730–630, 830, and 960 cm−1 may be related to the C = C bending vibrations of unsaturated hydrocarbons found in the peel extract (Citation46). The Zn-O bond is ascribed to the absorption peaks at 458 and 410 cm−1 in both calcined and uncalcined ZnO samples, in accordance with earlier research (Citation57). Both calcined and uncalcined CuO samples have peaks at 544–486 cm−1 that are attributed to the Cu-O stretching band (Citation58).
The peak that was visible for the ZnO/CuO NCs between 543 and 430 cm−1 corresponds to the combined Zn-O and Cu-O bond absorptions. The shift of wavenumber at 458–400 cm−1 (Zn-O bond) was observed as the CuO is added to ZnO. The shift of wavenumber indicats that the addition of CuO may change the structure of ZnO NPs and also may alter other physicochemical property too. This may not implies that the green synthesized NPs and NCs are impure, instead the analysis confirms the role of the extract used during the synthesis process as green alternative template.
3.8. Photocatalytic degradation test
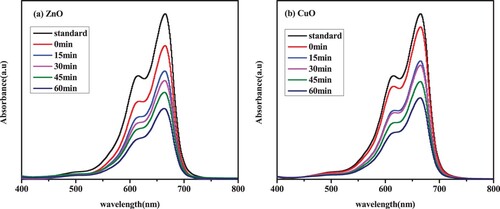
For the photocatalytic degradation of MB dye in the presence of visible light irradiation, the photocatalytic efficacy of green ZnO, CuO, and ZnO/CuO nanocatalysts was examined. The absorption spectra for the degradation of MB dye solution under visible light in the presence of single green nanocatalysts made of ZnO and CuO are shown in a and b, respectively. The bare ZnO nanocatalyst showed photocatalytic efficiency of 57%, which can be attributed to the presence of number of oxygen vacancies on the ZnO catalyst surface (Citation59), but the lower photocatalytic activity (50%) of CuO reveals the faster recombination of photo generated electrons and holes.
Figure 11. MB dye degradation under visible light irradiation in the presence of (a) ZnO and (b) CuO green nanocatalysts.
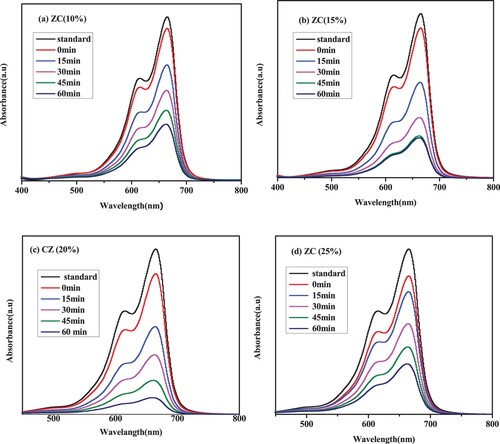
According to , all the ZnO/CuO catalysts outperformed the pure ZnO and CuO nanocatalysts in terms of photocatalytic efficiency. Copper oxide, which functions as an electron trap and prevents e-/h+ recombination, may be related to the increased photocatalytic activity of ZnO/CuO NCs.
Figure 12. MB dye degradation under visible light irradiation in the presence of (a) ZC10, (b) ZC15, (c) ZC20 and (d) ZC25 green NCs catalyst.
Furthermore, the band coupling between ZnO and CuO causes the two semiconductors to be effectively segregated from one another, which allows the synergistic impact of ZnO and CuO green nanocatalysts to increase the photocatalytic activity (Citation60). Additionally, the enhanced photocatalytic performance of CuO/ZnO NCs is due to their combined utilization of the visible light and UV light.
3.8.1. Effect of CuO green nanocatalyst loading
Previous studies have claimed that CuO loading in CuO/ZnO NCs can be optimized (Citation61, Citation62). The degradation rate of MB was found to rise with increasing CuO loading, as shown in (a–d), which displays the reduction of MB dye solution under visible light utilizing green ZnO/CuO photocatalyst with the various CuO loadings ranging from 10 to 25% into the host ZnO NPs.
Also shown in (a), the degradation efficiency was found to be higher with CuO loading up to a 20% CuO amount and lower with higher CuO amounts (25%).
The photocatalytic efficiency of ZnO-CuO NCs for the degradation of MB dye was observed to increase with increase in wt% of CuO NPs from 10% to 20%. But, further increase in wt% of CuO NPs beyond 20%, results in decrease in photocatalytic performance. The probable reason behind this improvement in photocatalytic performance by the composite with increasing CuO concentration up to 20% is because of structural effects such as larger surface area and porous structural nature of ZnO NPs that might facilitate mass transfer and diffusivity of MB dye. In addition, during light irradiation, the interface between ZnO and CuO in NCs acts as p-n junction, as a result electron–hole recombination would be reduced; splitting of electron–hole pairs into free electrons and holes would be fostered and concentration of active hydroxyl radical generation could be increased for efficient photocatalytic degradation (Citation63–69).
Further increase in loading of CuO NPs (overdose of CuO NPs) in ZnO-CuO NCs beyond 20% leads to decrease in the efficiency of photocatalytic degradation of the dye. This is probably because, the highly porous surface structure of the host material (ZnO NPs) could be occupied (blocked) by loaded CuO NPs; and further increased in amount of CuO NPs (beyond 20%) in ZnO-CuO NCs could not have enough porous sites for loading and optimum interactions between ZnO and CuO NPs. As a result, the performance of the composite with 25% of CuO loading is lower than that of the composite with 20% CuO loading (Citation70, Citation71). This indicates that the CuO to ZnO ratio in the CuO/ZnO NCs is crucial for the photocatalytic breakdown of MB dye when exposed to visible light, also supported in , which indicates the color fading of MB obtained using ZC20.
Figure 13. MB dye color fading upon addition of green ZC20 catalyst.
The rate constant for the synthesized green nanocatalyst is determined by the plot of ln(C/Co) vs irradiation time, as shown in (b,c). The rate constant values of ZnO, CuO, ZC nanocatalysts are presented in . The ZC20 has the greatest degradation constant among ZC green catalysts (0.036/min) as can be depicted in and , which is around five times greater than that of pure green ZnO catalyst (0.007/min).
Figure 14. (a) MB dye degradation using green catalysts; (b) kinetics of MB dye degradation; (c) rate constant of MB dye degradation.
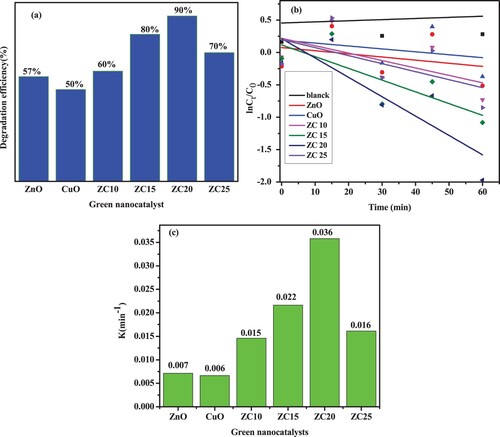
Table 2. Rate constant and degradation efficiency of ZnO, CuO, and ZnO/CuO green nanocatalysts-based MB dye under visible light irradiation.
Table 3. Calculated first order kinetic data model.
3.8.2. Effect of solution pH
In the past, it has been extensively documented that the pH of the dye solution has a substantial impact on the photodegradation reaction in the presence of efficient green nanocatalysts. This is because the interaction between the catalyst and the pollutant varies depending on the medium. In this experiment, 35 mg of green NCs catalysts made of 20% ZnO and 10 m*g/L MB were subjected to visible light irradiation, as supported in . At pH 4, 7, and 10, the photocatalytic activity was assessed using 1 M NaOH and 1 M HCl serving as pH adjusters.
Figure 15. Photodegradation rate kinetics of MB dye at a, different pH and b, corresponding degradation efficiency.
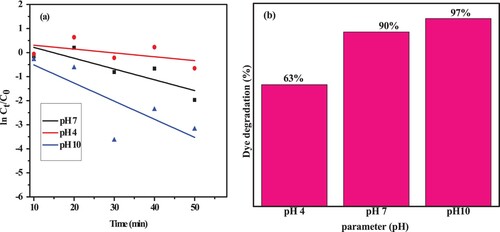
The degradation efficiency of MB in the presence of the NCs green catalyst was found to be poor under acidic conditions, as shown by (a,b). However, the degradation ability of the samples steadily increases from 63% to 97% with K values of 0.0161, 0.031, and 0.050/min when the pH rises to neutral and alkaline values. This is based on how electrostatic interactions between molecules of MB and catalyst surfaces vary depending on the pH. In an alkaline medium, the surface of the resultant NCs catalyst is negatively charged, whereas in an acidic solution, it is positively charged. MB is a cationic dye, therefore when it dissolves in water, its structure becomes positively charged. Therefore, it comes as no surprise that the degradation rate of MB is higher in alkaline media due to an increase in opposite-charge interactions between the solution and the catalyst made of green NCs (Citation72).
3.8.3. Effect of green nanocatalyst dosage
By varying the amount of photocatalyst as 10, 25, 35, and 50 mg under neutral conditions with an initial MB concentration of 10 mg/L, the effect of the photo-catalyst dosage on the degradation of MB dye using various ZnO/CuO NCs catalysts was examined. The outcomes are shown in (a,b). The reaction rate and MB degradation efficiency were both accelerated by increasing the photo catalyst dosage from 10 mg to 35 mg, as seen on the lnC/Co ((a) and dye degradation bar graphs in (b)).
Figure 16. (a) Photodegradation rate kinetics of MB with various ZnO/CuO (20%) NCs catalyst dosage; (b) corresponding degradation efficiency.
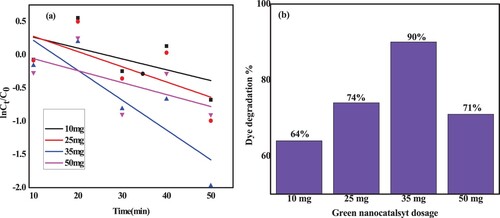
On the other hand, the degradation efficiency was found to drop with larger photocatalyst dosages (50 mg). The theory put out to explain this result is that as photocatalyst concentration grows, more active sites or accessible surface area become available, increasing the amount of hydroxyl and superoxide radicals as a result. However, the transparency of the solution declines as the amount of solid catalyst rises. Some particles in the suspension are shielded from light by scattering, making some photocatalytic surfaces inaccessible to light absorption (Citation73). Due to the suspension's increased opacity, the degradation efficiency was found to decline.
3.8.4. Effect of initial concentration of MB dye
By employing MB concentrations of 5, 10, and 20 mg/L in the presence of 35 mg of ZC photocatalyst under neutral conditions, the influence of the initial MB concentration was examined. The results are shown in (a,b). The findings demonstrated that when MB dye concentrations was raised from 5 to 20 mg, the degradation efficiency was found to be very high at low concentrations and subsequently declines.
Figure 17. (a) Photodegradation rate kinetics of MB using ZC green catalyst with various initial dye concentrations and (b) corresponding photocatalytic degradation efficiency.
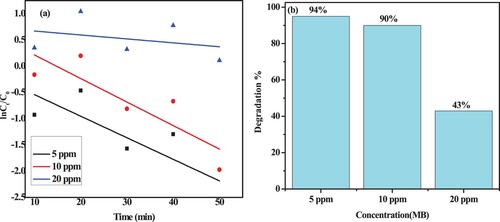
Increasing the dye molecules could block more active sites available for light absorption and lessen the interaction of light with these sites for *OH generation because the rate of degradation is proportional to the number of hydroxyl radicals and superoxide ions (*OH/O-) formed at the photo catalysts surface. The impact of light irradiation on the breakdown of the MB dye is another explanation for this finding. A large quantity of light can be absorbed by the dye molecules rather than the photocatalysts at high MB dye concentrations. As a result, the production of hydroxyl radicals (*OH) and superoxide ions (*O-), as well as the activity of the photocatalyst, were reduced (Citation74–76).
3.8.5. Mechanism of MB dye photodegradation
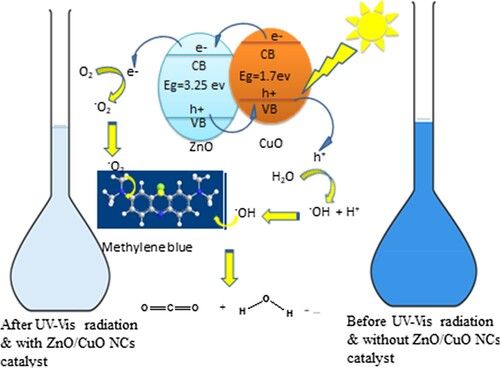
Both the valence band (VB) and conduction band (CB) of CuO resides above than ZnO, which is thermodynamically favorable for the transfer of electrons and holes between them. This makes ZnO and CuO green nanocatalysts useful for charge carrier transfer. An electron starts to excite from VB to CB as soon as a semiconductor absorbs visible light, creating holes in VB. As ZnO's VB and CB are lower than CuO's, electrons begin to move from the higher level CB of CuO to the lower level CB of ZnO, while photoinduced holes begin to move in the opposite direction from the VB of ZnO to the CB of CuO at the interface of the ZnO/CuO hetero-junction. This causes the CB of ZnO, which is employed for the reduction of MB, to accumulate additional electrons. Such an electron transfer prevents electron–hole pairs from recombining to the same extent, increasing the effectiveness of photodegradation. Superoxide radicals (O2.) were created when the electrons in the CB of ZnO were captured by the molecular oxygen on its surface. While the hydroxide ion with formation of active species, i.e. hydroxyl radicals, caught the photo-induced holes in the VB. The complete mineralization of MB in CO2 and H2O results from these free radicals reacting with MB (Citation77).
From the data of Tauc plot, Eg values of ZnO and CuO, were calculated to be 3.25 eV and 1.7 eV, respectively, and the electron affinities of ZnO and CuO are 4.35 eV and 4.07 eV, respectively as reported (Citation78, Citation79). The facile transfer of electron from CuO NPs (a p-type semiconductor) to ZnO NPs (n-type semiconductor), improves the performance of ZnO/CuO NCs in the photocatalytic degradation of MB dye (Citation67, Citation80, Citation81).
Based on these findings, a possible photocatalytic mechanism for the degradation of MB under visible light irradiation was suggested and shown in . The proposed mechanism was supported by a stepwise photocatalytic reactions presented in Equations (5–10).
(5)
(5)
(6)
(6)
(7)
(7)
(8)
(8)
(9)
(9)
(10)
(10)
Figure 18. Schematic diagram for photodegradation mechanism of MB dye by ZC green nanocatalysts.
MB when contact with or
intermediates
harmless products +CO2+H2O
3.8.6 Reusability of ZnO-CuO (ZC) nanocomposites
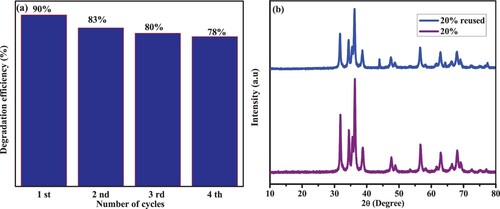
Because a large cost reduction on the treatment of dye effluent is essential, the lifespan and stability of the photocatalysts are critical aspects of the photocatalytic process. Therefore, the photocatalysts’ capacity for reuse was assessed. By centrifugation and repeated water washings, ZC20 NCs were removed from the solution in this experiment.
Four repeated trials made use of the recycled nanocomposite as photocatalysts. After each run, the photocatalyst was refilled with the same amount of new MB to assess the stability. The results are summarized in (a), which shows that a drop in the efficiency from 90% (1st run) to 78% (4th run) of the samples. These results indicate that ZC20 NC is effective and reusable under visible light. Additionally, the catalyst underwent XRD after four cycles, with the findings shown in (b). The diffraction peaks of the ZC20 NCs are comparable before and after many catalytic reaction cycles, according to the XRD data, indicating that ZC20 is resistant to photocorrosion (Citation82–84).
Figure 19. (a) Degradation of MB in four cycles under visible irradiation; (b) XRD result of ZC20 photocatalyst after reused four times.
4. Conclusion
In the present findings, ZnO NPs, CuO NPs and CuO/ZnO NCs were effectively synthesized by a green method using the extract of Musa acuminate fruit peels. The synthesized NPs and NCs were characterized by various techniques followed by investigating on the photo catalytic degradation of MB under visible light irradiation. The thermal study revealed that the peel assisted synthesized NPs are stable above 450°C The XRD analysis proves that the peel mediated synthesized ZnO/CuO NCs showed smaller average crystallite size as compared to ZnO NPs and CuO NPs. The optical property of the NPs and NCs were dealt with UV-Vis DRs technique and the band gap energies of the composites were found to increase as compared to the individual NPs. The role of Musa acuminata peel was verified by FTIR technique and the analysis indicates the presence of various bioactive molecules such as ketones, saturated and unsaturated hydrocarbons, flavonoids, phenolic groups, and carboxylic groups and also the formation of ZnO NPs, CuO NPs, and their composites. Under varied conditions, the degrading effectiveness of the synthesised nanocatalysts was examined on the MB dye. The band coupling between ZnO and CuO and the better source utilization allowed the CuO/ZnO nanocomposite catalysts to significantly outperform the single ZnO NPs and CuO NPs catalysts in terms of photocatalytic performance. The optimum concentration of CuO, (20 w/w %) exhibited an improved photocatalytic activity which is five times higher than that of pure ZnO. It is discovered that the photocatalytic performance is greatly influenced by the pH of the dye solution, dye solution starting concentration, catalyst loading, and the amounts of CuO in the nanocomposites.
Data availability statement
The research data used to support the findings of this study are included in the article.
Disclosure statement
We authors confirm that there is no potential or apparent conflict of interest among authors regarding this study and related publication.
Additional information
Funding
References
- Rafiq, A.; Ikram, M.; Ali, S.; Niaz, F.; Khan, M.; Khan, Q.; Maqbool, M. Photocatalytic Degradation of Dyes Using Semiconductor Photocatalysts to Clean Industrial Water Pollution. J. Ind. Eng. Chem. 2021, 97, 111–128.
- Jokar, M.; Mirghaffari, N.; Soleimani, M., Jabbari, M. Preparation and Characterization of Novel bio ion Exchanger from Medicinal Herb Waste (Chicory) for the Removal of Pb2+ and Cd2+ from Aqueous Solutions. J. Water Proc. Eng. 2019, 28, 88–99.
- Wu, Y.-H.; Wang, Y.-H.; Xue, S.; Chen, Z.; Luo, L.-W.; Bai, Y.; Tong, X., Hu, H.-Y. Increased Risks of Antibiotic Resistant Genes (ARGs) Induced by Chlorine Disinfection in the Reverse Osmosis System for Potable Reuse of Reclaimed Water. Sci. Total Environ. 2022, 408, 152860–152870.
- Modi, A.; Jiang, Z.; Kasher, R. Hydrostable ZIF-8 Layer on Polyacrylonitrile Membrane for Efficient Treatment of Oilfield Produced Water. J. Chem. Eng. 2021, 408, 133513–133525.
- Yang, E.; Chae, K.-J.; Choi, M.-J.; He, Z., Kim, I.S. Critical Review of Bioelectrochemical Systems Integrated with Membrane-Based Technologies for Desalination, Energy Self-Sufficiency, and High-Efficiency Water and Wastewater Treatment. Desalination 2019, 452, 40–67.
- Zhang, X.; Ren, P.; Zhou, J.; Li, J.; Li, Z., Wang, D. Formation of Disinfection Byproducts in an Ammonia-Polluted Source Water with UV/Chlorine Treatment Followed by Post-Chlorination: A Pilot-Scale Study. Environ. Techn. Innov. 2022, 26, 102266–102277.
- Amiri, Z.; Moussavi, G.; Mohammadi, S., Giannakis, S. Development of a VUV-UVC/Peroxymonosulfate, Continuous-Flow Advanced Oxidation Process for Surface Water Disinfection and Natural Organic Matter Elimination: Application and Mechanistic Aspects. J. Hazard. Mater. 2021, 408, 124634–124648.
- Long, Z.; Wang, H.; Huang, K.; Zhang, G., Xie, H. Di-functional Cu2+-Doped BiOCl Photocatalyst for Degradation of Organic Pollutant and Inhibition of Cyanobacterial Growth. J. Hazard. Mater. 2022, 424, 127554–127566.
- González-González, R.B.; Parra-Arroyo, L.; Parra-Saldívar, R.; Ramirez-Mendoza, R.A.; Iqbal, H.M.N. Nanomaterial-based Catalysts for the Degradation of Endocrine-Disrupting Chemicals-A way Forward to Environmental Remediation. Mater. Lett. 2022. 308, 131217–131231.
- Chen, S.; Chen, S.; Li, S.; Xiong, L.; Wang, G. In-situ Growth of ZnIn2S4 Decorated on Electrospun TiO2 Nanofibers with Enhanced Visible-Light Photocatalytic Activity. Chem. Phys. Lett. 2018, 706, 68–75.
- Tahir, M.; Tasleem, S.; Tahir, B. Recent Development in Band Engineering of Binary Semiconductor Materials for Solar Driven Photocatalytic Hydrogen Production. Int. J. Hydrogen Energc 2020, 45 (32), 15985–16038.
- Selvaraj, R. A type-II MoS2/ZnO heterostructure with enhanced photocatalytic activity. Mater. Lett. 2019, 243, 183–186.
- Parekh, Z.R.; Chaki, S.H.; Hirpara, A.B.; Patel, G.H.; Kannaujiya, R.M. CuO Nanoparticles-Synthesis by wet Precipitation Technique and its Characterization. J. Condens. Matter. Phys. 2021, 610, 412950.
- Asif, N.; Nisar, A.; Saeed, M.; Muneer, M.; Usman, M., Khan, I., Synthesis and Characterization of ZnO Decorated Reduced Graphene Oxide (ZnO-rGO) and Evaluation of its Photocatalytic Activity Toward Photodegradation of Methylene Blue. Environ. Sci. Pollut. Res. 2022, 29, 418–430.
- Muhammad, S.; Saeed, M.; Muneer, M.; Haq, A.U.; Akram, N. Photocatalysis: An Effective Tool for Photodegradation of Dyes—a Review. Environ. Sci. Pollut. Res. 2022, 29, 293–311.
- Muhammad, S.; Saeed, M.; Usman, M.; Muneer, M.; Akram, N.; Haq, A.U.; Tariq, M.; Akram, F. Synthesis Of Ag-Fe3O4 Nanoparticles for Degradation of Methylene Blue In Aqueous Medium. Bull. Chem. Soc. Ethiop. 2020, 34 (1), 123–134.
- Liu, X.; Lu, X.; Guan, H.; Liu, X.; Wang, Y.; Zhao, D. Controllable Synthesis of Flower-Like ZnO Modified by CuO Nanoparticles/N-RGO Composites for Efficient Microwave Absorption Properties. Ceram. Int 2021.
- Uma, H.B.; Ananda, S.; Kumar, M.V. Electrochemical Synthesis and Characterization of CuO/ZnO/SnO Nano Photocatalyst: Evaluation of its Application Towards Photocatalysis, Photo-Voltaic and Antibacterial Properties. Chem. Data Collect 2021, 32, 100658–100670.
- Wang, X.; Deng, M.; Zhao, Z.; Zhang, Q.; Wang, Y. Synthesis of Super-Hydrophobic CuO/ZnO Layered Composite Nano-Photocatalyst. J. Mater. Chems 2022, 276, 125305.
- Nami, M.; Sheibani, S.; Rashchi, F. Photocatalytic Performance of Coupled Semiconductor ZnO-CuO Nanocomposite Coating Prepared by a Facile Brass Anodization Process. Mater. Sci. Semicond. Proc. 2021, 135, 106083–106096.
- Singh, A.K. A Review on Plant Extract-Based Route for Synthesis of Cobalt Nanoparticles: Photocatalytic, Electrochemical Sensing and Antibacterial Applications. CRGSC, 2022, 5, 100270–100278.
- Savitha, D.; Latha, H.K.E.; Lalithamba, H.S.; Mala, S.; Jeppu, Y.V. Structural, Optical and Electrical Properties of Undoped and Doped (Al, Al+ Mn) ZnO Nanoparticles Synthesised by Green Combustion Method Using Terminalia Catappa Seed Extract. Mater. Today 2022.
- Mohammadi-Aloucheh, R.; Habibi-Yangjeh, A.; Bayrami, A.; Latifi-Navid, S., Asadi, A. Green Synthesis of ZnO and ZnO/CuO Nanocomposites in Mentha Longifolia Leaf Extract: Characterization and Their Application as Anti-Bacterial Agents. J. Mater. Sci. 2018, 29 (16), 13596–13605.
- Yulizar, Y.; Bakri, R.; Apriandanu, D.O.B.; Hidayat, T. ZnO/CuO Nanocomposite Prepared in one-pot Green Synthesis Using Seed Bark Extract of Theobroma Cacao. Nano-Struct. Nano-Objects 2018, 16, 300–305.
- Cahino, A.M.; Loureiro, R.G.; Dantas, J.; Madeira, V.S.; Ribeiro Fernandes, P.C. Characterization and Evaluation of ZnO/CuO Catalyst in the Degradation of Methylene Blue Using Solar Radiation. Ceram. Int. 2019, 45 (11), 13628–13636.
- Bayrami, A.; Parvinroo, S.; Habibi-Yangjeh, A.; Rahim Pouran, S. Bio-extract-mediated ZnO Nanoparticles: Microwave-Assisted Synthesis, Characterization and Antidiabetic Activity Evaluation. Artif. Cells. Nanomed. Biotechnol. 2018, 46 (4), 730–739.
- Adhikari, S.P.; Pant, H.R.; Kim, J.H.; Kim, H.J.; Park, C.H.; Kim, C.S. One pot Synthesis and Characterization of Ag-ZnO/g-C3N4 Photocatalyst with Improved Photoactivity and Antibacterial Properties. Colloids Surf. A 2015, 482, 477–484.
- Ibrahim, H.M. Green Synthesis and Characterization of Silver Nanoparticles Using Banana Peel Extract and Their Antimicrobial Activity Against Representative Microorganisms. J. Radiat. Res. Appl. Sci. 2015, 8 (3), 265–275.
- Elumalai, K.; Velmurugan, S. Green Synthesis, Characterization and Antimicrobial Activities of Zinc Oxide Nanoparticles from the Leaf Extract of Azadirachta Indica (L.). Appl. Surf. Sci. 2015, 345, 329–336.
- Gawade, V.; Gavade, N.L.; Shinde, H.M.; Babar, S.B.; Kadam, A.N.; Garadkar, K.M. Green Synthesis of ZnO Nanoparticles by Using Calotropis Procera Leaves for the Photodegradation of Methyl Orange. J. Mater. Sci. 2017, 28 (18), 14033–14039.
- Ahamed, M.; Alhadlaq, H.A.; Khan, M.A.M.; Karuppiah, P.; Al-Dhabi, N.A. Synthesis, Characterization, and Antimicrobial Activity of Copper Oxide Nanoparticles. J. Nanomater 2014, 2014,1–4.
- Abraham, N.; Rufus, A.; Unni, C.; Philip, D. Dye Sensitized Solar Cells Using Catalytically Active CuO-ZnO Nanocomposite Synthesized by Single Step Method. Spectrochim. Acta, Part A 2018, 200, 116–126.
- Ruan, S.; Huang, W.; Zhao, M.; Song, H.; Gao, Z. A Z-Scheme Mechanism of the Novel ZnO/CuO n-n Heterojunction for Photocatalytic Degradation of Acid Orange 7. Mater. Sci. Semicond. Process. 2020, 107, 104835.
- Ramesh, M.; Anbuvannan, M.; Viruthagiri, G. Green Synthesis of ZnO Nanoparticles Using Solanum Nigrum Leaf Extract and Their Antibacterial Activity. Spectrochim. Acta, Part A 2015, 136, 864–870.
- Vanathi, P.; Rajiv, P.; Narendhran, S.; Rajeshwari, S.; Rahman, P.K.S.M.; Venckatesh, R. Biosynthesis and Characterization of Phyto Mediated Zinc Oxide Nanoparticles: A Green Chemistry Approach. Mater. Lett. 2014, 134, 13–15.
- Sahoo, S.K.; Dwivedi, G.K.; Dey, P.; Praharaj, S. Green Synthesized ZnO Nanoparticles for Sustainable Production and Nutritional Biofortification of Green Gram. Env Techn Innov 2021, 24, 101957.
- Demissie, M.G. Synthesis of Zinc Oxide Nanoparticles Using Leaf Extract of Lippia Adoensis (Koseret) and Evaluation of its Antibacterial Activity. J. Chem. 2020.
- Andualem, W.W. Synthesis of Copper Oxide Nanoparticles Using Plant Leaf Extract of Catha Edulis and Its Antibacterial Activity. J. Nanotechnol. 2020.
- Sathappan, S.; Kirubakaran, N.; Gunasekaran, D.; Gupta, P.K.; Verma, R.S.; Sundaram, J. Green Synthesis of Zinc Oxide Nanoparticles (ZnO NPs) Using Cissus Quadrangularis: Characterization, Antimicrobial and Anticancer Studies. Proc. Natl. Acad. Sci. India Sect B Biol. Sci. 2021, 91 (2), 289–296.
- Luc, W.; Fu, X.; Shi, J.; Lv, J.-J.; Jouny, M.; Ko, B.H.; Xu, Y.; Tu, Q.; Hu, X., Wu, J. Two-dimensional Copper Nanosheets for Electrochemical Reduction of Carbon Monoxide to Acetate. Nat. Catal. 2019, 2 (5), 423–430.
- Thatikayala, D.; Min, B. Ginkgo Leaves Extract-Assisted Synthesis of ZnO/CuO Nanocrystals for Efficient UV-Induced Photodegradation of Organic Dyes and Antibacterial Activity. J. Mater. Sci. 2021, 32 (13), 17154–17169.
- Leong, Y.X.; Lee, Y.H.; Koh, C.S.L.; Phan-Quang, G.C.; Han, X.; Phang, I.Y. Surface-enhanced Raman Scattering (SERS) Taster: A Machine-Learning-Driven Multireceptor Platform for Multiplex Profiling of Wine Flavors. Nano Lett. 2021, 21 (6), 2642–2649.
- Jamdagni, P.; Khatri, P.; Rana, J. Green Synthesis of Zinc Oxide Nanoparticles Using Flower Extract of Nyctanthes Arbor-Tristis and Their Antifungal Activity. J. King Saud. Univ. Sci. 2018, 30 (2), 168–175.
- Zhu, L.; Li, H.; Liu, Z.; Xia, P.; Xie, Y.; Xiong, D. Synthesis of the 0D/3D CuO/ZnO Heterojunction with Enhanced Photocatalytic Activity. J. Phys. Chem. C 2018, 122 (17), 9531–9539.
- Manzoor, M.F.; Ahmed, E.; Ahmad, M.; Ahmad, I.; Rana, A.M.; Ali, A.; Ghouri, M.I.; Aziz, M.T. Enhanced Photocatalytic Activity of Hydrogen Evolution Through Cu Incorporated ZnO Nano Composites. Mater. Sci. Semicond. Process. 2020, 120, 105278.
- Singh, J.; Soni, R.K. Controlled Synthesis of CuO Decorated Defect Enriched ZnO Nanoflakes for Improved Sunlight-Induced Photocatalytic Degradation of Organic Pollutants. Appl. Surf. Sci. 2020, 521, 146420–146432.
- Singh, J.; Kumar, S.; Alok, A.; Upadhyay, S.K.; Rawat, M.; Tsang, D.C.W.; Bolan, N.; Kim, K.-H. The Potential of Green Synthesized Zinc Oxide Nanoparticles as Nutrient Source for Plant Growth. J. Cleaner Prod. 2019, 214, 1061–1070.
- Xu, K.; Wu, J.; Tan, C.F.; Ho, G.W.; Wei, A.; Hong, M. Ag-CuO-ZnO Metal-Semiconductor Multiconcentric Nanotubes for Achieving Superior and Perdurable Photodegradation. Nanoscale. 2017, 9 (32), 11574–11583.
- Saravanakkumar, D.; Sivaranjani, S.; Kaviyarasu, K.; Ayeshamariam, A.; Ravikumar, B.; Pandiarajan, S.; Veeralakshmi, C.; Jayachandran, M.; Maaza, M. Synthesis and Characterization of ZnO-CuO Nanocomposites Powder by Modified Perfume Spray Pyrolysis Method and its Antimicrobial Investigation. J. Semicond. 2018, 39 (3), 0033001.
- Mohamed, R.M.; Ismail, A.A. Photocatalytic Reduction and Removal of Mercury Ions Over Mesoporous CuO/ZnO S-Scheme Heterojunction Photocatalyst. Ceram. Int. 2021, 47 (7), 9659–9667.
- Mahajan, P.; Singh, A.; Arya, S. Improved Performance of Solution Processed Organic Solar Cells with an Additive Layer of Sol-Gel Synthesized ZnO/CuO Core/Shell Nanoparticles. J. Alloys Compd. 2020, 814, 152292–152326.
- Kadhem, H.; AL-Mathkhury, H. Inhibitory Effect of Menthol Extracted from Mentha Rubra on Methicillin-Resistant Staphylococcus Aureus. Worl Exp Bioc 2015, 3 (2), 150–54.
- Vijayakumar, S.; Vaseeharan, B.; Malaikozhundan, B.; Gopi, N.; Ekambaram, P.; Pachaiappan, R.; Velusamy, P.; Murugan, K.; Benelli, G., Suresh Kumar, R. Therapeutic Effects of Gold Nanoparticles Synthesized Using Musa Paradisiaca Peel Extract Against Multiple Antibiotic Resistant Enterococcus Faecalis Biofilms and Human Lung Cancer Cells (A549). Microb. Pathog. 2017, 102, 173–183.
- Pramila, D.; Xavier, R.; Marimuthu, K.; Kathiresan, S.; Khoo, M.L.; Senthilkumar, M.; Sathya, K.; Sreeramanan, S. Phytochemical Analysis and Antimicrobial Potential of Methanolic Leaf Extract of Peppermint (Mentha Piperita: Lamiaceae). J. Med. Plant Res. 2012, 6 (2), 331–335.
- G.K, P.; G.K., P.; P.A., P.; Bora, U.; Gadewar, M.; B.M., N.; G.M., K.; H.M., S. In Vitro Antibacterial and Cytotoxicity Studies of ZnO Nanopowders Prepared by Combustion Assisted Facile Green Synthesis. Karbala Int. J. Mod Sci. 2015, 1 (2), 67–77.
- Fardood, S.T. et al. Novel sol-gel synthesis and characterization of superparamagnetic magnesium ferrite nanoparticles using tragacanth gum as a magnetically separable photocatalyst for degradation of reactive blue 21 dye and kinetic study. J. Mater. Sci. Mater. Electron. 2017, 28, 17002–17008.
- Chitra, K.; Annadurai, G. Antimicrobial Activity of wet Chemically Engineered Spherical Shaped ZnO Nanoparticles on Food Borne Pathogen. Int. Food Res. J. 2013, 20 (1), 59–64.
- Sherly, E.D.; Vijaya, J.J.; Kennedy, L.J. Visible-light-induced Photocatalytic Performances of ZnO-CuO Nanocomposites for Degradation of 2,4-Dichlorophenol. Chin. J. Catal. 2015, 36 (8), 1263–1272.
- Khan, U. Comparative Photocatalytic Performance and Therapeutic Applications of Zinc Oxide (ZnO) and Neodymium-Doped Zinc Oxide (Nd-ZnO) Nanocatalysts Against Acid Yellow-3 dye: Kinetic and Thermodynamic Study of the Reaction and Effect of Various Parameters. J J. Mater. Sci. Mater. Electron, 2022, 33, 2781–2800.
- Harish, S.; Archana, J.; Sabarinathan, M.; Navaneethan, M.; Nisha, K.D.; Ponnusamy, S.; Muthamizhchelvan, C.; Ikeda, H.; Aswal, D.K., Hayakawa, Y. Controlled Structural and Compositional Characteristic of Visible Light Active ZnO/CuO Photocatalyst for the Degradation of Organic Pollutant. Appl. Surf. Sci. 2017, 418, 103–112.
- Li, G.; Dimitrijevic, N.M. Role of Surface/Interfacial Cu2+ Sites in the Photocatalytic Activity of Coupled CuO-TiO2 Nanocomposites. J. Phys. Chem. C. 2008, 112, 19040–19044.
- Taufik, A.; Albert, A.; Saleh, R. Sol-gel Synthesis of Ternary CuO/TiO 2 /ZnO Nanocomposites for Enhanced Photocatalytic Performance Under UV and Visible Light Irradiation. J. Photochem. Photobiol. A 2017, 344, 149–162.
- Xu, L.; Zhou, Y.; Wu, Z.; Zheng, G.; He, J.; Zhou, Y. Improved Photocatalytic Activity of Nanocrystalline ZnO by Coupling with CuO. J. Phys. Chem. Solids 2017, 106, 29–36.
- Khang, N.C. Further Investigation and Analysis on the Origin of the Optical Properties of Visible Hetero-Photocatalyst TiO2/CuO. J. Electron. Mater. 2017, 46 (10), 5497–5502.
- Migdadi, A.B.; Alqadi, M.K.; Alzoubi, F.Y.; Al-Khateeb, H.M.; Bani-Hani, W.T. Photocatalytic Activity of Prepared ZnO/CuO Nanocomposites and Kinetic Degradation Study of Methylene Blue. J. Mater. Sci.: Mater. Electron. 2022, 33, 26744–26763.
- Abu Hanif, M.; Akter, J.; Kim, Y.S.; Kim, H.G.; Hahn, J.R.; Kwac, L.K. Highly Efficient and Sustainable ZnO/CuO/g-C3N4 Photocatalyst for Wastewater Treatment Under Visible Light Through Heterojunction Development. Cata 2022, 12, 151–167.
- Lavína, A.; Lavín, A.; Sivasamy, R.; Mosquera, E., Morel, M.J., High Proportion ZnO/CuO Nanocomposites: Synthesis, Structural and Optical Properties, and Their Photocatalytic Behavior. Surf. Interfac. 2019, 17, 100367–1003697.
- Das, S.; Das, S.; Srivastava, V.C. An Overview of the Synthesis of CuO-ZnO Nanocomposite for Environmental and Other Applications. Nanotechnol. Rev. 2018, 7, 267–282.
- Aloucheh, R.M.; Mohammadi-Aloucheh, R.; Habibi-Yangjeh, A.; Bayrami, A.; Latifi-Navid, S.; Asadi, A. Green Synthesis of ZnO and ZnO/CuO Nanocomposites in Mentha Longifolia Leaf Extract: Characterization and Their Application as Antibacterial Agents. J. Mater. Sci.: Mater. Electron. 2018, 29, 13596–13605.
- Sherly, E.; Vijaya, J.J.; Kennedy, L.J. Visible-light-induced Photocatalytic Performances of ZnO–CuO Nanocomposites for Degradation of 2,4-Dichlorophenol. Chin. J. Catal. 2015, 36 (8), 1263–1272.
- Fouda, A.; Salem, S.S.; Wassel, A.R.; Hamza, M.F.; Shaheen, T.I. Optimization of Green Biosynthesized Visible Light Active CuO/ZnO Nano-Photocatalysts for the Degradation of Organic Methylene Blue dye. Heliyon 2020, 6, e04896.
- Mardikar, S.P.; Kulkarni, S.; Adhyapak, P.V. Sunlight Driven Highly Efficient Degradation of Methylene Blue by CuO-ZnO Nanoflowers. J. Environ. Chem. Eng. 2020, 8 (2), 102788–102828.
- Tolosana-Moranchel, A.; Pecharromán, C.; Faraldos, M.; Bahamonde, A. Strong Effect of Light Scattering by Distribution of TiO2 Particle Aggregates on Photocatalytic Efficiency in Aqueous Suspensions. Chem. Eng. J. 2021, 403, 126186.
- Rathore, B.S.; Chauhan, N.P.S.; Rawal, M.K.; Ameta, S.C.; Ameta, R. Chitosan–Polyaniline–Copper(II) Oxide Hybrid Composite for the Removal of Methyl Orange dye. Polym. Bull. 2020, 77 (9), 4833–4850.
- Muhammad, S.; Saeed, M.; Albalawi, K.; Khan, I.; Akram, N.; El-Rahim, A.; Alhag, I.H.A.; Ezzat Ahmed, S.K.; Faiza, A. Synthesis of p-n NiO-ZnO Heterojunction for Photodegradation of Crystal Violet dye. Alex. Eng. J. 2023, 65, 561–574.
- Muhammad, S.; Hussian, I.; Ali, A.; Hussain, T.; Intisar, A.; Ul Haq, I.; Subhani, Q.; Hedar, M.; Zhong, J.-L., Asif, M., A Comprehensive Review of Liquid Chromatography Hyphenated to Post-Column Photoinduced Fluorescence Detection System for Determination of Analytes. Arab. J. Chem. 2022, 15, 104091.
- Harish, S.; Archana, J.; Sabarinathan, M.; Navaneethan, M.; Nisha, K.D.; Ponnusamy, S.; Muthamizhchelvan, C.; Ikeda, H.; Aswal, D.K., Hayakawa, Y., Controlled Structural and Compositional Characteristic of Visible Light Active ZnO/CuO Photocatalyst for the Degradation of Organic Pollutant. Appl. Surf. Sci. 2017, 418, 103–112.
- Koffyberg, F.; Benko, F. A Photoelectrochemical Determination of the Position of the Conduction and Valence Band Edges of p-Type CuO. J. Appl. Phys. 1982, 53 (2), 1173–1177.
- Nair, M.; Guerrero, L.; Arenas, O.L. Chemically Deposited Copper Oxide Thin Films: Structural, Optical and Electrical Characteristics. Appl. Surf. Sci. 1999, 150 (1–4), 143–151.
- Aklilu, G.B.; Bekru, A.G.; Tufa, L.T.; Zelekew, O.A.; Goddati, M.; Lee, J.; Sabir, F.K. Green Synthesis of a CuO-ZnO Nanocomposite for Efficient Photodegradation of Methylene Blue and Reduction of 4-Nitrophenol. ACS Omega 2022, 7, 30908–30919.
- Aklilu, G.B.; Bekru, A.G.; Tufa, L.T.; Zelekew, O.A.; Gwak, J.; Lee, J.; Sabir, F.K. Microwave-Assisted Synthesis of rGO-ZnO/CuO Nanocomposites for Photocatalytic Degradation of Organic Pollutants. Crystals. (Basel) 2023, 13, 133.
- Chai, B.; Liu, C.; Yan, J.; Ren, Z.; Wang, Z.-j. In-situ Synthesis of WO3 Nanoplates Anchored on g-C3N4 Z-Scheme Photocatalysts for Significantly Enhanced Photocatalytic Activity. Appl. Surf. Sci. 2018, 448, 1–8.
- Roopan, M.S.; Elango, G.; Devi, P.D.; Asharani, I.V.; Kishore, B.; Vinayprabhakar, S.; Pragatheshwaran, N.; Mohanraj, K.; Harshpriya, R.; Shanavas, S. Sunlight Mediated Photocatalytic Degradation of Organic Pollutants by Statistical Optimization of Green Synthesized NiO NPs as Catalyst. J. Mol. Liq. 2019, 293, 111509.
- Chellapandi, T.; Madhumitha, G. Microwave-Assisted Fabrication of ZnO/MK10 Nanocomposites: An Efficient Photocatalytic and Sonophotocatalytic Degradation of Methylene Blue dye. Appl. Nanosci. 2021, 11, 1379–1391.