
ABSTRACT
A practical colorimetric analysis for alcohol determination was devised using a composite of food colorants, specifically a green solution of brilliant blue FCF and tartrazine at a ratio of 1:5 v/v. This colorimetric method was characterized by its simplicity, user-friendliness, environmental compatibility, cost-effectiveness, and suitability for self-measurement through visual examination. The colorimetric procedure entails admixture 1 mL of the alcohol sample with 50 µL of the green test solution and 250 µL of a 30% NaOH solution at ambient temperature. The ensuing color changes were visually assessed within 5 min. Through color sensing, methanol, ethanol, and isopropanol were identified by the manifestation of lemon yellow, orange, and biphasic solutions, respectively. Ethanol was semi-quantified based on color sensing from green to orange, with corresponding concentration ranges. The limit of detection for both methanol and ethanol was determined to be 30% v/v. The developed method demonstrated an accuracy of 93%, with the error range of 1 − 10% v/v and standard deviation of 3.9% v/v, as confirmed by the analysis of 100 commercially available alcohol-based hand sanitizers. This methodology has the potential for further expansion to encompass a wide range of rapid colorimetric analyses of products containing alcohol, including food items, alcohol raw materials, and cosmetics.
GRAPHICAL ABSTRACT

1. Introduction
The World Health Organization has issued recommendations regarding hand hygiene guidelines to mitigate the transmission and prevent the spread of pathogens associated with severe acute respiratory syndrome coronavirus 2 (SARS-CoV-2), the virus responsible for the coronavirus disease (COVID-19). These guidelines endorse the use of alcohol-based hand sanitizers and disinfectants (Citation1, Citation2). The concentrations and types of alcohols, specifically ethanol and isopropanol at 60%–90% v/v, are critical factors because of their ability to rapidly decrease viral titers to background levels within 30 s (Citation3). Alcohol-based hand rub formulations containing ethanol at a concentration of 85.5% v/v or isopropanol at a concentration of 81.3% v/v have demonstrated efficacy in inactivating SARS-CoV-2 (Citation4). The numerous instances of substandard alcohol-based hand sanitizers have been reported in both America (Citation5, Citation6) and Africa (Citation7–9). Furthermore, there have been documented cases of an unexpected rise in vision loss and fatal incidents related to methanol toxicity (Citation10, Citation11) resulting from the ingestion of alcohol-based hand sanitizers in Iran (Citation12), the United States (Citation13, Citation14), and the United Kingdom (Citation15).
The quality of alcohol-based hand sanitizers can be assessed using gas chromatography (GC), which serves as a standard protocol for both the qualitative and quantitative analysis of ethanol, isopropanol, and methanol (Citation16, Citation17). Moreover, the presence of alcohol can be determined by conducting chemical reactions involving hydroxyl groups, such as the iodoform reaction (Citation18), as well as oxidation reactions using strong oxidizing agents, such as potassium dichromate (Citation19) and potassium permanganate (Citation20, Citation21). However, despite their accuracy and sensitivity, alcohol analyses using both GC and chemical reactions are time-consuming and costly. Besides, these tests are associated with elevated levels of chemical hazards and toxicity, necessitating their execution in a laboratory setting by highly qualified experts.
Therefore, rapid, and cost-effective methods of alcohol analysis that can provide accurate information regarding alcohol raw materials and alcohol-based hand sanitizers are needed worldwide. Obtaining test results promptly is vital for establishing effective safety and quality control policies. In practical applications, an inexpensive, user-friendly, easily accessible, and rapid test that can be employed for self-measurement purposes, potentially applicable to various objects, is urgently needed (Citation22, Citation23). Hence, an enhanced alcohol analysis method that integrates green analytical chemistry practices must be developed (Citation23, Citation24). These procedures should ensure safety in general screening test kits, even when operated by nonexperts, by employing less hazardous chemicals for sample preparation and quality control. Additionally, such an approach should aim to minimize the generation of hazardous waste.
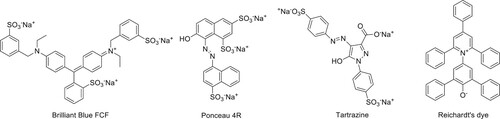
This study examined a simple and rapid colorimetric detection method for methanol, ethanol, and isopropanol by expanding upon the spot tests theory. The color test used various types of food coloring agents including brilliant blue FCF, ponceau 4R, and tartrazine (). Brilliant blue FCF is classified as a triarylmethane dye, while both ponceau 4R, and tartrazine belong to the azo class of dyes. Brilliant blue FCF is used as a water tracer agent with low toxicity, non-accumulation in plants or animals, and slow degradation in the environment (Citation25). Ponceau 4R, and tartrazine are commonly used in food and cosmetics products with low toxicity (Citation26). Decolorization and degradation of brilliant blue FCF, ponceau 4R, and tartrazine under the suitable chemical reactions, including photoreaction, oxidation, and reduction have been reported (Citation27–30). Thus, several factors that influence color change, including solubility, solvatochromism (Citation31) comparing with Reichardt’s dye; a solvatochromic reference (Citation32) (), ratio of food coloring agents, pH, concentration of alcohol, testing time, and temperature were investigated. The results of the colorimetric analysis for the screening and semi-quantification of methanol, ethanol, and isopropanol by the naked eye were compared with those obtained through GC, a recognized standard method for alcohol determination. Subsequently, modified alcohol colorimetric detection was employed to screen the quality of alcohol-based hand sanitizers.
Figure 1. Chemical structures of food coloring agents and Reichardt’s dye.
2. Materials and methods
2.1. Chemicals and reagents
Food coloring agents, namely, brilliant blue FCF, ponceau 4R, and tartrazine, were acquired from Roda Dyechem (Thailand). Analytical-grade chemicals and reagents were utilized unless specifically stated otherwise. Methanol (99.9% v/v), ethanol (99.9% v/v), sodium hydroxide (NaOH), and sodium hypochlorite (NaOCl, 4.00%–4.99% v/v) were obtained from Merck (Darmstadt, Germany). n-Propanol (100% v/v), isopropanol (99.7% v/v), and hydrochloric acid (HCl, 37% w/w) were purchased from RCI Labscan (Thailand). Reichardt’s dye was sourced from Sigma-Aldrich (Saint Louis, MO, USA). Distilled water was used for preparing the test solutions. The concentrations of alcohol solutions were calculated on the basis of volume percentage. The experiments were conducted in glass vials or Eppendorf tubes.
2.2. Instruments
The absorbance measurement was conducted using the Cary 60 UV–Vis Spectrophotometer from Agilent Technologies, Inc. (Santa Clara, CA, USA). Density evaluation was performed using the Anton Paar DMA 5000 Density Meter from Anton Paar GmbH (Graz, Austria). The pH value was detected using the Mettler Toledo™ Seven Compact Benchtop Meters from Mettler Toledo (Columbus, OH, USA). Headspace gas chromatography − flame ionization detector (HS − GC − FID) for quantitative analysis of alcohol was conducted using the Agilent 8890 GC System with the 7697A Headspace Sampler and 7693A Automatic L from Agilent Technologies, Inc. (Santa Clara, CA, USA). Colorimetric sensing was captured in images by a digital camera fixed on a tripod using the Canon EOS 700D with Canon lens EF 50 mm f1.8 STM from Cannon (Bangkok, Thailand).
2.3. General protocol for the colorimetric detection of alcohols
All experiments were carried out in a laboratory with temperature control. All samples were kept in closed containers at 25–30 oC. During testing, the sample was quickly transferred into glass vials or Eppendorf tubes, and the cap was closed to avoid evaporation. Each alcohol sample was dispensed in 1-mL portions and transferred to 3-mL glass vials. Next, 250 µL of the chosen concentration of alkali base solution and 50 µL of the food coloring solution were added sequentially. The mixture was shaken for 10 s, and the resulting color changes were recorded at 1-min intervals for a total duration of 5 min. Color sensing was observed by the naked eye with a white background. Images were acquired under ambient light in the laboratory. The camera was set to manual mode with ISO at 400, speed shutter at 1/50 s, f stop number at 1.8, white balance at fluorescent (4000 K), and focus on the AF center point.
2.4. Colorimetric sensing of alcohols by food coloring agents
2.4.1. Solubility and solvatochromic effects
Analytical grade alcohols including methanol, ethanol, n-propanol, and isopropanol were used in this study. Aqueous solutions of food coloring agents and Reichardt’s dye () were prepared at a concentration of 2% w/w. Brilliant blue FCF, ponceau 4R, and tartrazine provided blue, red, and yellow solutions, respectively. Additionally, a mixture of brilliant blue FCF and ponceau 4R (1:5 v/v) and a mixture of brilliant blue FCF and tartrazine (1:5 v/v) gave violet and green test solutions, respectively. These solutions fulfill the color spectrum of test solutions ranging from purple, blue, green, yellow, and red colors. Each pure alcohol was examined. The solubility and solvatochromic effects between each alcohol and food coloring solution were observed within 5 min. The colorimetric sensing was compared with Reichardt’s dye as a reference for the solvatochromic effects (Citation32).
2.4.2. Ratio of food coloring effects
The mixtures of brilliant blue FCF and tartrazine at various ratios, ranging from 1:1–1:10 v/v, were prepared. An aqueous solution of 70% v/v ethanol was chosen to determine the optimal ratio of brilliant blue FCF and tartrazine that depicted clear color sensing in the presence of NaOH (30% w/w) within 5 min.
2.4.3. Effect of pH
Aqueous solutions of methanol, ethanol, n-propanol, and isopropanol were prepared at a concentration of 70% v/v. Additionally, aqueous solutions of acid and base reagents, including HCl (10% v/v), NaOH (30% w/w), and NaOCl (4% v/v) for pH 2, 11, and 13, were prepared to examine their impact on the pH and colorimetric sensing of the green test solution.
2.4.4. Effect of alcohol and alkali base concentrations
Aqueous solutions of methanol, ethanol, n-propanol, and isopropanol were prepared at various concentrations ranging from 10% to 100% v/v. NaOH solutions with concentrations of 10%, 30%, and 50% w/w and NaOCl solutions with concentrations of 1%, 2%, 4%, and 7% v/v were employed to investigate the impact of alcohol and alkali base concentrations.
2.4.5. Effect of temperature
Aqueous solutions of 70% v/v methanol and ethanol were used to determine the effect of temperature on the colorimetric sensing of the green test solution. The experiments were performed at temperatures of 20, 25, and 30 °C.
2.5. Selectivity, specificity, limit of detection of alcohol in the colorimetric method
Various concentrations of methanol and ethanol were detected using colorimetric sensing with a green test solution. The color changes were visually analyzed using the naked eye, and images were captured using a digital camera. The color changes were recorded until color stability was achieved. A mixture of methanol and ethanol was prepared with the following ratios: 1:1, 1:10, 1:20, and 1:100 v/v. The final concentration of the aqueous alcohol solution was maintained at 70% v/v. The colorimetric analysis with a green test solution was conducted through visual observation. These experiments provide information regarding selectivity and specificity. Additionally, the limit of detection (LOD) of methanol and ethanol by rapid colorimetric method was analyzed. The absorbance at the maximum wavelength (λ) of 630 nm, corresponding to brilliant blue FCF, was measured using a spectrophotometer.
2.6. Rapid colorimetric detection of alcohol in alcohol-based hand sanitizers
Alcohol-based hand sanitizers were purchased from convenience stores in Bangkok, Thailand, in 2022. The appearance of these sanitizers was recorded. Each alcohol sample was measured at 1 mL and placed in either a 3-mL glass vial or a 2-mL plastic Eppendorf. Then, 250 µL of a NaOH solution (30% w/w) and 50 µL of the green test solution were added to the samples. The obtained mixtures were then shaken for 10 s. Colorimetric analysis was done within 5 min. The results were compared with the colorimetric sensing chart to identify the type of alcohol including methanol, ethanol, and isopropanol and semi-quantify the concentration of ethanol. This analysis was conducted alongside GC analysis.
2.7. GC analysis of ethanol in alcohol-based hand sanitizers
2.7.1. GC instrumental condition
GC analysis was conducted using an Agilent 8890 GC System with a 7697A Headspace Sampler and 7693A Automatic L (Agilent Technologies, Inc., Santa Clara, CA, USA). The system was equipped with an Agilent J&W GC Column DB-FFAP measuring 30 m × 530 µm × 0.25 µm (Agilent Technologies, Inc., Santa Clara, CA, USA). The oven temperature was set at 40 °C, whereas the detector temperature was set at 240 °C. Helium was used as the carrier gas at a flow rate of 2.0 mL/min, and the detector gas consisted of helium makeup (5 mL/min), hydrogen (30 mL/min), and air (350 mL/min). Under these conditions, the retention times for methanol, ethanol, and isopropanol were determined to be 6.132, 6.655, and 6.803 min, respectively. For the autosampler, a 7697A Headspace Sampler and a 7693A Automatic L (Agilent Technologies, Inc.) were utilized, along with a sample loop and a DB-FFAP GC column. The oven temperature was set at 100 °C with a 5-min sample equilibration time. The sample loop temperature was maintained at 110 °C. The vial equilibrium time was 0.2 min, and the injection time was 0.5 min. The transfer line temperature was set at 120 °C. A 20-mL GC vial was used, and vial shaking was performed at 250 shakes per minute.
2.7.2. Sample preparation
Each alcohol sample was collected at 2 mL and transferred into a 20-mL GC vial. Then, 2 mL of distilled water was added to each sample vial. The vials were sealed with a cap and placed into the HS − GC − FID system. The GC chromatogram was obtained, and methanol, ethanol, and isopropanol were qualitatively and quantitatively assessed on the basis of the peak areas and retention times.
3. Results and discussion
3.1. Colorimetric sensing of alcohols by food coloring agents
A green and rapid colorimetric alcohol detection method was developed using inexpensive and environmentally friendly food coloring agents. The colorimetric sensing of each food coloring agent was examined for methanol, ethanol, n-propanol, and isopropanol. Brilliant blue FCF, ponceau 4R, and tartrazine exhibited different solubilities in alcohols, as shown in Figure S1 (See the Supporting Information). All food coloring agents dissolved completely in methanol. Meanwhile, tartrazine precipitated significantly in isopropanol, resulting in a yellowish discoloration. The results suggested that the solubility decreased as the alkyl group of the alcohols increased, following the order of methyl < ethyl < n-propyl < isopropyl. Interestingly, a green test solution prepared from brilliant blue FCF and tartrazine (1:5 v/v) displayed different colors when dissolved in various alcohols, ranging from green to light blue, with a yellowish discoloration. This observation corresponded to the varying solubility of both brilliant blue FCF and tartrazine in each type of alcohol. Solvatochromism is a reversible change of the absorption or emission spectrum of a solute induced by the action of solvents. The color change is a consequence of the shift in absorption maximum, which occurs due to differences in the solvation energy between the initial and excited states in various solvents. Solvatochromic effects are observed when the color of a solution differs as the solute is dissolved in different solvents (Citation31). Reichardt's dye was selected as the reference for the solvatochromic effects because it is an organic dye that has the largest solvatochromic effects with color variations spanning the entire visible spectrum (Citation32). The solutions of Reichardt's dye in methanol, ethanol, n-propanol, and isopropanol display different colors in red, violet, blue, and yellow respectively. Compared with Reichardt’s dye, the food coloring agents did not exhibit solvatochromic properties when dissolved in various alcohols. In contrast, the precipitation of food coloring agents was observed, thereby influencing the color variations through solubility. The investigation of the brilliant blue FCF and tartrazine ratio was conducted using ethanol in the presence of NaOH (30% w/w), as depicted in Figure S2. A series of mixtures comprising brilliant blue FCF and tartrazine at ratios ranging from 1:1–1:3 v/v yielded blue test solutions with indistinct color sensing. Furthermore, the mixtures at ratios of 1:5 and 1:10 v/v yielded green test solutions exhibiting improved colorimetric differentiation. The solution at a 1:5 v/v ratio displayed a sequential transition through four distinct colors within 5 min, whereas the 1:10 v/v ratio demonstrated changes in three colors. Therefore, the green test solution composed of brilliant blue FCF and tartrazine at a 1:5 v/v ratio was selected for further analysis.
The selected green test solution was comprehensively investigated for the colorimetric analysis of alcohol under diverse experimental conditions, encompassing pH, temperature, and testing time. The obtained color-sensing data were visually examined by an observer under controlled laboratory fluorescent lighting conditions, and high-resolution images were captured using a digital camera for precise documentation. In exploring the effects of pH, HCl, NaOH, and NaOCl were selected due to their cost-effectiveness and limited impact on human health and the environment. Under acidic conditions at pH 2 using HCl (15% v/v), the green test solution failed to detect the alcohol types. The outcomes revealed that the addition of HCl solution did not induce any discernible change in the color of the green test solution. However, under basic conditions, at pH 11 using NaOCl (4% v/v), color sensing was evident. Additionally, at pH 13 using NaOH (30% w/w) both color sensing and layer separation were observed. These observations were utilized to qualitatively identify the types of alcohols (). The investigation of the base involved an examination of concentration variations in NaOCl and NaOH over a 5-min duration to evaluate color sensing in methanol, ethanol, n-propanol, and isopropanol. The colorimetric analysis of the green test solution in the presence of 4% NaOCl resulted in a gradual decolorization of brilliant blue FCF within 5 min, suggesting its potential application for the semi-quantitative detection of known alcohols (Figure S3). However, the color-sensing profiles for methanol, ethanol, and isopropanol exhibited close similarity, whereas that for n-propanol displayed a distinct and vibrant color response. At 30% NaOH, the visualized color-sensing results facilitated the identification of methanol, ethanol, n-propanol, and isopropanol (70% v/v) based on their unique color and solubility characteristics (Figure S4). At 5 min, methanol and ethanol gave lemon-yellow and orange colors, respectively. Meanwhile, both n-propanol and isopropanol showed two separate layers. Notably, among the tested alcohols, only ethanol exhibited a gradual color transition from green to orange (). As a result, strict adherence to the designated testing protocol is imperative, involving the introduction of the green test solution into the alcohol sample, followed by the application of NaOH solution. The direct addition of NaOH solution into the green test solution promptly led to a transformation in color shifting to a red-brown color.
Table 1. Effect of pH on colorimetric detection of a green solution of brilliant blue FCF: tartrazine (1:5 v/v) and alcohols.
Table 2. Colorimetric detection of alcohol with a green test solution in the presence of 30% NaOH in 5 min.
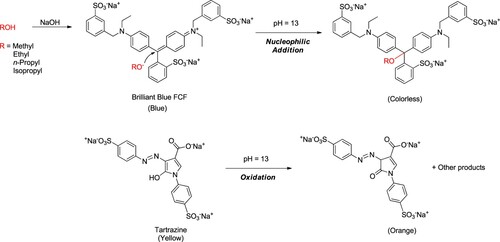
Concerning chemical reactions in alkaline conditions, the alcohols underwent conversion into their corresponding sodium alkoxides. The elucidation of the proposed reaction mechanism for the colorimetric sensing of alcohols is presented in . The resultant alkoxide was promptly generated, producing a reactive alkoxide anion serving as a nucleophile. The reactivity order of the nucleophile followed methoxide > ethoxide > n-propoxide > isopropoxide. This process potentially involved the decolorization of brilliant blue FCF and the oxidation of tartrazine (Citation33, Citation34).
Figure 2. Proposed reaction mechanism for the colorimetric analysis of alcohols using green test solution and NaOH solution.
Moreover, the temperature during the experiment was carefully controlled as it significantly affected the reaction rate (Figure S5). The colorimetric test of alcohols was observed at temperatures of 20, 25, 30 °C. The findings indicated that higher temperatures led to faster color sensing. Based on the obtained results, the testing should be conducted at a temperature range of 25 °C.
The incorporation of the green test solution in the presence of 30% NaOH demonstrated significant potential for advancing the field of colorimetric analysis. It provides a straightforward and rapid method using cost-effective and environmentally friendly reagents. This technique showed promise for effectively screening and semi-quantifying ethanol in alcohol samples, making it suitable for self-measurement purposes.
3.2. Selectivity, specificity, and LOD of alcohol in the colorimetric method
In this study, selectivity denotes the colorimetric method's capacity to differentiate between methanol and ethanol. Specificity pertains to the colorimetric method's ability to selectively analyze the target alcohol without interference from other alcohols. LOD is defined as the minimum detectable concentration of methanol and ethanol in a sample that is measurable.
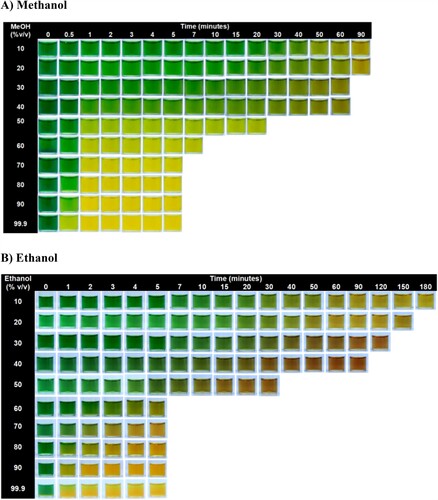
To assess the selectivity of the colorimetric method, elucidation of the color-sensing pattern modulated by methanol and ethanol concentrations involved meticulous visual scrutiny. This included image acquisition at specified temporal intervals until achieving color stability, providing significant insights into the color-sensing dynamics across a spectrum of methanol and ethanol concentrations (ranging from 10% to 99.9% v/v) (). In the case of methanol, colorimetric sensing corresponding to a lemon-yellow color was observed within 1 min, together with the formation of yellow precipitation at concentrations of 90% v/v and 99.9% v/v. For ethanol, the colorimetric sensing corresponding orange color was observed within 5 min, along with the formation of orange precipitation at a concentration of 99.9% v/v. High-concentration alcohol samples (60%–90% v/v) manifested discernible colors within 5 min. On the other hand, low-concentration alcohol samples (50%–10% v/v) required a longer duration to yield distinctive colors. The analysis time increased for alcohol samples with concentrations lower than 50% v/v. For 10% v/v alcohol, the testing required a maximum of 90 and 180 min for the clear colorimetric analysis of methanol and ethanol, respectively. These analyses substantiated the correlation among the type of alcohol, alcohol concentration, and the gradient of color change.
Figure 3. Selectivity of colorimetric test with different concentrations of alcohols at different times: A) methanol and B) ethanol.
To investigate the specificity of colorimetric detection using the green test solution, analyses were conducted on mixed solutions of methanol and ethanol. A blend of methanol and ethanol was prepared to simulate various degrees of methanol contamination within ethanol, specifically at concentrations of 50%, 10%, 5%, and 1% v/v of methanol. This was accomplished by combining methanol with ethanol at ratios of 1:1, 1:10, 1:20, and 1:100 v/v, respectively. The outcomes of the color sensing process revealed a lemon-yellow color in a methanol and ethanol mixture at a concentration of 50% v/v. Notably, a combination of lemon-yellow and pale green resulting in a lemon-brownish yellow shade was observed at a concentration of 10% v/v of methanol. However, the colorimetric test was unable to discern methanol in mixtures at concentrations of 1% and 5% v/v. In the presence of mixed methanol and ethanol, color sensing exhibited a distinct characteristic transition. This color trend corresponded with the specific mixing ratios between methanol and ethanol. Notably, samples contaminated with methanol at concentrations as low as 10% v/v were readily detectable through visual observations (Figure S6).
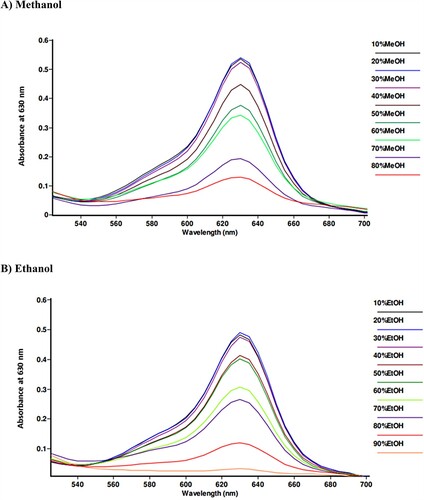
Spectroscopic analysis was conducted to explore the LOD of methanol and ethanol through colorimetric testing utilizing the green test solution. Absorbance values were recorded at a wavelength of 630 nm, corresponding to brilliant blue FCF. High-concentration alcohol samples (80–90% v/v) exhibited low absorbance due to the rapid transition from green to orange color, stemming from the discoloration of brilliant blue FCF. The lower the alcohol concentration in the samples, the higher the observed absorbance. Low-concentration alcohol samples (10–30% v/v) demonstrated similar absorbance patterns (). The results revealed that the LOD for both methanol and ethanol could be as low as 30% v/v.
Figure 4. Limit of detection of colorimetric analysis based on spectrophotometric determination of alcohol at various concentrations at 5 min: A) methanol and B) ethanol.
3.3. Rapid colorimetric detection of alcohol in alcohol-based hand sanitizers
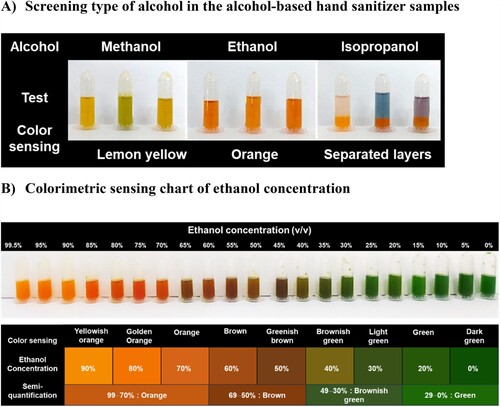
This study employed a colorimetric approach for the qualitative analysis of alcohols (specifically methanol, ethanol, and isopropanol) in alcohol-based hand sanitizer samples. The analysis was conducted through straightforward visual examinations, where methanol was characterized by a lemon-yellow color, ethanol by an orange color, and isopropanol by a distinct separation of layers in the solution (A). In addition, a semi-quantitative assessment of ethanol concentration was performed in relation to the color-sensing range. The color-sensing chart for ethanol concentrations included orange, brown, brownish green, and green from 99 − 70%, 69 − 50%, 49 − 30%, and 29 − 0% v/v, respectively (B).
Figure 5. Color sensing of rapid colorimetric analysis for the alcohol tests: A) screening type of alcohol in the alcohol-based hand sanitizer samples and B) chart of ethanol concentration.
As regards quality control for alcohol-based hand sanitizers, the rapid colorimetric method presented herein was validated. A total of 100 commercially available alcohol-containing products were utilized in the validation study (Table S1). This validation process involved comparing the results obtained from the colorimetric method with those obtained through GC analysis ().
Figure 6. Analysis of alcohol-based hand sanitizer samples and summary of alcohol analysis comparing reliability between color test kit and GC approach; A) Rapid colorimetric method B) Gas chromatographic (GC) method C) Qualitative analysis of alcohol D) Comparison of quantitative analysis of ethanol by color test and GC method.
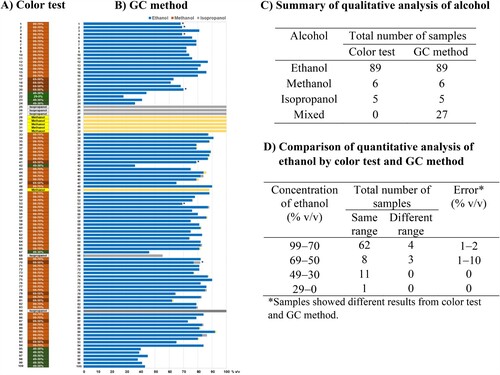
The validation study was conducted to assess the efficacy of the rapid colorimetric method in identifying specific types of single alcohols, including methanol, ethanol, and isopropanol. The test showed exclusive selectivity. The visual inspection alone, without the aid of the colorimetric method, failed to detect alcohol contamination at concentrations below 10% v/v. For the examination of ethanol concentration in the range of 0% to 99% v/v using the colorimetric method, distinct colors were developed, ranging from green, greenish-brown, brown, to orange as the ethanol concentration increased. According to the validation results, the colorimetric analysis with the green test solution demonstrated 93% accuracy. The error was observed in the range of 1 − 10% v/v with the standard deviation of 3.9% v/v for the semi-quantitative determination of ethanol. The sample and laboratory temperatures were crucially maintained at 25 °C and the color changes were visually inspected within a 5-min timeframe to ensure accurate and reliable results.
Various colorimetric methodologies for alcohol detection, employing chemical quantitative techniques, have been documented. However, an investigation into colorimetric alcohol detection utilizing food colorants for concurrent qualitative and quantitative analyses has not been explored.
The utilization of potassium dichromate and sulfuric acid reagents enabled the determination of ethanol in aqueous solution within the range of 0.001–5.8 mg through qualitative oxidation (Citation35). Redox titration on foldable paper-based analytical devices, employing potassium permanganate, sulfuric acid, and sodium oxalate for visual alcohol content determination by classical permanganometry for redox reactions, exhibited a LOD of 2.1% v/v (Citation36). The development of an alcohol sensor, monitoring hydrogen peroxide formed during the oxidation of alcohol to acetaldehyde in the presence of Au@PtRu nanorods and alcohol oxidase, yielded a LOD of 23.8 µM (Citation37).
In contrast to previously reported colorimetric methods for alcohol determination, the current approach embodies the principles of green analytical chemistry as a distinctive feature. The test kit is easily prepared, requiring only a few low-hazard chemicals, and incurring minimal costs. The protocol is straightforward, involving fewer steps, without the necessity for sample pretreatment, facilitating rapid analysis suitable for self-use in field and non-laboratory settings. While this colorimetric test is limited to qualitative detection of methanol, ethanol, and isopropanol, along with semi-quantitative analysis of ethanol, it exhibits high sensitivity and robustness. Additionally, this colorimetric test is suitable for high-concentration alcohol samples (30–90% v/v), though improvements in the LOD are warranted.
4. Conclusion
This study sought to develop a colorimetric method for the identification and quantification of alcohols in diverse samples, utilizing a green test solution comprising brilliant blue FCF and tartrazine (1:5 v/v). The method demonstrated considerable selectivity in distinguishing individual alcohols, providing discernible color variations. However, challenges in clarity emerged when testing samples containing mixed alcohols. This colorimetric approach is characterized by its rapidity, simplicity, safety, user-friendliness, accessibility, and cost-effectiveness, particularly in the screening and semi-quantification of ethanol in hand sanitizer samples. The refined colorimetric test kit exhibits potential for broader applications in alcohol analysis across various products, including food, alcohol raw materials, and cosmetics.
Supplemental Material
Download MS Word (122.2 MB)Acknowledgments
The authors also express their gratitude to the Natural Products and Nanoparticles Research Unit (NP2), Faculty of Pharmaceutical Sciences, Chulalongkorn University, for their support to S.C.
Disclosure statement
No potential conflict of interest was reported by the author(s).
Data availability
The authors confirm that the data supporting the findings of this study are available within the article and its supplementary materials.
Additional information
Funding
References
- Golin, A.P.; Choi, D.; Ghahary, A. Hand Sanitizers: A Review of Ingredients, Mechanisms of Action, Modes of Delivery, and Efficacy Against Coronaviruses. Am. J. Infect. Control 2020, 48 (9), 1062–7.
- Marumure, J.; Makuvara, Z.; Alufasi, R.; Chapungu, L.; Gufe, C. Effectiveness of Hand Sanitizers in the Prevention of COVID-19 and Related Public Health Concerns: A Review. Cogent Public Health 2022, 9 (1), 2060904.
- Suchomel, M.; Steinmann, J.; Kampf, G. Efficacies of the Original and Modified World Health Organization-Recommended Hand-rub Formulations. J. Hosp. Infect. 2020, 106 (2), 264–70.
- Kratzel, A.; Todt, D.; V’kovski, P.; Steiner, S.; Gultom, M.; Thao, T.T.N.; Ebert, N.; Holwerda, M.; Steinmann, J.; Niemeyer, D.; Dijkman, R. Inactivation of Severe Acute Respiratory Syndrome Coronavirus 2 by WHO-Recommended Hand Rub Formulations and Alcohols. Emerg. Infect. Dis. 2020, 26 (7), 1592.
- Phillips, T.; Schulte, J.M.; Smith, E.A.; Roth, B.; Kleinschmidt, K.C. COVID-19 and Contamination: Impact on Exposures to Alcohol-Based Hand Sanitizers Reported to Texas Poison Control Centers, 2020. Clin. Toxicol. 2021, 59 (10), 926–31.
- Food, Administration D. FDA Updates on Hand Sanitizers Consumers Should Not Use. 2021.
- Matatiele, P.; Southon, B.; Dabula, B.; Marageni, T.; Poongavanum, P.; Kgarebe, B. Assessment of Quality of Alcohol-Based Hand Sanitizers Used in Johannesburg Area During the COVID-19 Pandemic. Sci. Rep. 2022, 12 (1), 4231.
- Muleba, L.; Van Wyk, R.; Pienaar, J.; Ratshikhopha, E.; Singh, T. Assessment of Anti-Bacterial Effectiveness of Hand Sanitizers Commonly Used in South Africa. Int. J. Environ. Res. Public Health 2022, 19 (15), 9245.
- Selam, M.N.; Habte, B.M.; Marew, T.; Bitew, M.; Getachew, T.; Getachew, S.; Abate, A.; Mitiku, M.; Matsabisa, M.; Birhanu, G. Evaluation of Quality and Antimicrobial Efficacy of Locally Manufactured Alcohol-Based Hand Sanitizers Marketed in Addis Ababa, Ethiopia in the era of COVID-19. Antimicrob. Resist. Infect. Control. 2022, 11 (1), 126.
- Chan, A.P.; Chan, T.Y. Methanol as an Unlisted Ingredient in Supposedly Alcohol-Based Hand rub Can Pose Serious Health Risk. Int. J. Environ. Res. Public Health 2018, 15 (7), 1440.
- Pressman, P.; Clemens, R.; Sahu, S.; Hayes, A.W. A Review of Methanol Poisoning: A Crisis Beyond Ocular Toxicology. Cutan. Ocul. Toxicol. 2020, 39 (3), 173–9.
- Mahdavi, S.A.; Zamani, N.; McDonald, R.; Akhgari, M.; Kolahi, A.A.; Gheshlaghi, F.; Ostadi, A.; Dehghan, A.; Moshiri, M.; Rahbar-Taramsari, M.; Delirrad, M. Diagnosis of Early Mild Cognitive Impairment Using a Multiobjective Optimization Algorithm Based on T1-MRI Data. Sci. Rep. 2022, 12 (1), 9741.
- Yip, L.; Bixler, D.; Brooks, D.E.; Clarke, K.R.; Datta, S.D.; Dudley Jr, S.; Komatsu, K.K.; Lind, J.N.; Mayette, A.; Melgar, M.; Pindyck, T. Serious Adverse Health Events, Including Death, Associated with Ingesting Alcohol-Based Hand Sanitizers Containing Methanol – Arizona and New Mexico, May–June 2020. MMWR Morb. Mortal. Wkly. Rep. 2020, 69 (32), 1070.
- Overbeek, D.L.; Watson, C.J.; Castañeda, N.R.; Ganetsky, M. Pharmaceutical Compounding: A History, Regulatory Overview, and Systematic Review of Compounding Errors. J. Med. Toxicol. 2021, 17 (2), 197–21.
- Richards, G.C. Alcohol-based Hand Sanitisers: A Warning to Mitigate Future Poisonings and Deaths. BMJ Evidence-Based Med. 2021, 26 (2), 65–8.
- Konings, E.J.; Barrett, W.B.; Beshore, M.; Beshore, T.; Buscher, J.; Crum, H.; Dave, G.T.; Ebersole, B.E.; Edwards, J.C.; Fink, S.; Hurley, E.K., Jr. AOAC SMPR® 2016.001. J. AOAC Int. 2019, 99 (4), 1120–1.
- Zhang, J. Hand Sanitizer Analysis Using the Agilent 8860 Gc Configured with a Flame Ionization Detector. Agilent Technol. 2020.1–8. https://www.agilent.com/cs/library/applications/application-hand-sanitizer-analysis-8860-fid-5994-2089en-agilent.pdf.
- Seelye, R.; Turney, T. The Iodoform Reaction. J. Chem. Educ. 1959, 36 (11), 572.
- Hassan, M.; Al-Hakimi, A.N.; Alahmadi, M.D. Kinetics of Oxidation of Aliphatic Alcohols by Potassium Dichromate in Aqueous and Micellar Media. S. Afr. J. Chem. 2011, 64, 237–40.
- Gettler, A.O. Critical Study of Methods for the Detection of Methyl Alcohol. J. Biol. Chem. 1920, 42 (2), 311–28.
- Holland, B.; Gilman, N. Synthesis of Acetylenic Carboxylic Acids. Synth. Commun. 1974, 4 (4), 199–10.
- Namieśnik, J. Modern Trends in Monitoring and Analysis of Environmental Pollutants. Pol. J. Environ. Stud. 2001, 10 (3), 127–40.
- Tobiszewski, M.; Mechlińska, A.; Namieśnik, J. Green Analytical Chemistry—Theory and Practice. Chem. Soc. Rev. 2010, 39 (8), 2869–78.
- Keith, L.H.; Gron, L.U.; Young, J.L. Green Analytical Methodologies. Chem. Rev. 2007, 107 (6), 2695–708.
- Flury, M.; Flühler, H. Brilliant Blue FCF as a Dye Tracer for Solute Transport Studies – A Toxicological Overview. J. Environ. Qual. 1994, 23 (5), 1108–12.
- Amchova, P.; Kotolova, H.; Ruda-Kucerova, J. Health Safety Issues of Synthetic Food Colorants. Regul. Toxicol. Pharmacol. 2015, 73 (3), 914–22.
- Swaminathan, K.; Sandhya, S.; Carmalin Sophia, A.; Pachhade, K.; Subrahmanyam, Y.V. Decolorization and Degradation of H-Acid and Other Dyes Using Ferrous–Hydrogen Peroxide System. Chemosphere 2003, 50 (5), 619–25.
- Clarke, C.E.; Kielar, F.; Talbot, H.M.; Johnson, K.L. Oxidative Decolorization of Acid Azo Dyes by a Mn Oxide Containing Waste. Environ. Sci. Technol. 2010, 44 (3), 1116–22.
- Medien, H.A.A.; Khalil, S.M.E. Kinetics of the Oxidative Decolorization of Some Organic Dyes Utilizing Fenton-Like Reaction in Water. J. King Saud Univ. – Sci. 2010, 22 (3), 147–53.
- Liu, W.; Hu, W.; Liu, J. Study on the Photoreductive Decolorization of azo Dyes by Sulfite Aqua. AIP Conference Proceedings, 2017, 1794 (1).
- Marini, A.; Muñoz-Losa, A.; Biancardi, A.; Mennucci, B. What is Solvatochromism? J. Phys. Chem. B 2010, 114 (51), 17128–35.
- Reichardt, C. Solvatochromic Dyes as Solvent Polarity Indicators. Chem. Rev. 1994, 94 (8), 2319–58.
- Nadupalli, S.; Dasireddy, V.D.B.C.; Koorbanally, N.A.; Jonnalagadda, S.B. Kinetics of Oxidation of Triaryl Methane Dye, Brilliant Blue-R with Chlorine Dioxide. S. Afr. J. Chem. 2019, 72, 40–6.
- Askarniya, Z.; Baradaran, S.; Sonawane, S.H.; Boczkaj, G. A Comparative Study on the Decolorization of Tartrazine, Ponceau 4R, and Coomassie Brilliant Blue Using Persulfate and Hydrogen Peroxide Based Advanced Oxidation Processes Combined with Hydrodynamic Cavitation. Chem. Eng. Process – Process Intensification 2022, 181, 109160.
- Williams, M.B.; Reese, H.D. Colorimetric Determination of Ethyl Alcohol. Anal. Chem. 1950, 22, 1556–61.
- Nogueira, S.A.; Lemes, A.D.; Chagas, A.C.; Vieira, M.L.; Talhavini, M.; Morais, P.A.; Coltro, W.K. Redox Titration on Foldable Paper-Based Analytical Devices for the Visual Determination of Alcohol Content in Whiskey Samples. Talanta 2019, 194, 363–9.
- Lv, F.; Gong, Y.; Cao, Y.; Deng, Y.; Liang, S.; Tian, X.; Gu, H.; Yin, J.J. A Convenient Detection System Consisting of Efficient Au@PtRu Nanozymes and Alcohol Oxidase for Highly Sensitive Alcohol Biosensing. Nanoscale Adv. 2020, 2 (4), 1583–9.