
 ?Mathematical formulae have been encoded as MathML and are displayed in this HTML version using MathJax in order to improve their display. Uncheck the box to turn MathJax off. This feature requires Javascript. Click on a formula to zoom.
ABSTRACT
Methylene blue (industrial dye) presents adverse effects on the environment. Traditionally, this dye is removed by adsorption with commercial activated carbon. Researchers are exploring low-cost alternatives using agro-industrial waste. This study evaluates Chandler-type walnut shells for removing methylene blue from aqueous solution. Batch experiments with two nominal sizes reveal that pseudo-second-order kinetics best describe adsorption. Langmuir isotherms show adsorption capacities of 8.636 and 38.46 mg g−1 for analyzed sizes. The best removal capacity (97%) was observed for smaller particle sizes (2.36–1.18 to 1.18–0.6 mm) with an initial concentration of 200 mg L−1. High initial concentrations decrease removal due to porous saturation. The best removal capacity in continuous systems is 50.47 mg g−1, with a saturation time of 8 hours at 5 cm bed height, adsorbent size 1.18–0.6 mm, 60 mg L−1 initial concentration, and 15 mL min−1 flow rate. The Thomas model best fits the data, suggesting external mass transfer and intra-particle diffusion. This study provides crucial insights for scaling processes and shows a competitive removal efficiency of methylene blue using walnut shells compared to other biosorbents. Further investigation is needed to analyze channeling phenomena observed with increased bed heights in continuous systems.
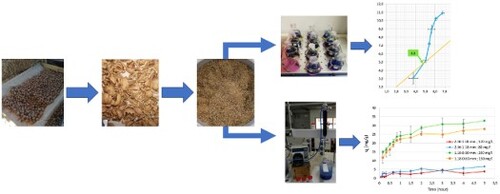
GRAPHICAL ABSTRACT
Introduction
In 2019, the United Nations Conference on Trade and Development (UNCTAD) mentioned that the second most polluting industry worldwide is the textile industry, accounting for 20% of global wastewater, surpassing industries such as manufacturing, energy, transportation, and even food. This is due to the phenomenon of ‘Fast Fashion’ driven by rapid trends and low prices of garments. According to UNCTAD, the fashion industry is estimated to annually consume 93,000 billion cubic meters of water, a volume that could meet the needs of 5 million people [Citation1].
More than 700,000 metric tons of dyes are produced worldwide each year [Citation2], and the textile industry is estimated to consume approximately 56% of the global production of artificial dyes [Citation3]. Approximately 10-15% of the dye is lost in the effluent without any treatment [Citation4].
Methylene blue is a widely used dye in the production of paper, textiles, and leather, is an organic compound with a complex molecular structure [Citation6]. The discharge of this dye into the environment causes aesthetic and toxicological issues. It is a synthetic basic dye that contains complex aromatic structures, is inert and is difficult to biodegrade when discharged into waste streams [Citation3].
The discharge of dyes, like methylene blue, into aquifers has adverse effects on aquatic life due to the decrease in photosynthesis or inhibition of the reaction of oxidizing agents. Recent studies have also shown that some dyes tend to undergo chemical reactions in an exposed environment, resulting in even more toxic substances than the original dye. Blue dyes have demonstrated to be more toxic than red ones, highlighting the importance of their removal [Citation2,Citation5].
The most common treatments for dye removal in high concentration include chemical precipitation and biological treatments [Citation3]. Microfiltration processes have shown effectiveness in treating a wide range of dyes but often encounter frequent membrane pore blockages, limiting their application to textile effluent treatment. On the other hand, reverse osmosis exhibits better efficiency in trapping salts rather than weak acids, weak bases, and smaller organic molecules with a molecular weight below 200. However, both treatments present high operating costs [Citation7].
For coagulation/flocculation of dyes, agents such as aluminum (Al+3), calcium (Ca+2), or ferric ions (Fe+3) are commonly employed. While these agents are efficient and cost-effective in removing certain dyes, they generate significant amounts of sludge. The process is highly pH-dependent and is not recommended for highly soluble or azoic, reactive, acidic, and basic dyes [Citation7].
Biological treatments have been widely used in dye treatment and can be anaerobic, aerobic, or a combination of both. Aerobic treatments show high efficiency for dye removal, with some fungi capable of decolorizing a wide range of dyes. However, the effectiveness of the treatment depends on factors such as initial concentration, initial pH, effluent temperature, and dye type [Citation8]. Anaerobic treatments have shown advantages in treating azoic dyes.
Mixed biological treatments often involve anaerobic treatment followed by aerobic treatment for effluents. While this treatment is cost-effective and can be used for different dyes, the systems present lower operational flexibility and require large land areas and long treatment times. In the case of aerobic processes, they are expensive due to aeration systems and cannot continuously remove dyes [Citation7].
Concerning physical processes, adsorption stands out as it offers low costs, simple design and application, high efficiencies, biodegradability, and the ability to treat highly concentrated dyes [Citation3]. The preferred adsorbent used in adsorption processes is activated carbon. However, activated carbon is expensive and cannot be regenerated. As a result, numerous studies have been conducted in the last years to develop low-cost bioadsorbents using agricultural materials or other biological waste, whether in their natural state or as non-activated or activated carbons [Citation9,Citation10].
Studies have used waste materials such as rice husks, tree bark, human hair, sawdust, fruit peels, and more. These studies have demonstrated the effectiveness of these agro-industrial residues, whether in their natural state or as precursors for activated carbons. Their main advantage lies in their low cost compared to commercial carbons and their efficiency [Citation9,Citation10]. Concerning dyes removed from wastewater, nutshell has presented a good performance in eliminating methylene blue using directly like biosorbent or in the form of activated carbon, however, the efficiency of removal shows a high dependency on operation conditions, and for this reason, is necessary to increase studies in relation to the use of this agro-industrial waste in wastewater treatment [Citation11,Citation12].
In this context, the present research aims to analyze the potential of nutshell (Juglans regia) for methylene blue removal from an aqueous solution, to evaluate its possible use as a bioadsorbent. To achieve this objective, batch and continuous adsorption tests were conducted to identify the kinetic characteristics of the process and obtain breakthrough curves, with the novelty of providing the minimal necessary information for scaling up the methylene blue adsorption process, with the use of walnut shell like adsorbent agent, from laboratory scale to industrial production scale in subsequent stages of this research.
Materials and methods
Preparation of bioadsorbent [Citation13]
The Chandler Walnut variety nutshell was utilized as a bioadsorbent in this study. The nutshells were dried for one month at ambient temperature during the summer in the central zone of Chile (Chincolco, Valparaíso Region). Subsequently, the nutshells were meticulously washed with drinking water and grade II distilled water. They were then crushed and dried at 80 °C for 24 hours in a convective oven (Zhicheng model ZXRD/ZXFD). The dried nutshells were sieved (Ortoalresa model OASS203) to obtain two fractions. The first fraction with nominal size between 2.36 and 1.18 mm, and the second fraction between 1.18 and 0.60 mm, were sieved using meshes #8, #16, and #30 U.S. STD (Gilson). The fraction with a nominal size between 2.36 and 1.18 mm was characterized by determining its point of zero charge according to method propose for Amaringo Villa et al. [Citation14].
Stock solution preparation
Analytical grade methylene blue (ChemiX, 99% purity) was utilized for the preparation of the stock solution. A stock solution with a concentration of 1000 mg/l was obtained, and grade II distilled water was used for dilution.
Method for methylene blue quantification [Citation13]
The concentration of methylene blue was determined using UV-visible spectrophotometry (Optizen Pop model Mecasys) and quantified through the calibration curve method, with detection at a wavelength of 665 nm. The calibration curve was constructed using methylene blue solutions with concentrations of 1.5, 2.0, 2.5, 3.0, 4.0 and 4.5 mg/l, prepared from stock solution with necessary dilutions to obtain previously-defined concentrations.
Adsorption isotherm analysis [Citation15]
Adsorption isotherm analysis was conducted under batch conditions using 100 mL Erlenmeyer flasks. Nutshell samples were added to 30 mL solutions of methylene blue with concentrations ranging from 80 to 200 mg/L. The mixtures of methylene blue solutions and nutshells were agitated using an orbital shaker (Dragon Laboratory Instruments Limited model Orbital Shaker SK-03330-Pro) at a speed of 200 rpm for 24 hours. After the agitation, the samples were vacuum-filtered through a cellulose filter with a pore size of 45 µm (Sartorius), and subsequently analyzed using UV-Vis spectrophotometry.
Kinetic analysis
Kinetic analysis was performed under batch conditions for both fractions of nutshells. Initial concentrations of 100, 150, and 200 mg/L were used for the fraction with a nominal size between 1.18 and 0.6 mm, while for the fraction with a nominal size between 2.36 and 1.18 mm concentrations of 80, 100, and 120 mg/L were used. The samples were placed in 100 mL Erlenmeyer flasks and subjected to agitation using a shaker (Dragon Laboratory Instruments Limited model Orbital Shaker SK-03330-Pro) at 200 rpm for five hours. Subsequently, the collected samples were vacuum-filtered through a cellulose filter with a pore size of 45 µm (Sartorius) and analyzed using UV-Vis spectrophotometry.
Continues adsorption analysis [Citation16]
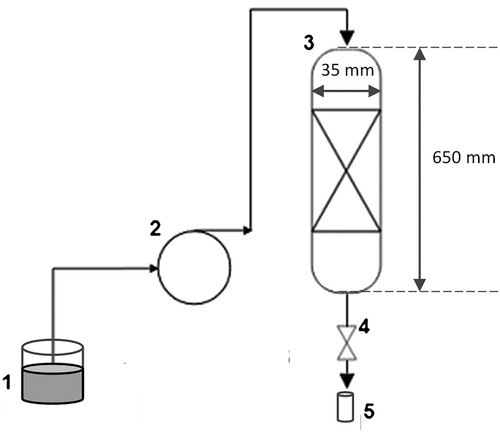
Continuous adsorption experiments were performed in a cylindrical glass column that had an internal diameter of 3.5 cm and a height of 65.0 cm. In this experiment, a methylene blue solution was pumped in a downward flow mode at a flow rate of 15 mL/min using a peristaltic pump (Masterflex L/S model 0752810), as illustrated in . Under these conditions, the effects of the initial concentration of methylene blue nominal size: 1.18–0.6 mm; fixed bed height: 5 cm; initial concentration of methylene blue: 40, 60, and 80 mg/L [Citation17], fixed bed height (nominal size: 1.18–0.6 mm; fixed bed height: 5, 8, and 10 cm; initial concentration of methylene blue: 60 mg/L), and nominal size (nominal size: 2.36–1.18 and 1.18–0.6 mm; fixed bed height: 8 cm; initial concentration of methylene blue: 60 mg/L) were analyzed. Samples were collected at different time intervals ranging from 10 to 30 minutes to monitor the progress of the adsorption process.
Figure 1. Experimental setup: (1) methylene blue solution; (2) peristaltic pump; (3) glass column; (4) flow regulation valve (manual); and (5) sample collector.
Samples were collected at different time intervals ranging from 10 to 30 minutes to monitor the progress of the adsorption process. The collected samples were analyzed using UV-Vis spectrophotometry.
Estimation of adsorption capacity
For batch and continues analysis, estimation of the amount of adsorbed dye per gram of biosorbent at a time t (qt) was calculated by:
(1)
(1) where c0 and ct (mg/l) are the methylene blue concentrations in the liquid-phase at times 0 and t, respectively; m (g) is the mass of adsorbent used; and V (L) is the volume of the solution for batch experiment, and the total volume of solution pumped at time t for continued experiments (flux•time/1000)
The graphs present all the results with error bars representing a 95% confidence interval.
Results and discussion
Point of zero charge
illustrates the Point of Zero Charge (PZC) of the two analyzed nominal sizes. Both nominal sizes can be observed to exhibit a PZC value of 4.8. However, considering the confidence interval, the PZC ranges from 5.3 to 3.8.
Figure 2. Point of zero charge for different nominal size.
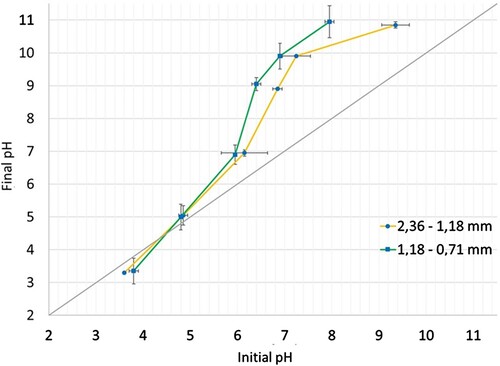
Miyah and Lahrichi [Citation18] reported a Point of Zero Charge (PZC) value of 5.8 for shellnut, compared with the values obtained in this research, which has observed a difference of 17.3%. This variation could be attributed to using different types of nuts in the studies. Based on these results, the pH of the initial solutions in this study was adjusted for values higher than 6.2 to promote the adsorption process.
Batch analysis (isotherms and kinetic analysis)
Effect of nominal size
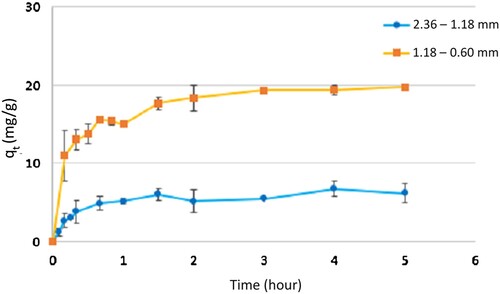
The results presented in demonstrate a superior adsorption performance for smaller nominal sizes, achieving a removal percentage of 97%. In contrast, the larger nominal size only presents a removal percentage of 31%. This trend is anticipated as the reduction in nominal size increases the mass transfer area, thereby enhancing the adsorption process. It is significant to indicate that the removal percentage for smaller sizes (97%) is comparable to the findings reported by Tang et al. [Citation19] for a nominal size between 0.1770 and 0.1250 mm under similar experimental conditions utilized in this research.
Figure 3. Effect of nominal size in adsorption capacity (adsorption isotherm).
The results for fitting the experimental data to the first and second-order kinetic models for different nominal sizes and initial concentrations are presented in . For all analyzed cases, both in terms of the coefficient of determination (R2) and the predicted equilibrium concentration (qe), the second-order model can be observed as providing the best fit (R2 higher than 0.89). This suggests that the adsorption process involves a chemisorption mechanism; in these cases, surface functional groups should have a high chemical affinity with methylene blue that should be proven with a surface functional groups analysis.
Table 1. First and second order fit parameters for kinetic analysis (estimated with a confidence interval of 95%).
Effect of initial methylene blue concentration
Regarding the effect of initial methylene blue concentration (), an increase in the initial concentration has been observed to lead to a reduction in the removal percentage for both analyzed nominal sizes. For the fraction with a nominal size between 2.36 and 1.18 mm, the removal percentage decreases from 42% at an initial concentration of 80 mg/L to 16% at an initial concentration of 120 mg/L. Similarly, for the fraction with a nominal size between 1.18 and 0.60 mm, the removal capacity (qt) analyzed as a percentage shows a decrease from 93% for an initial concentration of 150 mg/L to 83% for an initial concentration of 200 mg/L. This decrease in removal efficiency can be attributed to the rapid saturation of the surface active sites as the quantity of adsorbate in the solution increases. Previous studies have demonstrated a high variability in the reported BET (Brunauer–Emmett–Teller) surface areas for this raw material, without a clear correlation with particle size [Citation20–22]. However, the modification in surface functional groups observed in the walnut shell after adsorption could explain this decline in removal capacity, primarily due to the rupture of surface functional groups that facilitate interaction [Citation23,Citation24].
Figure 4. Effect on adsorption isotherms of initial methylene blue concentration for different nominal size.
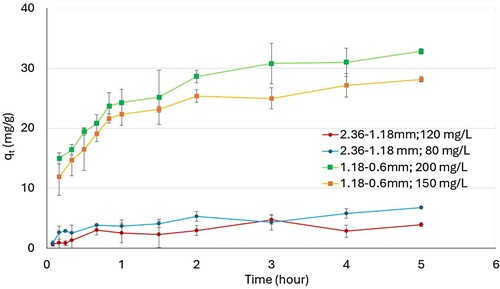
In terms of adsorption capacity, the parameter increases with an increase in the initial concentration of methylene blue for the fraction with a nominal size between 1.18 and 0.60 mm (from 29.35 mg/g at an initial concentration of 150 mg/L to 38.19 mg/g at an initial concentration of 200 mg/L). However, for the nominal size between 2.13 and 1.18 mm, no significant difference in adsorption capacity has been observed (9.435–9.505 mg/g).
For the curve fitting results for the Langmuir and Freundlich models, presented in for both analyzed nominal sizes in this research, an appropriate fit is observed for all analyzed models, capable of depicting the trends of the curves. A higher slope is verified for the larger particle size.
Figure 5. Langmuir and Freundlich fit for nutshell with nominal size of (A) 2.36 −1.18 mm and (B) 1.18–0.60 mm (estimated with a confidence interval of 95%).
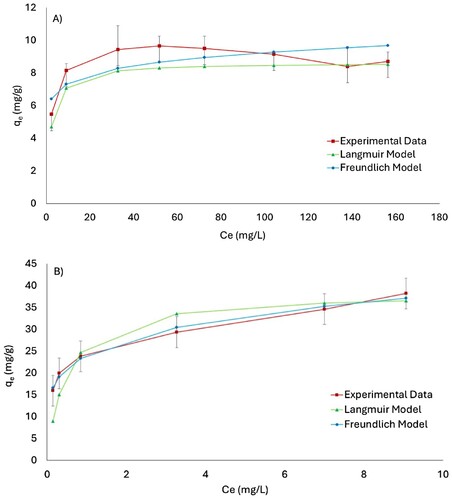
The general analysis of the fitted experimental data for the Langmuir and Freundlich models () reveals a good fit of the Langmuir model for both analyzed particle sizes; however, for the Freundlich model, satisfactory fitting parameters are observed only for the smaller particle size. In terms of the coefficient of determination (R2) values, the Langmuir model provides the best fit for both nominal sizes. This indicates that a monolayer model is suitable for describing the adsorption process; however, noting that the narrow difference between the coefficients of determination values of both analyzed models for the smaller particle size could indicate a mixed phenomenon in these particles, is essential.
Table 2. Langmuir y Freundlich fit parameters for adsorption isotherms (estimated with a confidence interval of 95%).
Furthermore, when considering the theoretical adsorption capacity (qm) obtained from the Langmuir model, the value for the nominal size between 1.18 and 0.60 mm (38.46 mg/g) is comparable to the reported values for hazelnut, which is 38.22 mg/g [Citation14], and for nutshell, which is 48.77 mg/g [Citation19].
The best fit of Langmuir model reaffirms that the adsorption phenomenon is mainly a surface phenomenon, which was already suggested by the kinetic model, indicating the importance of surface functional groups in adsorption process for nutshell and methylene blue.
Continues adsorption
Effect of initial concentration of methylene blue
The breakthrough curve for different initial concentrations in a continuous process, as depicted in , demonstrates that an increase in the initial concentration of methylene blue has a similar effect as reported in the state of the art, impacting the saturation velocity of the system. This effect is observed through an increased slope of the curve and a decrease in saturation times [Citation25]. The dashed line represents the data obtained by applying the Thomas model until achieving 97% saturation. According to the observed breakthrough curves, the Thomas model is noted to fit within the error band for all the experimental data, except for the system with an initial concentration of 80 mg/L.
Figure 6. Breakthrough curve fit for Thomas model at different initial concentration of methylene blue (nominal size: 1.18–0.6 mm) (estimated with a confidence interval of 95%).
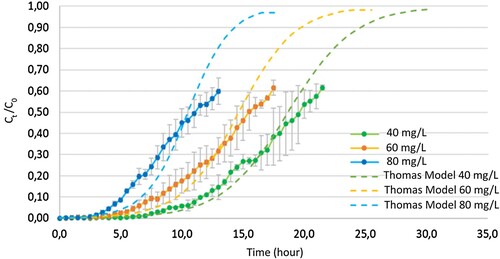
According to the data presented in , there is an increase in the total mass of the adsorbent that is observed with an increase in the initial concentration. Specifically, the total mass of the adsorbent increases from 774 mg for an initial concentration of 40 mg/L to 936 mg for an initial concentration of 80 mg/L. However, it is worth noting that despite the increase in the total mass of the adsorbent, the removal percentage decreases from 82.69% to 76.10%.
Table 3. Experimental parameters of breakthrough curve for different initial concentration of methylene blue (nominal size: 1.18–0.6 mm).
The increase in adsorption capacity is partial because as the inlet concentration increases, the driving force for the adsorption process increase, facilitating the interaction between methylene blue molecules and the walnut shell [Citation17]. However, this is not sustainable because without increasing the total amount of adsorbent in the column, adsorption sites will saturate. As a result, at higher inlet concentrations, more dye molecules remain unadsorbed, generating a decrease in column efficiency [Citation16]. Similar behavior is observed for peanut shells, where an increase in concentration from 40 to 60 and then to 80 mg/L results in capacities of 34.69, 42.22, and 40.21 mg/g, respectively [Citation17].
Previous research indicates that, as a concentration of methylene blue in the feed decreases, the breakthrough curve decreases its slope. This trend indicates that the mass transfer zone within the column and the adsorption process are controlled by film absorption [Citation2]. On the other hand, with increasing concentration, the breakthrough curves become steeper and well defined, implying a smaller mass transfer zone and thus an adsorption process controlled by intraparticle diffusion [Citation16].
These results suggest that the saturation of shellnut is inversely proportional to an initial concentration of methylene blue; however, values of qexp do not present a lineal trend, possibly related to surface functional group availability. To delve deeper into these results, it is necessary to perform an analysis of surface functional groups.
present fit parameters for Thomas Model. All experiments have been observed to have coefficient of determination values close to 1 and error values below 10%, indicating a good fit of experimental data with this model. This indicates that the studied system adheres to the assumptions predicted by Thomas, where the equilibrium follows the Langmuir model, under reversible second-order kinetics and without axial dispersion, confirming the results obtained in the batch mode experiments.
Table 4. Thomas Model fit parameter for different initial concentration of methylene blue (nominal size: 1.18–0.6 mm) (estimated with a confidence interval of 95%).
Regarding the effect of the initial adsorbate concentration, an increase in the initial concentration of methylene blue leads to a decrease in the value of KTH, from 0.0001550 l/min mg for a concentration of 40 mg/L to 0. /min mg for 80 mg/L, which is consistent with the findings of Afroze & Kanti, where increasing the concentration from 50 to 100 mg/L results in a decrease in the Thomas constant from 0.000394 to 0.000259 l/min mg [Citation16].
Furthermore, the value of q0 experiences an increase when the concentration is raised from 40 to 60 mg/l, and a slight decrease when increased to 80 mg/l, compared to the value obtained for 60 mg/l. This follows a similar trend observed in other bioadsorbents, such as corn stalk, where an increase from 5 to 20 mg/l results in an increment in q0 from 31.92 to 45.57 mg/g [Citation19].
Effect of bed height
The breakthrough curves for different bed heights are presented in . An increase in bed height results in a decrease in the slope of the curve and an increase in the saturation time. This trend is consistent for the curves with bed heights of 5 cm and 8 cm, which show a continuous increase within the analyzed time range. However, a different trend is observed for the curve with a bed height of 10 cm. Instead of a continuous increase, this curve exhibits two plateaus.
Figure 7. Breakthrough curve fit for Thomas model at different bed height (nominal size: 1.18–0.6 mm) (estimated with a confidence interval of 95%).
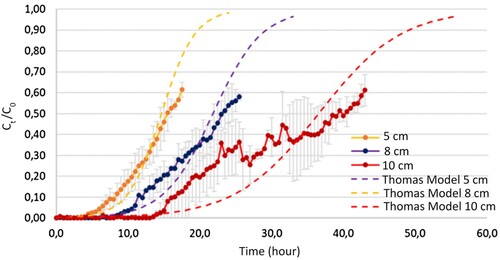
The existence of these plateaus has been associated with the occurrence of channeling within the adsorbent column during the experimental procedure. This phenomenon alters the velocity profiles within the bed and creates axial flows that affect the downward movement of the methylene blue solution, generating an uneven velocity profile, with preferential zones of flow advance, that generate two effects: (1) different retentions time in different zones of the column because generated channels are different from each other in diameter and size increasing the variability of the process, and (2) a decrease in mass transference area because for zones without channels, the flow of methylene blue is minimum and generates a decrease in the efficiency of the adsorption process. As a result, there is a decrease in total removal efficiency because not all the available adsorbent is effectively utilized, leading to an apparent higher saturation than what would occur without the occurrence of channeling, and the difference in velocity profile and retention time generates a difference in concentration at a different time of collection, because they are not a representation of a total concentration, but a discrete concentration [Citation26]. This phenomenon shows the need of a good filter design to guarantee a good performance in the adsorption process.
In , the dashed line represents the data obtained by applying the Thomas model until achieving 97% saturation. According to the observed breakthrough curves, the Thomas model is noted to fit within the error band for all the experimental data, including the bed height of 10 cm that presents plateaus.
According to the general data obtained from the breakthrough curves (), the breakthrough time is observed to double when the bed height is doubled, increasing from 8 hours for a height of 5 cm to 16.5 hours for a height of 10 cm. This is consistent with the findings reported by Hamdaoui [Citation27] and Yan [Citation25].
Table 5. Experimental parameters of breakthrough curve for different bed height (nominal size: 1.18–0.6 mm).
Similarly, the amount of treated methylene blue also increases, rising from 945 mg to 2322 mg. These responses are attributed to the increased surface area within the column. With the increase of adsorbent quantity in the fixed bed, the number of available sites for adsorption and the contact time between the adsorbent and the adsorbate increases. Consequently, a more amount of adsorbate can be treated.
The general parameters obtained from the Thomas model () show that as the bed height increases, the values of the coefficient of determination (R2) decrease; however, the error values are below 10%. Consequently, the experimental data no longer fit well with the model. This discrepancy is caused by the observed channeling phenomenon that occurs with an increase in bed height. The formation of channels leads to dry zones within the bed, reducing the available contact surface area and, therefore, the efficiency of the column [Citation26].
Table 6. Thomas model fit parameter for different bed height (nominal size: 1.18–0.6 mm) (estimated with a confidence interval of 95%).
Furthermore, the value of the Thomas constant decreases as the bed height increases, dropping from 0.0001200 l/min mg to 0.00004833 l/min mg for bed heights of 5 cm and 10 cm, respectively. This trend aligns with what has been described for other types of bioadsorbents, such as eucalyptus bark [Citation16], peanut shell [Citation28], and activated carbon from nutshell [Citation29], among others.
Similarly, there is a decrease in the value of q0, going from 52.79 to 50.78 mg/g when increasing the bed height from 5 cm to 10 cm, respectively. A similar trend is observed for eucalyptus bark (Sheathiana), where an increase in bed height from 10 cm to 15 cm generates a decrease in q0 from 49.55 to 41.83 mg/g [Citation16].
In the data analysis, we applied the Thomas model to describe the breakthrough curve behavior. The constants of the Thomas model, such as q0 and kTH, play a crucial role in determining the fit of the model to the experimental data. These constant values were derived from previous studies and were adjusted according to the experimental conditions of our study. However, results suggest that the presence of the channeling phenomenon in the 10 cm column has significantly affected the fit of the Thomas model to the experimental data.
The channeling phenomenon alters flow velocities within the column, creating axial flows that affect the downward movement of the methylene blue solution. This results in uneven velocity profiles with preferential zones of flow advancement, leading to (1) different retention times in different zones of the column due to channels of varying diameters and sizes, and (2) a decrease in mass transfer area, thus reducing the efficiency of adsorption [Citation26].
Applying the Thomas model to the experimental data shows a good fit within the error margin for all column heights, including the 10 cm column which exhibits the plateaus. However, as the column height increases, the Thomas model constants, kTH and q0, decrease, indicating a reduction in adsorption efficiency. This trend is consistent with findings reported by Hamdaoui [Citation27], Yan [Citation25], and other studies on bioadsorbents [Citation16, Citation28, Citation29].
It is important to note that other studies do not mention the channeling phenomenon, but it is possible that this phenomenon has affected the results and the fit of the Thomas model in those studies. Differences in hydrodynamic systems can affect the basic assumptions of the Thomas model and explain the poor fit observed under these operating conditions.
The constants of the Thomas model are closely related to the hydrodynamics of the system. The presence of the channeling phenomenon, by affecting velocity profiles in the adsorbent bed, could cause these deviations. However, there are no previous studies that analyze this phenomenon, for this reason, this phenomenon will be addressed in an extension of the present research.
Effect of nominal size
According to the general data of the breakthrough curve presented in , it is observed that as the size increases, the breakthrough time increases from 11.5 hours for nominal size between 1.18 and 0.60 mm to 1.7 hours for nominal size between 2.36 and 1.18 mm. The same trend is observed for the amount of methylene blue removed, which decreases from 1377 mg to 234 mg, as well as the removal percentage, which decreases from 81.24% to 71.95% for fractions with nominal size 1.18–0.60 mm and 2.36–1.18, respectively. This occurs because as the size of the adsorbent increases, the surface area decreases, resulting in fewer available sites for adsorption. As a result, the overall performance of the column decreases [Citation28].
Table 7. Experimental parameters of breakthrough curve for different nominal size.
The breakthrough curves for the two nominal sizes analyzed in this study are presented in . As the nominal size decreases, the slope of the curve is observed to decrease, and the saturation time to increase. The dashed line represents the data obtained by applying the Thomas model until achieving 97% saturation. According to breakthrough curves, the Thomas model is noted to fit within the error band for the breakthrough curve with a smaller nominal size, but the model did not show a good fit for a nominal size between 2.36 and 1.18 mm.
Figure 8. Breakthrough curve fit for Thomas model at different nominal size (estimated with a confidence interval of 95%).
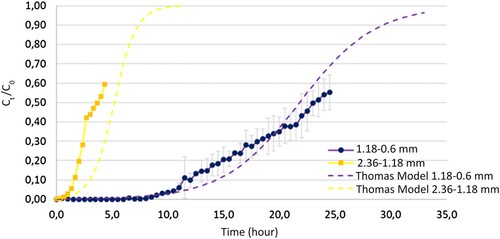
According to the data obtained in , the Thomas constant is observed to increase when the particle size of the adsorbent increases. Specifically, it increases from 0.00008167 to 0.0004183 l/min mg when the particle size changes from 1.18–0.6 mm to 2.36–1.18 mm, respectively. A similar trend is reported in studies conducted on activated carbon from Hyphaene Petersiana nutshell, where an increase in particle size from 0.250 to 0.850 mm results in an increase in KTH from 0.0112 to 0.0180 l/min mg [Citation29]. On the other hand, the value of q0 increases when the particle size decreases, going from 3.581 to 45.40 mg/g.
Table 8. Thomas Model fit parameter for different nominal size (estimated with a confidence interval of 95%).
These results indicate that for the biggest particle size analyzed it is possible that a decrease in mass transfer area generates a decrease in availability of surface functional groups. In order to prove these suppositions a surface functional groups analysis is needed.
The results presented in for batch tests show that the percentage of walnut shell removal for the smallest analyzed particle size is comparable to the results reported for other materials obtained from agro-industrial waste for methylene blue removal, where it is important to highlight that these are presented in the form of activated carbon and not like biomass without thermic or chemist treatment. A better fit for second-order kinetic models, which follows the trend observed in the state of the art, is also observed, thus reaffirming the observation that surface adsorption phenomena and their relationship with surface functional groups are likely the most important mechanisms for this type of materials in adsorption process, in relation to the results of fit for adsorption models present in for the same experiments, with betters values of R2 for Langmuir model. Therefore, it is necessary to expand this study to include surface characterization of the walnut shell. It is not possible to suggest an effect of pzc in the results because most studies do not report this parameter in their results.
Table 9. Comparative data for kinetic analysis of bioadsorbents derived from waste biomass in methylene blue adsorption for batch experiments.
Table 10. Comparative data for adsorption models of bioadsorbents derived from waste biomass for removing methylene blue in batch experiments.
shows that when comparing the experimental q values of walnut shell with other agro-industrial residues used as adsorbents in continuous removal processes, the smallest analyzed particle size present comparable values with peanut shell, as well as hazelnut shell, and above the values of rice straw. However, it is below the values presented by materials, such as banana peel and straw, among others. It is interesting to observe that the behavior of walnut shell residue is similar to that of other residues of the same family (nuts), which suggests that the interaction with methylene blue is probably similar, possibly associated with similarity in the surface structure of the shell and superficial functional groups. This reaffirms the need to expand this study to include surface characterization of the raw material. It is also important to note that the absorption capacities of walnut shell could be improved by converting the residue into activated carbon.
Table 11. Comparative data for different agro-industrial waste used like adsorbents in continuous adsorption process.
While this study has provided valuable insights into the adsorption of methylene blue using common walnut shell as a biosorbent, several aspects warrant further investigation in future research. Particularly, the desorption of the adsorbed contaminants and the treatment of the generated waste materials are critical aspects that have not been fully analyzed in this study. The desorption process is essential for understanding the reusability of the biosorbent and the potential release of contaminants back into the environment. Additionally, the treatment and disposal of the waste materials generated during the adsorption process are crucial for ensuring the environmental sustainability of the overall treatment system. Therefore, future studies should focus on these aspects to provide a more comprehensive understanding of the entire adsorption–desorption-waste treatment cycle, ultimately leading to the development of more sustainable and efficient wastewater treatment processes [Citation44].
Conclusion
The point of zero charge (pzc) of the walnut shell was identified within an acidic pH range of 5.2–3.8, with a 95% confidence interval, thereby indicating the acidic nature of the pzc of the walnut shell at pH 4.8.
The results indicate a favorable adsorption of methylene blue onto the walnut shell. The Langmuir model provides a superior fit to the equilibrium data, suggesting the formation of a monolayer during the adsorption process. The observed adsorption capacities of 8.636 mg/g for the larger nominal size, and 38.46 mg/g for the smaller nominal size highlight the potential of walnut shell as an effective adsorbent for methylene blue removal.
In batch mode, a decrease in particle size from 2.36–1.18 mm to 1.18–0.6 mm was observed to result in an increase in removal percentage from 31% to 97%, and an increase in adsorption capacity. This can be attributed to the increased surface area of each adsorbent particle, providing more available spaces for dye adsorption. Regarding the effect of initial adsorbate concentration, an increase in concentration from 150 to 200 mg/L, for the nominal size between 1.18 and 0.60 mm, led to a decrease in removal percentage from 93% to 83%, and an increase in adsorption capacity. This suggests a potential saturation effect at higher initial concentrations, influencing the adsorption behavior of the walnut shell material.
For all the analyzed conditions for the batch process, the second-order kinetics model provided the best fit, suggesting that the studied system follows a monolayer adsorption process. This observation underscores the significance of surface adsorption phenomena and the formation of monolayer coverage in the adsorption mechanism of the walnut shell material.
From the continuous removal analysis, the maximum removal capacity is observed to be 50.47 mg/g for a bed height of 5 cm, an initial concentration of 60 mg/L of methylene blue, fed at a constant flow rate of 15 mL/min, and with a nominal size between 1.18-0.6 mm. This configuration achieves a removal efficiency of 80.13% with a 60% saturation level. The breakthrough time is 8 hours, with 50% saturation occurring after 15.5 hours of operation.
The Thomas model provides a correct fit to the breakthrough curves (error under 10%), reaffirming the results obtained in the batch mode. Its assumptions, which consider a Langmuir-type equilibrium curve, are in line with the observed behavior in the continuous removal process. A better fit to the Langmuir model implies that the adsorption process follows a monolayer mechanism, where adsorption sites on the adsorbent surface are occupied sequentially until saturation is reached. This suggests that the adsorption of methylene blue onto the walnut shell occurs predominantly at specific, energetically favorable sites, resulting in the formation of a monolayer.
The results of methylene blue removal capacity, using nutshell as an adsorbent, are similar to those presented in other publications, for both nutshell and other types of bioadsorbents. This indicates that there is potential for the use of this material in the removal of contaminants, specifically dyes. However, the results suggest that the analyzed adsorption process is closely related to the surface functional groups of the raw material that is used. Therefore, it is suggested to expand this work in a second stage, including comprehensive characterization of the raw material and analysis of the fit of other mathematical models like Khan, Toth, Sips and Redlich – Peterson models, among others.
Concerning scaling-up of the adsorption process, these results provide the minimum necessary information that is required (breakthrough curve). However, the occurrence of channels in the continuous process when increasing the bed height, which leads to a decrease in the fit coefficient of the Thomas kinetic model, suggests that further research is needed. It is necessary to consider scaling up the experimentation to analyze the effect of channeling phenomenon when increasing the scale of operation.
Acknowledgments
The authors of this work would like to thank 'Proyecto InES Género USM' for funding the publication of this article.
Disclosure statement
No potential conflict of interest was reported by the author(s).
References
- UNCTAD, Trade and Development Report 2019, United Nations Conferences on Trade and Development, September 25, 2019, pp. 41–70, https://unctad.org/system/files/official-document/tdr2019ch3_en.pdf (accessed Jul 3 2023).
- Ortega, G.C.C.; Arrieta, B.M.C.; Guerrero, J.F.S.; Taboada, J.E.V. Prospect 2013, 11 (1), 66–75.
- Subramaniam, R.; Kumar, S. Water Res. Ind. 2015, 11, 64–70.
- Cherifi, H.; Fatiha, B.; Salah, H. Appl. Surf. Sci. 2013, 282 (1–2), 52–59.
- Etim, E.U. Biomed. J. Sci. Tech. Res 2019, 15 (3), 11365–11371.
- PUBCHEM, National Library of Medicine. https://pubchem.ncbi.nlm.nih.gov/compound/Methylene-blue (Accessed 3 Jul 2023)
- Gupta, V.K.; Suhas, K. J. Env. Manag. 2009, 90 (8), 2313–2342.
- Bal, G.; Thakur, A. Mater. Today Proc. 2022, 50 (5), 1575–1579.
- Bilal, M.; Ihsanullah, I.; Younas, M.; Ul Hassan Shah, M. Sep. Purif. Tech. 2021, 278, 119510–119538.
- Ho, S. Water 2022, 14, 3203–3240.
- Albatrni, H.; Qiblawey, H.; Al-Marri, M.J. J. Water Proc. Eng. 2022, 45, 102527–102546.
- Jahanban-Esfahlan, A.; Jahanban-Esfahlan, R.; Tabibiazar, M.; Roufegarinejad, L.; Amarowicz, R. RSC Adv. 2020, 10, 7026–7047. doi:10.1039/c9ra10084a.
- Oladoja, N.A.; Aboluwoye, C.O.; Oladimeji, Y.B.; Ashogbon, A.O.; Otemuyiwa, I.O. Desalination 2008, 227 (1–3), 190–203.
- Amaringo Villa, F.A.; Hormaza Anaguano, A. Rev. Investig. Agrar. Ambient. 2013, 4 (2), 27–36.
- Doǧan, M.; Abak, H.; Alkan, M. Water Air Soil Pol. 2008, 192 (1–4), 141–153.
- Afroze, S.; Kanti, T. Res. Chem. Int 2015, 42, 2343–2364.
- Song, J.; Zou, W.; Bian, Y.; Su, F.; Han, R. Desalination 2011, 265 (1–3), 119–125.
- Miyah, Y.; Lahrichi, A.; Idrissi, M.; Khalil, A.; Zerrouq, F. Surf. Int. 2018, 11, 74–81.
- Tang, R.; Dai, C.; Li, C.; Liu, W.; Gao, S.; Wang, C. J. Chem. 2017, 2017, 1–10.
- Liu, M.; Li, X.; Du, Y.; Han, R. Bioresour. Technol. Rep 2019, 5, 238–242.
- Banerjee, M.; Basu, R.K.; Das, S.K. Process Saf. Environ. Prot. 2018, 116, 693–702.
- Popoola, L.T. Heliyon 2019, 5, e02381.
- Uddin, M.K.; Nasar, A. Sci. Rep. 2020, 10, 7983–7996.
- Farch, S.; Yahoum, M.M.; Toumi, S.; Tahraoui, H.; Lefnaoui, S.; Kebir, M.; Zamouche, M.; Amrane, A.; Zhang, J., Hadadi, A., et al. Separations 2023, 10, 60.
- Yan, K.K.; Huang, J.; Chen, X.G.; Liu, S.T.; Zhang, A.B.; Ye, Y.; Li, M.; Ji, X. Des. Water Treat. 2016, 57 (27), 12793–12803. doi:10.1080/19443994.2015.1052988.
- Stavrinou, A.; Aggelopoulos, C.A.; Tsakiroglou, C.D. Processes 2020, 8 (11), 1467–1489.
- Hamdaoui, O. J. Haz. Mat. 2006, 138 (2), 293–303.
- Djelloul, C.; Hamdaoui, O. Water Treat. 2015, 56 (11), 2966–2975.
- Wartelle, L H; Marshall, W E. J. Chem. Tech. Biotech. 2001, 76 (5), 451–455.
- Fito, J.; Abewaa, M.; Mengistu, A.; Angassa, K.; Ambaye, A.D.; Moyo, W.; Nkambule, T. Sci. Rep. 2023, 13, 5427–5444.
- Djama, C.; Bouguettoucha, A.; Chebli, D.; Amrane, A.; Tahraoui, H.; Zhang, J.; Mouni, L. Sustainability 2023, 15, 10364–10386.
- El-Bery, H.M.; Saleh, M.; El-Gendy, R.A.; El-Gendy, R.A.; Saleh, M.R.; Thabet, S.M. Sci. Rep. 2022, 12, 5499–5516.
- Al-Asadi, S.T.; Al-Qaim, F.F.; Al-Saedi, H.F.S.; Deyab, I.F.; Kamyab, H.; Chelliapan, S. Environ. Monit. Assess. 2023, 195, 676.
- Jiang, D.; Li, H.; Cheng, X.; Ling, Q.; Chen, H.; Barati, B.; Yao, Q.; Abomohra, A.; Hu, X.; Bartocci, P.; Wang, S. Proc. Safety Env. Protec. 2023, 172, 1132–1143.
- Dolas, H. J. King Saud Univ. Sci. 2023, 35 (3), 102559–102566.
- Mousavi, S.A.; Shahbazia, D.; Mahmoudia, A.; Darvishia, P. Water Qual. Res. J. 2022, 57 (1), 1–19.
- Uddin, T.; Rukanuzzaman, M.; Khan, M.; Islam, A. J. Env. Mang. 2009, 90 (11), 3443–3450.
- Zhang, W.; Dong, L.; Yan, H.; Li, H.; Jiang, Z.; Kan, X.; Cheng, R. Chem. Eng. J. 2011, 173, 429–436.
- Han, R.; Wang, Y.; Zhao, X.; Wang, Y.; Xie, F.; Cheng, J.; Tang, M. Desalination 2009, 245 (1–3), 284–297.
- Ferrero, F. J. Haz. Mat. 2007, 142, 144–152.
- Song, J.; Zou, W.; Bian, Y.; Su, F.; Han, R. Desalination 2011, 265, 119–125.
- Singh, B.; Thakur, V.; Bhatia, G.; Verma, D.; Singh, K. J. Bioremediat. Biodegrad. 2016, 7. doi:10.4172/2155-6199.1000374
- Yhon, J.; Mendoza, J.; Osorio, E.; Domínguez, M.P. Sustainability. 2023, 15, 9870.
- Azzaz, A.A.; SJellali, S.; Akrout, H.; Assadi, A.A.; Bousselmi, L. J. Clea. Produc. 2018, 201, 28–38. doi:10.1016/j.jclepro.2018.08.023