
ABSTRACT
Snow and ice determine winter forage availability for Arctic herbivores. Winter precipitation is anticipated to increase, and icing following warm spells and rain-on-snow (ROS) are likely to become more frequent. While this may reduce herbivore survival, fecundity and population growth, we can also expect behavioural and dietary responses. Here, we tested predictions from optimal foraging theory on how changing snowpack conditions influence choice of feeding craters and diet quality in a large generalist herbivore, the wild Svalbard reindeer. Snow and ice conditions over winter 2012/13 (a ‘normal’ winter with little ROS and icing) were measured in reindeer feeding craters, in paired controls one metre away and in fixed control sites. On average, feeding craters had less snow and integrated ram hardness (IRH, the force needed to reach the ground), but not less ice, than nearby controls. However, on this fine spatial scale, reindeer tended to select for microhabitat with worse snowpack conditions up to a certain level of snow (ca. 10 cm), ice (0.5 cm) and IRH (250 kg cm) in the nearby controls, reflecting the trade-off between selection for forage abundance versus accessibility in a sparsely vegetated environment. In this lichen-free system, faecal C:N ratios increased during winter as forage accessibility was increasingly restricted by snow, possibly indicating a reduction in diet quality due to changes in diet composition. Our study suggests that snowpack depth and hardness largely determine Svalbard reindeer feeding behaviour and diet quality during the course of a winter season.
The Arctic is considered one of the most sensitive regions to climate change, with rising temperatures, changing patterns of precipitation and more frequent extreme weather events in many regions (AMAP Citation2011; Stocker et al. Citation2013; Serreze et al. Citation2015). Especially during winter, models predict further increases in temperature and changes in precipitation patterns at high northern latitudes over the next few decades (Rennert et al. Citation2009; Stocker et al. Citation2013; Koenigk et al. Citation2015), and increased attention has been given to factors that influence winter forage accessibility in Arctic ungulates such as reindeer and caribou (Rangifer tarandus; reviewed in Tyler Citation2010). Snow is known to be a major behavioural constraint for ungulates – its depth, density, layer structure and hardness strongly influence the energy investment required to reach the plants and lichens beneath (Fancy & White Citation1987) and can be a significant barrier to foraging (Skogland Citation1978, Citation1984). Especially in tundra regions, strong winds can also have a hardening effect on the snowpack (Collins & Smith Citation1991). Thus, snow characteristics have been shown to strongly affect the behaviour (e.g., Adamczewski et al. Citation1988; Johnson et al. Citation2001; Lundmark & Ball Citation2008; Loe et al. Citation2016) and population dynamics of northern ungulates (Sæther Citation1997; Kumpula & Colpaert Citation2003). Especially for reindeer and caribou, ice can also block access to vegetation or increase the energetic costs to excavate it. Thaw–freeze events or ROS can cause ice layers to develop as crust ice, within the snowpack or as solid ice on the ground. In the High Arctic, where vegetation is generally of very low stature, ground ice can completely cover the vegetation (Hansen et al. Citation2010). Such feeding conditions can lead to starvation-related declines in winter body mass (Albon et al. Citation2016), survival (Solberg et al. Citation2001) and fecundity (Stien et al. Citation2012), with consequences for population dynamics (Parker et al. Citation1975; Kohler & Aanes Citation2004; Grenfell & Putkonen Citation2008; Miller & Barry Citation2009; Hansen et al. Citation2011; Hansen et al. Citation2013).
Because of these snow and ice constraints, the winter feeding behaviour of northern ungulates is constantly influenced by trade-offs between the quality, quantity and accessibility of food plants (e.g., Skogland Citation1984; Sæther & Andersen Citation1990; Johnson et al. Citation2001; Hansen et al. Citation2010). Optimal foraging theory (Westoby Citation1974; Stephens & Krebs Citation1986) predicts that large generalist herbivores will trade forage quality for quantity (or accessibility) when resource levels are low (e.g., Vivås & Sæther Citation1987; Sæther & Andersen Citation1990). The underlying rationale is that herbivores can afford to be selective when resource levels are high, implying that they can optimize their nutrient uptake, whereas they become more opportunistic when resource levels are low and energy levels become the critical factor for diet optimization (Skogland Citation1984). Few studies have been able to test these predictions in the wild, where animal–habitat interactions and nutritional behaviour reflect trade-offs between many variables, including predator pressure (Parker Citation2003). High-Arctic Svalbard represents a suitable model system as many potentially confounding factors such as predators, insect harassment, hunting, human infrastructure and interspecific competition for food are absent or negligible. It is also well suited for studying impacts of ROS and icing, as above-zero periods and ROS events occur during many winters as a result of Svalbard’s oceanic climate (Hansen et al. Citation2014). In this study, we took advantage of these features to test predictions derived from optimal foraging theory on how changes in forage accessibility influence foraging decisions and diet quality in a large generalist herbivore, the predator-free wild Svalbard reindeer (R. t. platyrhynchus). More specifically, we examined responses to changing snowpack conditions by relating variation in feeding crater characteristics to control measurements at different spatial scales. Furthermore, we used faecal C:N ratio (as an inverse proxy of nitrogen content and hence diet quality in large herbivores; Leslie & Starkey Citation1985) to test whether reduced forage accessibility due to worsening snow and ice conditions during the course of a winter may cause reduced selection for high-quality forage (MacArthur & Pianka Citation1966; Sæther & Andersen Citation1990).
Material and methods
Study area
The Arctic archipelago of Svalbard is located between 74° and 81°N and 10° and 35°E. This study was conducted during the winter of 2012/13 in Adventdalen, a glacially eroded U-shaped valley in central Spitsbergen, Svalbard’s largest island (). Longyearbyen, Svalbard’s largest settlement, is located within Adventdalen. The climate in Adventdalen can be characterized as High-Arctic under oceanic influence. Despite the high latitude, temperatures are often relatively mild during winter due to the warm West Spitsbergen Current (Piechura et al. Citation2001). Short periods of above-zero temperatures can occur throughout the winter. At sea level, snow usually covers the area from early October until the beginning of June. With a mean yearly precipitation of only about 190 mm (for standard normal period 1961–1990; www.eklima.met.no), Adventdalen is one of the driest areas in Svalbard. The common combination of dry snow and open tundra makes drifting or blowing snow an important factor in local snow distribution. South-easterly winds are dominant during winter, resulting in a typically thin snow cover and much of the snow being blown away into the sea. Trees and shrubs are absent in Svalbard, providing only a low (5–10 cm) field-layer available as food for herbivores (Rønning Citation1996; Jónsdóttir Citation2005).
Figure 1. The study area Adventdalen in central Spitsbergen, Svalbard (inset), including the city of Longyearbyen and the airport, where the nearest meteorological data are recorded. Dark grey lines are roads, black crosses are the fixed control sites (two measurement sites per cross) and white dots represent the position of measured feeding craters. Altitude is shown in 250 m intervals. Glaciers are shown in white. Map courtesy of the Norwegian Polar Institute.
Study species
We studied animals of the Adventdalen reindeer subpopulation, which has recently fluctuated around 1000 individuals (Hansen et al. Citation2013). The Svalbard reindeer is a wild subspecies endemic to Svalbard. It has several adaptations to extreme winter conditions. During summer, the animals build up stores of body fat that are considerable yet not sufficient alone to ensure winter survival and foetus development (Tyler Citation1986, Citation1987). We therefore assume that winter diet and behaviour have been under strong selection. In contrast to most other reindeer populations, they have small home ranges and usually do not undertake long-distance migrations (Tyler & Øritsland Citation1989). This sedentary behaviour reduces their energy demands for locomotion, which can be substantial in other caribou and reindeer populations travelling longer distances (Fancy & White Citation1987). Like other reindeer and caribou (Tushinskii 1949, in Bergerud & Nolan Citation1970; Bergerud Citation1974; LaPerriere & Lent Citation1977), the Svalbard reindeer show a remarkable ability to detect ice-free microhabitat under the snowpack, which has been attributed to their olfactory senses (Hansen et al. Citation2010). The concave-shaped hooves have sharp fore-edges, with which they can break through ice layers and scrape away the snow while feeding (Skogland Citation1978). In doing so, especially in deeper snow, they dig characteristic ‘feeding craters’ (Supplementary Fig. S1a, b).
Svalbard reindeer are generalist herbivores in an extreme low-productivity environment. They feed on most available plant species and have been shown to adjust their feeding preferences opportunistically to changing conditions (Staaland et al. Citation1993; Bjune Citation2000; Bjørkvoll et al. Citation2009; Hansen & Aanes Citation2012). Their main winter diet consists of graminoids, polar willow (Salix polaris) and mosses, complemented by other common plant groups (Bjørkvoll et al. Citation2009). Unlike for most other subspecies of R. tarandus, mosses can be an important dietary component in winter in spite of their low digestibility (Staaland et al. Citation1983; Bjørkvoll et al. Citation2009). It is assumed that this high intake of mosses in Svalbard is due to a low availability of lichens – the preferred food source of reindeer and caribou in winter elsewhere (Skogland Citation1984; Van der Wal et al. Citation2000). Important winter habitats for Svalbard reindeer are exposed areas, in this study defined as ridge and sub-ridge habitats, where little snow accumulates. Ridge habitats are characterized by only scattered vegetation cover, with dominating species being S. polaris and white dryad (Dryas octopetala). Sub-ridge habitats have slightly more snow accumulation and are dominated by the sedge Luzula confusa as well as the grasses Poa alpigena and P. alpina.
The Svalbard reindeer is subject to only negligible predation; a handful of killings by polar bears (Ursus maritimus) have been reported (Derocher et al. Citation2000). Insect harassment is minimal (Reimers Citation1980), as is interspecific competition: the Svalbard rock ptarmigan (Lagopus muta hyperborea) is the only other over-wintering herbivore. Survival and reproduction rates are highly variable between years (Solberg et al. Citation2001; Stien et al. Citation2012) because of density-dependence and variation in climatic conditions during winter (Reimers Citation1983; Aanes et al. Citation2000; Solberg et al. Citation2001; Kohler & Aanes Citation2004; Hansen et al. Citation2011; Hansen et al. Citation2013), but also during summer (Aanes et al. Citation2002; Hansen et al. Citation2013).
Data collection
Daily air temperature and precipitation at the Svalbard airport (24 m asl) from October 1975 until June 2013 were obtained from the Norwegian Meteorological Institute (www.eklima.met.no). Precipitation that fell at air temperatures above 1°C was considered rain (see, e.g., Stien et al. Citation2012). Winter was defined as October in year t − 1 to April in year t.
To estimate the overall temporal changes in feeding conditions during the course of the winter 2012/13, we measured snow and ice thicknesses at 24 fixed control sites distributed at 12 locations (). The locations followed a spatial hierarchical design, covering two areas with potentially different climatic conditions (coastal versus inland) at different elevations (low, <100 m asl; intermediate, 100–200 m asl; high, >200 m asl). At each location, two snow profiles at about 5–10 m distance apart, one each in ridge and sub-ridge habitat, were excavated. For each profile, snow depth (measured to the nearest 0.5 cm) and ground ice thickness (measured to the nearest 0.5 cm) as well as number of ice layers within the snowpack and their summed thickness (hereafter referred to as ‘ice thickness’) were recorded. From December on, a ramsonde penetrometer was also used to measure the hardness of the snowpack (Skogland Citation1978; Hansen et al. Citation2010). The ramsonde has a conical tip and penetrates the snow cover in response to a load (1 kg), which is dropped from a defined height (55 cm). Each time the load is dropped, the depth of the penetration into the snow is noted, until the ramsonde reaches ground (or ground ice, which is usually impenetrable). The resistance to penetration of the snow cover (‘ram hardness’) (kg) is given as:
where p = weight of load (kg), n = number of load drops, h = height of drop (cm), d = snow depth (cm) and Q = total weight of the ramsonde (kg) (Skogland Citation1978). The total force needed to penetrate the entire snowpack (IRH; kg cm) can then be calculated as:
(e.g., Nellemann Citation1998; Hansen et al. Citation2010). In this study we were mainly interested in the total force needed to reach the ground (i.e., the vegetation) and, hence, we only consider IRH.
Fixed control site locations were relocated using global positioning system waypoints, and stakes were used for marking the locations to avoid trampling that might affect later measurements. The exact location of the measurement was altered with 0.5 m (towards north, north-east, east, etc.) between each measurement. In total, seven measurements (hereafter referred to as ‘rounds’) that covered all 24 fixed control sites were performed over the winter, one of which was done after the beginning of snow melt in spring. Each round was completed within one, maximum two days. Because the ramsonde was not available from the beginning of the study, the first two rounds of measurements did not include IRH values.
We also performed snow and ice measurements in reindeer feeding craters located by spotting feeding reindeer from a car along a road transect in Adventdalen. This choice of transect was mainly based on the logistical challenges related to the dark polar night season. Craters occurred either along tracks of individual reindeer or in clusters where several craters from one or more individuals aggregated within a patch (see Hansen et al. Citation2010). Both versions will hereafter be commonly referred to as a ‘crater group’. Measurements were made wherever animals or fresh craters were encountered along the car transect. Visibility for this purpose was particularly limited during the polar night: from the beginning of November to the end of January (Supplementary Fig. S1c). As the animals are not marked, some degree of pseudo-replication (i.e., lack of independence between data points) may have occurred. However, the sedentary behaviour largely ensures that different individuals were sampled within a day or pooled days (for comparison with each fixed control measurement round, see above). In most cases, up to five craters were measured per crater group. For snow profile measurements, the least disturbed crater edges with the clearest profile were used; ramsonde measurements were made in undisturbed snow as close to that edge as possible while avoiding an ‘edge effect’. Following Hansen et al. (Citation2010), at each analysed feeding crater one paired nearby control location was measured at 1 m distance from the crater in a random direction. These controls were used to investigate crater selection at a small scale, i.e., the feeding station level. Overall, 114 craters and an equal number of controls were measured in 24 crater groups, 16 (four crater groups) of which were measured after the beginning of spring (here defined as 1 May). All crater sites were below 100 m asl (parts of the population also utilize higher altitudes, but these are difficult to access and were not included). As it was too dark during parts of the winter season to identify the gender, age and number of reindeer present, these variables are not considered in the analyses. Ramsonde measurements in feeding craters and nearby controls were not performed before January 2013.
In each crater group, we sampled one to five fresh faeces (mean = 2.9, SD = 1.7; each sample including a minimum of five pellets) for estimation of diet quality. The C:N ratio is a proxy of diet quality, with high C:N ratio in faeces generally reflecting a low nitrogen content and diet quality (Leslie & Starkey Citation1985) as a low content of proteins (important for animal nutrition; Parker et al. Citation2009) results in low nitrogen in the faeces. Lichens are low in nitrogen, yet a preferred winter food source in many reindeer and caribou populations because of their high energy content (Danell et al. Citation1994). However, as lichen are virtually absent in Svalbard, we assume that C:N ratio represents an adequate measure of variation in diet quality. In several cases the defecation itself was not observed, yet we feel confident that the faecal samples were from the animals that had made the respective craters. Faeces samples were also collected in spring, during the snowmelt, to quantify whether the C:N ratio changes as snow-free habitat is exposed and plants start producing fresh biomass. Spring samples were only from individuals observed to defecate. In total, 66 faecal samples were collected, all of which could be linked temporally to one of the seven sampling rounds (see above). Samples were stored in the freezer. Before analysis, they were dried at 60°C overnight. From each sample, 3–5 mg of faecal material were packed into tin capsules. The carbon and nitrogen contents were analysed by thermal decomposition using an EA 1110 CHNS-O Elemental Analyser (CE Instruments).
Data analyses
To analyse how snow and ice conditions changed during the course of the winter, we used linear mixed effects models to regress measures from the fixed control sites against a number of explanatory environmental factors (LMM with a Gaussian family and identity link; lmer function in package lme4, R Core Team Citation2013). A separate LMM was run for snow depth, ice thickness and IRH including the following fixed effects: area (coast or inland), elevation (high, medium, low), habitat (ridge or sub-ridge) and ‘round’ (as factor). Location was included as random intercept effect. For IRH, one extreme outlier of 4455 kg cm in round 4 caused serious residual problems and was removed. For extraction of parameter estimates representing the condition changes between rounds, low elevation and inland area were defined as intercept as they best resembled the areas where reindeer crater and faecal data were sampled.
To assess fine-scale feeding crater selection, we analysed feeding crater conditions relative to nearby controls (1 m distance). We regressed snow depth in feeding craters (the sample unit) against snow depth in the paired nearby control (fixed effect) using an LMM with Gaussian family and identity link, and crater group ID as random intercept. Similar analyses were run separately for ice thickness in the snowpack and IRH. Ground ice was largely absent in craters and occurred only rarely in nearby controls, and then generally as a thin and discontinuous layer. For simplicity, we therefore disregarded ground ice in these analyses of fine-scale selection.
We also examined how temporal changes in feeding crater characteristics corresponded with overall changes in the conditions measured in the fixed control sites, represented by the ‘round’-specific parameter estimates of snow depth and ice thickness (see analysis above). Similar LMMs as for the fine-scale selection above were run, i.e., snow depth or ice thickness in feeding craters (sampling unit) as a function of the respective round’s parameter estimate of snow depth or ice thickness, respectively, and with crater group ID as random intercept effect. IRH was not analysed here as data were missing from the fixed sites in the first rounds.
Finally, we tested how faecal C:N ratio changed with temporal changes in the conditions measured in fixed control sites during the course of the winter. This was to investigate whether this diet quality proxy would drop in response to worsening snowpack conditions, which reduced the accessibility of forage, assuming that the animals would trade forage quality for lower energetic costs of digging. (To avoid confounding of spatial and temporal effects, faecal C:N ratios were not related to the snow and ice conditions in craters.) The median C:N value from faeces belonging to the same crater group was used for further analysis to avoid pseudo-replication. A linear regression was applied with C:N ratio as a function of the respective round’s parameter estimates of snow depth and ice thickness, and their interaction. The best model was determined using AICc corrected for small sample sizes, where the candidate model with the lowest AICc value is regarded the best fitting model, but all models with a ΔAICc of <2 were considered (Burnham & Anderson Citation2002).
Data from spring (after 1 May; n for faeces = 16, n for craters/controls = 16 from four crater groups) were only used qualitatively to evaluate C:N ratios as a proxy of diet quality. Because of difficulties in separating the effect of easier accessibility of vegetation due to snowmelt versus the appearance of fresh vegetation growth, these data were excluded from statistical analyses. Analyses were run with R version 3.0.2 (downloaded on 25 September 2013; R Core Team Citation2013). P values were generated with the lmerTest package in R.
Results
Fifteen days with temperatures above 1°C were recorded in the study winter (), with rain >0.1 mm occurring on four days. The summed precipitation (116 mm) was close to the 1976–2012 median (106 mm); however, the amount falling as rain (9 mm) was below the median of 13 mm. The greatest changes in snow and ice conditions occurred between mid–late December and mid-January as a result of heavy snowfall in December, followed by some small rain events and periods of relatively mild temperatures in early January ().
Figure 2. Seasonal changes in environmental conditions in fixed control sites as well as in reindeer feeding craters and in the C:N ratio of reindeer faeces. (a) Daily weather, measured at Svalbard Airport, from October 2012 to June 2013: mean temperature, precipitation as snow (light grey bars) and as rain (dark bars). Data source: Norwegian Meteorological Institute. Dotted horizontal line marks the 1°C threshold for precipitation being classified as rain. (b–e) Changes in snow depth, ground ice, ice thickness (not including ground ice) and IRH at fixed control sites (dark boxplots) and in reindeer feeding craters (light grey boxplots; grouped to weeks). (f) Changes in C:N ratio from fresh faeces sampled around the craters. Dashed vertical lines indicate the beginning of the spring season (here defined as 1 May).
Snow depth, number of ice layers, ice thickness and IRH were positively correlated both across feeding craters and in fixed controls, while ground ice was weakly negatively correlated with number of ice layers and ice thickness in craters and with snow depth in fixed controls (). In the models estimating temporal changes in conditions, we found that snow tended to be deeper in sub-ridge than ridge habitat and ice thickness declined with increasing elevation, while there was no apparent area (coast versus inland) effect ().
Table 1. Spearman-correlation table for: (a) snow and ice parameters (IRH) measured in reindeer feeding craters (n = 98; n = 37 for IRH), above the diagonal; and (b) for snow and ice parameters measured in fixed control sites (n = 144; n = 96 for IRH), below the diagonal. Statistically significant correlations are marked by * (p < 0.05) or ** (p < 0.001).
Table 2. Results for model of temporal changes in overall conditions based on measurements in fixed control sites. Separate linear mixed models were run for snow depth, ice thickness and IRH including area (coast or inland), elevation (high, medium, low), habitat (ridge or sub-ridge) and ‘round’ (as factor) as fixed effects and location as random intercept effect. Values show parameter estimates ± SE (except for variance values for random effects, which are shown with SD). The intercept was defined as ‘area = inland’, ‘elevation = low’, ‘habitat = ridge’ and ‘measurement round = 1’ (round = 3 for IRH, as ramsonde measurements were not performed until round 3). Note that model for ice thickness is on the log-scale (with addition of 1).
Little ground ice was recorded in feeding craters (present in five out of 98), nearby controls (22 out of 98) and fixed control sites (11 out of 144). Most ground ice found was thin (<1 cm). Therefore, ground ice was not included in models assessing cratering selection and changes in diet quality. The snow depths and ice thicknesses (in snowpack) in feeding craters were positively related to changes in the fixed controls’ conditions (i.e., round-specific model estimates of the respective parameter; ; ). However, while reindeer selected feeding craters with on average less snow than the fixed control sites, craters had on average thicker ice than the controls. Crater group ID as random effect explained 30% of the added variance in snow depth and 41% in ice thickness, indicating that much of the variation in crater values was due to variation between local feeding spots or groups of animals.
Table 3. Results for models investigating reindeer cratering selection at the landscape level, by comparing feeding crater values to overall conditions, represented by fixed control sites model estimates (from ). Linear mixed models were used to test selection for/against snow depth or ice thickness. Crater group ID was included as random effect. Values show parameter estimates ± SE (except for variance values for random effects, which are shown with SD).
Figure 3. Feeding crater selection by Svalbard reindeer at two spatial scales. (a, b) Selection at the landscape level: comparison of round-specific snow depth and ice thickness in reindeer feeding craters with conditions in fixed control sites, represented by model estimates. Feeding crater data (means with SD) and fixed control sites model estimates (with SEs) were grouped to measurement rounds (excluding spring measurements). (c–e) Selection at the feeding station level: comparison of snow depth, ice thickness and IRH in reindeer feeding craters with paired nearby control spots. Note that the positive relationship in (d) was not present when cases with zero ice were removed. In (d) values were jittered to allow better visual interpretation. Dashed black lines indicate a slope = 1. Black solid lines display model regression lines (, ). In (c–e), smoothed regression lines are included (red = lowess, blue = loess).
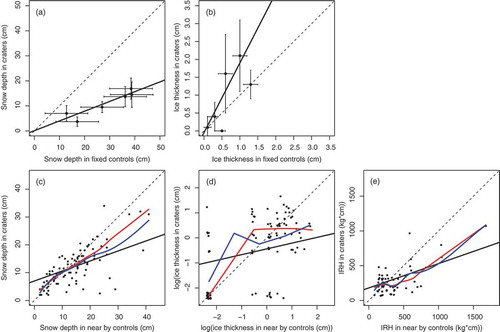
Compared with nearby (1 m) controls, feeding craters had less snow (paired t-test: t = 4.1, p < 0.001, df = 97) and lower IRH (t = 2.4, p < 0.05), but not less ice (t = 0.96, p = 0.34). This indicates that on average, the animals selected against deep snow and high IRH at the fine spatial scale. Snow depth in feeding craters increased with snow depth in the nearby controls (, ) but rarely exceeded 25–30 cm. The modelled regression slope of snow in craters versus nearby controls was significantly less than one and suggested that reindeer selected for deeper snow than the immediate surroundings up to some low level (ca. 10 cm snow depth in controls), where selection apparently shifted sign. Smoothed regressions (loess and lowess curves) largely confirmed this pattern (). Ice thickness in feeding craters only occasionally exceeded 3 cm () and increased with increasing ice thickness in nearby controls (, ). However, this relationship was driven by the prevailing cases with no ice: when excluding these cases the modelled slope was significantly different from one and even tended to be negative. For IRH, a similar pattern of fine-scale selection was found as for snow depth, with a positive effect of IRH in the nearby control on IRH in the feeding crater and a shift in the crater selection from selecting ‘worse’ to selecting ‘better’ when the IRH in nearby controls reached a threshold of about 250 kg cm (). Crater group ID as random effect explained 46% of the added variance in snow depth, 68% in ice thickness and 32% in IRH. In the five cases (out of 98) where ground ice was found in cratered sites, it did not form a continuous layer, but rather consisted of a mosaic of ice patches. In all of these cases, vegetation protruded from the ice. In comparison, ground ice was recorded 22 times in the nearby controls (mostly 0.5 cm, maximum 5 cm), indicating avoidance of ground-ice at fine spatial scales (χ2 = 12.4, df = 1, p < 0.001).
Table 4. Results for models investigating reindeer cratering selection at the feeding station level, by relating feeding crater values to nearby (1 m) control locations. Linear mixed models were used to test selection for/against snow depth, ice thickness or IRH. Crater group ID was included as random effect. Values show parameter estimates ± SE (except for variance values for random effects, which are shown with SD). Note that models for ice thickness are on the log-scale (with addition of 0.1 in model including zero values).
Faecal C:N ratios, which were strongly negatively correlated with nitrogen content (Pearson’s r = −0.94, p < 0.001; ), increased over the course of the winter, indicating that diet quality decreased as the winter progressed and food accessibility worsened (). C:N ratios dropped rapidly when ridges became snow-free and vegetation (including fresh growth) became more available in spring. AICc model selection (Supplementary Table S1) suggested only one candidate model to be considered: Excluding the spring data, the increase in faecal C:N ratios during winter was best explained by snow depth (round-specific estimates from fixed control sites) (α = 20.3 ± 2.2 SE with p < 0.001, β = 0.29 ± 0.07 SE with p < 0.001, R2 = 0.50, df = 15; ).
Figure 4. Faecal C:N ratio in relation to (a) nitrogen content and (b) estimates of temporal changes in snow depth, as measured in fixed control sites throughout the winter season (see ). In (b), spring data are excluded. Black lines represent model regression line; dashed lines in (b) indicate confidence interval for model regression line.
Discussion
In this study we have demonstrated how cratering choices and a faecal-based diet quality proxy in a High-Arctic large herbivore change with worsening snowpack conditions during the course of a winter. While wild Svalbard reindeer generally cratered in sites with shallower and less hard snow (but not less ice) than in nearby controls, this fine-scale selection changed sign when conditions were comparatively good (). Furthermore, as predicted from optimal foraging theory, faecal C:N ratios (our inverse diet quality proxy) increased with a decrease in forage accessibility (). Despite being based on data from only one winter with a limited sample size, our study provides novel insights into Arctic ungulates’ adaptive capacities to respond to climate change and changes in snowpack conditions.
At the fine spatial scale, i.e., when comparing craters with nearby controls, we found support for selective behaviour against deep and hard snow, but only above a certain low level. Under good conditions – the comparatively shallow or soft snowpack that occurs in early winter – selecting microhabitat with deeper or harder snow than the immediate surroundings might be a strategy to optimize diet quality or intake rates. Food plants are increasingly abundant further down on windblown ridges, justifying the slightly higher energetic costs of digging. Once conditions worsened with deeper and harder snow, selection shifted sign: there was a selection against deep or hard snowpack, probably at the cost of poorer food abundance or quality.
In spite of little icing during the study winter, reindeer avoided cratering in the few sites where vegetation was completely covered by ground ice (see also Hansen et al. Citation2010). This supports the hypothesis that olfactory senses are important when locating food under the snowpack (e.g., Bergerud & Nolan Citation1970; Bergerud Citation1974). Snow depth in craters rarely exceeded 30 cm (). This corresponds well with previous values reported for Svalbard reindeer (Hansen et al. Citation2010) as well as caribou in Alaska (e.g., Collins & Smith Citation1991) and on Coats Island, Canada (Adamczewski et al. Citation1988). Although Pruitt (Citation1959) and LaPerriere & Lent (Citation1977) suggested that caribou crater in snow with thickness up to around 50–60 cm, and Johnson et al. (Citation2000) found craters up to 1 m deep, Bergerud & Nolan (Citation1970) proposed a limit of 18 cm of snow for smelling forage lichens. Most craters in our study were well within these limits. However, lichens are hardly present in the study area and are not a significant food source for the reindeer (Bjørkvoll et al. Citation2009), and thresholds for smelling plants are not known.
IRH can be considered a representative proxy for forage accessibility, as it integrates the hardness and thickness of the entire snowpack (Skogland Citation1978), including ice layers. IRH in feeding craters rarely exceeded 500 kg cm (median: 263 kg cm), which resembles previously reported values from more icy feeding conditions in Svalbard (Hansen et al. Citation2010). In a study of Arctic tundra caribou (R. tarandus) on southern Baffin Island, Canada, Ferguson et al. (Citation2001) found mean IRH in feeding craters to vary spatially between 160 and 601 kg cm. Similar values were reported by LaPerriere & Lent (Citation1977) for caribou in north-eastern Alaska, while reindeer in mainland Norway were feeding on ridges with on average 357–2297 kg cm IRH (Nellemann Citation1996). This comparison with other Rangifer populations may indicate that, because of the extremely sparse-growing vegetation in the High Arctic, the energy expenditure threshold for cratering is low compared with lower latitude areas. In the latter, cratering in deeper and harder snow might still be beneficial as food plants are likely more abundant once the vegetation is accessed beneath the snowpack.
Faecal C:N ratio is only one of several potential proxies of diet quality in large herbivores (Leslie & Starkey Citation1985), and cautious interpretation is needed. However, C:N ratios were almost perfectly negatively correlated with nitrogen content, which is known as a crucial determinant of body condition and reproduction in reindeer and caribou (see e.g., Adamczewski et al. Citation1987; Parker et al. Citation1990; Parker et al. Citation2009). As the snowpack became deeper during the course of the winter, faecal C:N ratios increased. This indicates that even though the reindeer crater in increasingly deeper snow as conditions worsen, the growing energy expenditure (Fancy & White Citation1987) and the trade-off between forage quality, quantity and accessibility (Westoby Citation1974; Stephens & Krebs Citation1986) will at some point cause a reduction in diet quality (or food intake rates), as feeding patches with lower-quality or less abundant food plants are selected. In contrast to snow depth, however, we found no effect of ice thickness on faecal C:N ratios, and on average there was no fine-scale selection against ice thickness. This study therefore indicates that during ‘normal’ precipitation winters with (in a Svalbard context) little ROS and icing – the conditions more typically faced by lower-latitude Rangifer populations (LaPerriere & Lent Citation1977; Nellemann Citation1996; Ferguson et al. Citation2001) – Svalbard reindeer feeding choices and diet quality are constrained by total snowpack depth rather than the few and overall thin ice layers present in the snowpack. The record high number of animals counted in Adventdalen during the annual monitoring in the following summer (Ims et al. Citation2014) suggests that mortality during the study winter was low and that the winter feeding conditions supported a high subsequent reproduction rate, as expected in the absence of ground ice (e.g., Stien et al. Citation2012; Hansen et al. Citation2014). In the context of winter climate change and the expected increase in ROS and icing (Hansen et al. Citation2014), we therefore encourage future multi-year studies comparing the behavioural and dietary responses to snow and ice under different conditions.
Around the onset of spring, faecal C:N ratios dropped rapidly with forage accessibility becoming less restricted because of melting of snow, and vegetation becoming easily available. This spring effect potentially also included access to emerging green vegetation (see also Råstad Citation2010), although this effect could not be controlled for in this study. Nevertheless, either due to vegetation becoming more accessible or fresh vegetation emerging, the spring drop in faecal C:N ratios represents indirect support for our use of C:N ratios as an inverse proxy of diet quality in this study. Trends of earlier onsets of spring have been documented for Arctic regions (e.g., Moritz et al. Citation2002; Høye et al. Citation2007; Post & Forchhammer Citation2008) and are predicted to continue (AMAP Citation2011). The rapid spring effect on faecal C:N ratios (a proxy for diet quality) found here adds to the impression that advancement of spring is overall beneficial for reindeer (Tveraa et al. Citation2013; but see Post & Forchhammer Citation2008), possibly counteracting negative effects of deeper snowpack or increased frequencies of icing events on the reindeer’s body condition.
In conclusion, this study has demonstrated patterns of variation in cratering choices and a diet quality proxy of Svalbard reindeer which are in line with expectations from optimal foraging theory, predicting dynamic foraging trade-offs for northern large herbivores (e.g., Skogland Citation1984; Andersen & Sæther Citation1992). Hence, diet quality decreases with only slight reductions in forage accessibility, and the selection curve for snow and ice indicates a low-level switch from selecting worse to selecting better conditions than the immediate surroundings. The cratering threshold (in terms of IRH) in this High-Arctic subspecies appears to be comparatively low, most likely because of the sparse vegetation and associated high cost–benefit ratio of cratering at such high latitudes. Given the expected changes in winter climate, with more precipitation and heavy icing events in particular (Rennert et al. Citation2009; Hansen et al. Citation2011; Stocker et al. Citation2013), our results may indicate future changes in the realized winter foraging niche and diet quality.
Supplementary material
Download PDF (395.8 KB)Acknowledgements
This study was funded by the authors’ institutions and the Research Council of Norway through the Polar Research Programme (216051) and SFF-III program (223257, Centre for Biodiversity Dynamics, Norwegian University of Science and Technology). We would like to thank Eike Müller for his help in the field and the laboratory, Martin Mantel for creating the map and everybody else who helped out with the fieldwork. We would also like to thank two anonymous reviewers for their helpful and constructive comments on previous versions of this article. We are furthermore grateful to the Norwegian Polar Institute for providing the map material and the Norwegian Meteorological Institute for providing the weather data.
Disclosure statement
No potential conflict of interest was reported by the authors.
Supplemental data
Supplemental data for this article can be accessed here.
Additional information
Funding
References
- Aanes R., Sæther B.-E. & Øritsland N.A. 2000. Fluctuations of an introduced population of Svalbard reindeer: the effects of density dependence and climatic variation. Ecography 23, 1–12.
- Aanes R., Sæther B.-E., Smith F.M., Cooper E.J., Wookey P.A. & Øristland N.A. 2002. The Arctic Oscillation predicts effects of climate change in two trophic levels in a High-Arctic ecosystem. Ecology Letters 5, 445–453.
- Adamczewski J.Z., Gates C.C., Hudson R.J. & Price M.A. 1987. Seasonal changes in body composition of mature female caribou and calves (Rangifer tarandus groenlandicus) on an Arctic island with limited winter resources? Canadian Journal of Zoology 65, 1149–1157.
- Adamczewski J.Z., Gates C.C., Soutar B.M. & Hudson R.J. 1988. Limiting effects of snow on seasonal habitat use and diets of caribou (Rangifer tarandus groenlandicus) on Coats Island, Northwest Territories, Canada. Canadian Journal of Zoology 66, 1986–1996.
- Albon S.D., Irvine R.J., Halvorsen O., Langvatn R., Loe L.E., Ropstad E., Veiberg V., van der Wal R., Bjørkvoll E.M., Duff E.I., Hansen B.B., Lee A.M., Tveraa T. & Stien A. 2016. Contrasting effects of summer and winter warming on body mass explain population dynamics in a food-limited Arctic herbivore. Global Change Biology, doi: 10.1111/gcb.13435
- AMAP (Arctic Monitoring and Assessment Programme) 2011. Snow, water, ice and permafrost in the Arctic (SWIPA): climate change and the cryosphere. Oslo: Arctic Monitoring and Assessment Programme.
- Andersen R. & Sæther B.-E. 1992. Functional-response during winter of a herbivore, the moose, in relation to age and size. Ecology 73, 542–550.
- Bergerud A.T. 1974. Relative abundance of food in winter for Newfoundland caribou. Oikos 25, 379–387.
- Bergerud A.T. & Nolan M.J. 1970. Food habits of hand-reared caribou Rangifer tarandus L. in Newfoundland. Oikos 21, 348–350.
- Bjørkvoll E., Pedersen B., Hytteborn H., Jónsdóttir I.S. & Langvatn R. 2009. Seasonal and interannual dietary variation during winter in female Svalbard reindeer (Rangifer tarandus platyrhynchus). Arctic, Antarctic and Alpine Research 41, 88–96.
- Bjune A.E. 2000. Pollen analysis of faeces as a method of demonstrating seasonal variations in the diet of Svalbard reindeer (Rangifer tarandus platyrhynchus). Polar Research 19, 183–192.
- Burnham K.P. & Anderson D.R. 2002. Model selection and multi-model inference: a practical information-theoretic approach. 2nd edn. New York: Springer.
- Collins W.B. & Smith T.S. 1991. Effects of wind-hardened snow on foraging by reindeer (Rangifer tarandus). Arctic 44, 217–222.
- Danell K., Utsi P.M., Palo R.T. & Eriksson O. 1994. Food plant selection by reindeer during winter in relation to plant quality. Ecography 17, 153–158.
- Derocher A.E., Wiig O. & Bangjord G. 2000. Predation of Svalbard reindeer by polar bears. Polar Biology 23, 675–678.
- Fancy S.G. & White R.G. 1987. Energy expenditures for locomotion by barren-ground caribou. Canadian Journal of Zoology 65, 122–128.
- Ferguson M.A.D., Gauthier L. & Messier F. 2001. Range shift and winter foraging ecology of a population of Arctic tundra caribou. Canadian Journal of Zoology 79, 746–758.
- Grenfell T.C. & Putkonen J. 2008. A method for the detection of the severe rain-on-snow event on Banks Island, October 2003, using passive microwave remote sensing. Water Resources Research 44, W03425, doi: 10.1029/2007WR005929.
- Hansen B.B. & Aanes R. 2012. Kelp and seaweed feeding by High-Arctic wild reindeer under extreme winter conditions. Polar Research 31, article no. 17258, doi: 10.3402/polar.v31i0.17258.
- Hansen B.B., Aanes R., Herfindal I., Kohler J. & Sæther B.-E. 2011. Climate, icing, and wild Arctic reindeer: past relationships and future prospects. Ecology 92, 1917–1923.
- Hansen B.B., Aanes R. & Sæther B.-E. 2010. Feeding-crater selection by High-Arctic reindeer facing ice-blocked pastures. Canadian Journal of Zoology 88, 170–177.
- Hansen B.B., Grøtan V., Aanes R., Sæther B.-E., Stien A., Fuglei E., Ims R.A., Yoccoz N.G. & Pedersen Å.Ø. 2013. Climate events synchronize the dynamics of a resident vertebrate community in the High Arctic. Science 339, 313–315.
- Hansen B.B., Isaksen K., Benestad R.E., Kohler J., Pedersen Å.Ø., Loe L.E., Coulson S.J., Larsen J.O. & Varpe Ø. 2014. Warmer and wetter winters: characteristics and implications of an extreme weather event in the High Arctic. Environmental Research Letters 9, article no. 114021, doi: 10.1088/1748-9326/9/11/114021.
- Høye T.T., Post E., Meltofte H., Schmidt N.M. & Forchhammer M.C. 2007. Rapid advancement of spring in the High Arctic. Current Biology 17, R449–R451.
- Ims R.A., Alsos I.G., Fuglei E., Pedersen Å.Ø. & Yoccoz N.G. 2014. An assessment of MOSJ — the state of the terrestrial environment in Svalbard. Report Series 144. Tromsø: Norwegian Polar Institute.
- Johnson C.J., Parker K.L. & Heard D.C. 2000. Feeding site selection by woodland caribou in north–central British Columbia. Rangifer Special Issue 12, 159–172.
- Johnson C.J., Parker K.L. & Heard D.C. 2001. Foraging across a variable landscape: behavioural decisions made by woodland caribou at multiple spatial scales. Oecologia 127, 590–602.
- Jónsdóttir I.S. 2005. Terrestrial ecosystems on Svalbard: heterogeneity, complexity and fragility from an Arctic island perspective. Biology and Environment: Proceedings of the Royal Irish Academy 105B, 155–165.
- Koenigk T., Berg P. & Döscher R. 2015. Arctic climate change in an ensemble of regional CORDEX simulations. Polar Research 34, article no. 24603, doi: 10.3402/polar.v34.24603.
- Kohler J. & Aanes R. 2004. Effect of winter snow and ground-icing on a Svalbard reindeer population: results of a simple snowpack model. Arctic, Antarctic, and Alpine Research 36, 333–341.
- Kumpula J. & Colpaert A. 2003. Effects of weather and snow conditions on reproduction and survival of semi-domesticated reindeer (Rangifer t. tarandus). Polar Research 22, 225–233.
- LaPerriere A.J. & Lent P.C. 1977. Caribou feeding sites in relation to snow characteristics in northeastern Alaska. Arctic 30, 101–108.
- Leslie Jr D.M. & Starkey E.E. 1985. Fecal indices to dietary quality of cervids in old-growth forests. The Journal of Wildlife Management 49, 142–146.
- Loe L.E., Hansen B.B., Stien A., Albon S.D., Bischof R., Carlsson A., Irvine R.J., Meland M., Rivrud I.M., Ropstad E., Veiberg V. & Mysterud A. 2016. Behavioral buffering of extreme weather events in a High-Arctic herbivore. Ecosphere 7, article e01374, doi: 10.1002/ecs2.1374.
- Lundmark C. & Ball J.P. 2008. Living in snowy environments: quantifying the influence of snow on moose behaviour. Arctic, Antarctic and Alpine Research 40, 111–118.
- MacArthur R.H. & Pianka E.R. 1966. On optimal use of a patchy environment. The American Naturalist 100, 603–609.
- Miller F.L. & Barry S.J. 2009. Long-term control of Peary caribou numbers by unpredictable, exceptionally severe snow or ice conditions in a non-equilibrium grazing system. Arctic 62, 175–189.
- Moritz R.E., Bitz C.M. & Steig E.J. 2002. Dynamics of recent climate change in the Arctic. Science 297, 1497–1502.
- Nellemann C. 1996. Terrain selection by reindeer in late winter in central Norway. Arctic 49, 339–347.
- Nellemann C. 1998. Habitat use by muskoxen (Ovibos moschatus) in winter in an alpine environment. Canadian Journal of Zoology 76, 110–116.
- Parker G.A., Thomas D.C., Madore P.L. & Gray D.R. 1975. Crashes of muskox and Peary caribou populations in 1973-74 in the Perry islands, Arctic Canada. Canadian Wildlife Series Progress Notes 56, 1–10.
- Parker K.L. 2003. Advances in the nutritional ecology of cervids at different scales. Ecoscience 10, 395–411.
- Parker K.L., Barboza P.S. & Gillingham M.P. 2009. Nutrition integrates environmental responses of ungulates. Functional Ecology 23, 57–69.
- Parker K.L., White R.G., Gillingham M.P. & Holleman D.F. 1990. Comparison of energy metabolism in relation to daily activity and milk consumption by caribou and muskox neonates? Canadian Journal of Zoology 68, 106–114.
- Piechura J., Beszczyńska-Möller A. & Osiński R. 2001. Volume, heat and salt transport by the West Spitsbergen Current. Polar Research 20, 233–240.
- Post E. & Forchhammer M.C. 2008. Climate change reduces reproductive success of an Arctic herbivore through trophic mismatch. Philosophical Transactions of the Royal Society B: Biological Sciences 363, 2367–2373.
- Pruitt Jr W.O. 1959. Snow as factor in the winter ecology of barren ground caribou. Arctic 12, 159–179.
- R Core Team 2013. R: a language and environment for statistical computing. Vienna: R Foundation for Statistical Computing.
- Råstad E.B. 2010. Effects of spatiotemporal variation in food quality and quantity on ungulate resource selection. Master’s thesis, University of Tromsø.
- Reimers E. 1980. Activity pattern: the major determinant for growth and fattening in Rangifer? In E. Reimers et al. (eds.): Proceedings of the second international Reindeer/Caribou symposium, 17–21 September 1979, Røros, Norway. Pp. 466–474. Trondheim: Directorate for Wildlife and Freshwater Fish.
- Reimers E. 1983. Mortality in Svalbard reindeer. Holarctic Ecology 6, 141–149.
- Rennert K.J., Roe G., Putkonen J. & Bitz C.M. 2009. Soil thermal and ecological impacts of rain on snow events in the circumpolar Arctic. Journal of Climate 22, 2302–2315.
- Rønning O. 1996. The flora of Svalbard. Oslo: Norwegian Polar Institute.
- Sæther B.-E. 1997. Environmental stochasticity and population dynamics of large herbivores: a search for mechanisms. Trends in Ecology & Evolution 12, 143–149.
- Sæther B.-E. & Andersen R. 1990. Resource limitation in a generalist herbivore, the moose Alces alces: ecological constraints on behavioural decisions. Canadian Journal of Zoology 68, 993–999.
- Serreze M.C., Crawford A.D. & Barrett A.P. 2015. Extreme daily precipitation events at Spitsbergen, an Arctic Island. International Journal of Climatology 35, 4574–4588.
- Skogland T. 1978. Characteristics of the snow cover and its relationship to wild mountain reindeer (Rangifer tarandus tarandus L.) feeding strategies. Arctic and Alpine Research 10, 569–580.
- Skogland T. 1984. Wild reindeer foraging-niche organization. Holarctic Ecology 7, 345–379.
- Solberg E.J., Jordhøy P., Strand O., Aanes R., Loison A., Sæther B.-E. & Linnell J.D.C. 2001. Effects of density-dependence and climate on the dynamics of a Svalbard reindeer population. Ecography 24, 441–451.
- Staaland H., Brattbakk I., Ekern K. & Kildemo K. 1983. Chemical composition of reindeer forage plants in Svalbard and Norway. Holarctic Ecology 6, 109–122.
- Staaland H., Scheie J.O., Grøndahl F.A., Persen E., Leifseth A.B. & Holand Ø. 1993. The introduction of reindeer to Brøggerhalvøya, Svalbard: grazing preference and effect on vegetation. Rangifer 13, 15–19.
- Stephens D.W. & Krebs J.R. 1986. Foraging theory. Princeton: Princeton University Press.
- Stien A., Ims R.A., Albon S.D., Fuglei E., Irvine R.J., Ropstad E., Halvorsen O., Langvatn R., Loe L.E., Veiberg V. & Yoccoz N.G. 2012. Congruent responses to weather variability in High Arctic herbivores. Biology Letters 8, 1002–1005.
- Stocker T.F., Qin D., Plattner G.-K., Tignor M., Allen S.K., Boschung J., Nauels A., Xia Y., Bex V. & Midgley P.M. (eds.). 2013. Climate change 2013. The physical science basis. Contribution of Working Group I to the fifth assessment report of the Intergovernmental Panel on Climate Change. Cambridge: Cambridge University Press.
- Tveraa T., Stien A., Bårdsen B.-J. & Fauchald P. 2013. Population densities, vegetation green-up, and plant productivity: impacts on reproductive success and juvenile body mass in reindeer. PLoS One 8, e56450, doi: 10.1371/journal.pone.0056450.
- Tyler N.J.C. 1986. The relationship between the fat content of Svalbard reindeer in autumn and their death from starvation in winter. Rangifer Special Issue 1, 311–314.
- Tyler N.J.C. 1987. Body composition and energy balance of pregnant and non-pregnant Svalbard reindeer during winter. Symposium of the Zoological Society of London 57, 203–229.
- Tyler N.J.C. 2010. Climate, snow, ice, crashes, and declines in populations of reindeer and caribou (Rangifer tarandus L.). Ecological Monographs 80, 197–219.
- Tyler N.J.C. & Øritsland N.A. 1989. Why don’t Svalbard reindeer migrate? Holarctic Ecology 12, 369–376.
- Van der Wal R., Madan N., van Lieshout S., Dormann C., Langvatn R. & Albon S.D. 2000. Trading forage quality for quantity? Plant phenology and patch choice by Svalbard reindeer. Oecologia 123, 108–115.
- Vivås H.J. & Sæther B.-E. 1987. Interactions between a generalist herbivore, the moose Alces alces, and its food resources: an experimental study of winter foraging behaviour in relation to browse availability. The Journal of Animal Ecology 56, 509–520.
- Westoby M. 1974. An analysis of diet selection by large generalist herbivores. The American Naturalist 108, 290–304.