
ABSTRACT
Children with cerebral palsy (CP) are faced with long-term dysfunction. The International Classification of Functioning, Disability and Health for Children and Youth (ICF-CY) has been proposed but the complicated procedure limits the feasibility of clinical application and the exploration of health degrees. This study was aimed to establish a Mokken scale based on the ICF-CY for CP, and then to estimate psychometric properties through the derived Rasch model. 150 children with CP were assessed by the categories of “b” and “d” components in the core set. The binarized data was screened by the Mokken scale analysis and utilized for generating a reliable Rasch model. The validity of the final model was checked by the correlation between person ability, Gross Motor Function Classification System (GMFCS) and total scores. Using the Mokken scale to guide Rasch modeling, we can parameterize the properties of ICF-CY and realize the simple assessment of person abilities for children with CP.
Introduction
Cerebral palsy (CP) is usually caused by non-progressive damage to the fetus or infant brain during development, which is manifested as a developmental disorder of movement and posture, as well as limited activity caused by developmental impairment.Citation1–3 Although the brain injury of CP ought to be static, patients are faced with long-term disability and may even develop progressive dysfunction.Citation4 In addition to mobility disorders, patients also have complex problems at biological, psychological, and social levels, including impairment of higher brain functions such as cognition and language, and secondary impairment of musculoskeletal system functions, as well as multiple factors such as upbringing and schooling.Citation5,Citation6 As the growth, development, and living conditions of children with CP change, new health problems and activity limitations, such as fatigue, pain, or employment problems, may also occur.Citation7 There are dozens of evaluation methods and evident variations in etiology, comorbidities, and response to treatment.Citation8 Therefore, the need for rehabilitation treatment for children with cerebral palsy is clear, while how to recognize the integral function level and how to analyze the intervenable and favorable items are inevitable but still unresolved.Citation1 Currently, specialized scales are mostly developed for specific diseases, making it difficult to obtain comprehensive and standard-based assessments for patients with multiple comorbidities or spectrum diseases.
The activities of daily living (ADL) are widely evaluated, but the simple content of the Barthel Index and the time-consuming property of the 36-Item Short-Form health survey (SF-36) limit the feasibility in the clinical application.Citation9 The Gross Motor Function Classification System (GMFCS) is one of the most common means of motor function assessment in children with CP.Citation10,Citation11 However, abilities and disabilities are assessed from a single functional level in GMFCS, ignoring the integrity of the individual and the attributes of the environment. It is difficult to guide the rehabilitation objectives and procedures in this approach. On the other hand, children with CP have certain adaptability and compensatory ability during growth and development. Rehabilitation should focus not only on the disorders and disabilities but also on the abilities and activities to assess the overall health condition. As a result, a comprehensive scale for rapid assessment of the health level is urgently needed in the clinic.
The World Health Organization’s International Classification of Functioning, Health and Disability (ICF) and the Child and Adolescent edition (ICF-CY) use uniform terminology to describe the basic elements of health, which are divided into four components (body structure, body function, activity and participation, and environmental factors), equipped with appropriate combinations of terms for a variety of diseases. A hierarchical domain-category-item description system is formed by a qualitative framework and a defined value ranging from 0 (no impairment) to 4 (complete impairment). There are some difficulties and controversies about how to implement such assessments. Two points are particularly prominent: (1) It is hard to unify the recognized concept and grading standards of items, especially in the determination of the qualification value, which always raise various disputes; (2) The number of items is too large to be used clinically, which means it is necessary to simplify the set such as using the Delphi method to determine the alternative items of the combination.Citation12
It has been proposed that a core set of ICF items can describe the disease-related health status.Citation13,Citation14 The core set for children with CP was developed including a comprehensive core set (0 ~ 18 years old, 135 items), a general concise core set (0 ~ 18 years old, 25 items), and a concise core set for three age groups (0 ~ 6 years old, 31 items; 6 ~ 14 years old, 35 items; 14 ~ 18 years old, 37 items).Citation15 Using convenience sampling of interview data, ICF item information can be considered health-related functional variables, providing a basis for possible rehabilitation intervention targets.Citation16 However, the ICF scoring system essentially focuses on disability. The higher the disability level is, the higher the score is. Thus, how to assess the health status of children with CP rather than disease status become an urgent problem to be solved.
By using health-oriented scoring strategies such as 1 for function items and 0 for dysfunction items, models of item response theory (IRT) can measure levels of person abilities rather than degrees of patient disabilities.Citation17–23 There are two approaches of item response modeling. Mokken scale analysis (MSA) is the non-parametric method.Citation24–26 The parametric approach involves a family of models in which the Rasch model is prominent. The primary difference between MSA and Rasch modeling is that the Mokken scale uses the sum of raw scores to compare person abilities, while the Rasch model estimates person abilities and item difficulties in the same unit (logit). Therefore, the Rasch model enables the comparison of individual abilities with populational item difficulties, and thus it offers more information for finding possible rehabilitation goals, such as the items with difficulties close to the individual’s ability. Recent developments in IRT modeling prefer integration of MSA and Rasch modeling into one pipeline, rather than selecting one over the other.Citation17,Citation18 The reason is that MSA can act as a tool for shaping and testing the data, according to the four hypotheses for further Rasch modeling, including unidimensionality (the questionnaire only measures one latent trait/person ability), local independence (the items associate with each other only because of the latent trait), monotonicity (the scoring possibility of each item always raises with increasing levels of person ability), and invariant item ordering (IIO, the rank of item difficulties is fixed for persons with same abilities).
The MSA-Rasch pipeline removes the items that do not contribute to differentiating persons with different abilities. The pipeline with the health-oriented scoring strategies can generate a concise scale for measuring a person's ability and comparing the ability with item difficulties. The present study was designed based on this approach. The ICF 0–4 qualifiers were converted to a dichotomous scoring system that assigning score 1 to functioning and score 0 to dysfunction. The existing ICF core sets of CP were integrated and screened for extracting an new set with the IRT parameters. This report also discussed the perspective of utilizing this set and its Rasch model for selecting rehabilitation targets.
Method
Subjects
A convenience sample of 150 children with CP received three assessments: (1) Gross Motor Function Classification System (GMFCS); (2) manual ability classification system (MACS); (3) ICF-CY questionnaire following the existing ICF study enrollment criteria for CP according to Maximum Variation Sampling Strategy for convenient sampling requirements.Citation2,Citation27,Citation28 The inclusion criteria were as follows: (1) CP was diagnosed by a pediatric neurologist conforming to the diagnostic criteria of the Chinese guidelines for CP rehabilitation; (2) the age was under 16 years; (3) the informed consent of the guardian was obtained. Exclusion criteria were: (1) CP was accompanied by uncontrolled epilepsy, genetic metabolic diseases, trauma, or unhealed surgical wound; (2) there were any other factors affecting information collection. The study was approved by the ethics committee of Sir Run Run Hospital, Nanjing Medical University (IRB# 2018-SR-017).
Pre-process
ICF-CY core set for CP contains a total of 135 items, including 34 items from the body function (b), 7 items from the body structure (s), 58 items from the activity and participation (d), and 36 items from the environmental factors (e). Domains b and d were selected in this study, excluding s and e to lessen the bias as much as possible. A total of 92 items were selected in domains b and d. The final scores were determined by a three-person inspection team (including a CP rehabilitation therapist, a rehabilitation therapist with ICF assessment certificate and a senior rehabilitation physician) after reaching a consensus on the disputed items. Each item was rated by the 5-point qualifier system: 0 = no impairment; 1 = mild impairment; 2 = moderate impairment; 3 = severe impairment; 4 = complete impairment. For 8 (not specified) and 9 (not applicable) in the original scoring system, both were recorded as missing value (NA). Information for rating came from medical histories, clinical examinations and observations, and descriptions from caregivers and health professionals.
Mokken Scale Analysis
Mokken scale analysis (MSA) was divided into three steps: (1) data examination, (2) scale identification, and (3) scale properties estimation.Citation29 The tools were embedded in the “mokken” (3.0.6) package of R software.Citation29,Citation30
(1) Data examination
The item with a missing value ≥5% in the sample population would be removed.Citation21 The censored data in the remaining items were completed by k-nearest neighbor imputation with k = 5 by using the “VIM” package of R. The imputed data was then binarized using the following criteria: 0 (no impairment) as 1 (healthy), and 1 to 4 (mild, moderate, severe, or complete impairment) as 0 (disabled). That was, the original 5-point impairment-scoring system was converted to a dichotomous functioning-scoring system. A form of binary data was constructed to obtain the total score of the scale to reflect the health degree of the patients. The data frame conformed to a matrix with observations in rows and ICF items in columns. There were no categories completely healthy or disabled in the shaped data set. The numbers of Gutman errors were calculated, and the correlation between the scores of subjects and the numbers of Gutman errors were analyzed. Participants were identified as outliers if they exceeded the upper limit of the Gutman errors cutoff value by adjusted boxplot.Citation29,Citation31
(2) Scale identification
The Automatic Item Selection Procedure (AISP) embedded in the “mokken” package of R was applied based on the genetic algorithms.Citation32–34 The global scalability coefficient (denoted as H) of the items was calculated. The boundary-value of the H set by the screening process started from .30 and ended at .54, and each step was .03. H < .30 would be taken as a violation of the Mokken principle, or unscalable.Citation29 After checking the results of different thresholds, an optimal value was selected, and a set with most or all items in one scale was extracted for further hypothesis testing. The pairwise scalability coefficient between items i and j was calculated as well (denoted as Hij). Item pairs with Hij<0 were concerned especially, as the pair relationship violated the Mokken model.
The local dependency testing algorithm of the Mokken package was used to test the scale.Citation29,Citation35 The algorithm calculated the W index based on conditional association, indicating the degree to which an item was suspected to be local dependence. W was classified into W1, W2, and W3. The larger the value of W1 was, the more likely the two items i and j were to be a pair of positive-locally dependent items. The larger the value of W2 was, the more likely the item i was to be in a positive-locally dependent item pair. The larger the value of W3 was, the more likely the items i and j were to be negative-locally dependent pairs. The Tukey fence algorithm was used to define the extreme value: W>Q3 + 3*(Q3-M), in which M was the median and Q3 was the 3rd percentile. All W values beyond this limit are defined as extreme values, which determined whether items remained in the scale.
The monotonicity was tested by the “check.monotonicity” function from the “Mokken” package of R.Citation29 The parameter set the minimum sample size as 50 and the minimum size of a violation as .03.Citation24 Four indiceswould be reported for this test: (1) #ac: the number of possible violations; (2) #vi: the actual number of violations; (3) #zsig: number of statistically significant violations; (4) Crit: the critical value with weighted sum of other indices.Citation30 The larger the statistic was, the less monotonous the item was.
The invariant item ordering (IIO) assumed that the order of item difficulty was constant in any location of the trait continuum, which was also embedded in the “check.iio” algorithm of the “mokken” package.Citation24 The function was set as a manifest invariant item ordering (MIIO) by conducting a backward item selection procedure to make the final decision.
The items violating one of the three hypotheses were removed. The remained items entered the reliability testing step.
(3) Scale properties
Four reliability coefficients were calculated: Cronbach’s alpha, Guttman’s lambda-2, the Molenaar Sijtsma (MS) statistic, and the latent class reliability coefficient (LCRC), all ranging from 0 to 1.Citation36 A larger value indicated the stronger internal consistency. In comparison with the traditional Cronbach’s alpha and Guttman’s lambda-2, MS statistic and LCRC could afford an unbiased estimation of the reliability.Citation30 To be more precise, LCRC was more superior to MS statistic for multiple-scale analysis.
Rasch Modeling
The reason for Rasch modeling on the basis of the Mokken scale was that the Mokken scale could only rank the ability of the subjects but could not give the estimated values of the person ability level. The Rasch model provided an estimate of the individual’s level of competence. The Mokken scale provided a set of items for further Rasch modeling. The Rasch algorithms were embedded in the “ltm” (1.1–1) package of R, including 3 steps: (1) screening loop, (2) model checking, (3) parameter estimation.
(1) Screening loop
The point biserial correlation between each item and the total score was examined. The flagged items were summarized in X1. Then, an optimal model was selected from the constrained (discrimination = 1) and unconstrained (discrimination ≠ 1) Rasch models based on the likelihood ratio test. The model with the lower value of Akaike Information Criterion (AIC) was preferred. The item goodness-of-fit test was performed based on Chi-square statistics, and the items with p < .05 were recorded in the list of X2. If the aggregation of X1 and X2 was non-empty, the therein items would be removed and the next circle would start. Otherwise, the loop would stop. The last candidate set was fed into the next stage.
(2) Model checking
The goodness-of-fit test of the model was carried out by Pearson chi-square statistic with the “GoF.Rasch” algorithm of “ltm” package. The null hypothesis stated that the observed data had been generated under the Rasch model.Citation37 A p > .05 suggested that the parameters of the selected model were not significantly different from the simulated Rasch model. The unidimensionality was examined with 100 uni-dimensional models by the Monte Carlo simulation method.Citation38 A p > .05 indicated the candidate model was not significantly different from the simulated unidimensional models. If the candidate model passed both tests, it would become the final Rasch model for further parameter estimating.
(3) Parameter estimation
The position of the item, i.e., item difficulties, with standard error, and standardized score (z score) of the Rasch model were estimated. The chi-square test was performed to test the goodness of item fit, and the Bonferroni method was used to calibrate the p value. Items with an adjusted p > .05 fit good to the model. The Wright map was plotted to assess the compatibility between personal ability and item information.Citation19 The item characteristic curve (ICC) checked the shape and described the relationship between the latent trait of the subjects and the probability of scoring. The monotonicity and IIO could be represented as parallel increasing ICCs. The differential item functioning (DIF) of the model was analyzed using Lord’s Chi-square analysis embedded in the “difR” package of R.Citation39 The purpose of DIF analysis was to prevent bias in the application of the same scale to different populations and thus avoid unfair evaluation for a certain population. Spearman correlation coefficient between the GMFCS and personability was estimated to analyze the validity of the estimated person ability and justification the Rasch model to measure health levels.
Results
Demographics
150 children with CP (84 males and 66 females) were recruited in this research. The distribution of demographic data was shown in , to show that the convenience sample conformed to the principle of maximum variation sampling, that was, to cover the whole range. There was no difference among different levels.
Table 1. The distribution of demographic data.
Pre-process
According to the standard that missing value should <5%, 24 items were eliminated. A total of 68 items were further analyzed by Mokken, including 33 items b and 35 items d.
Mokken Scale Analysis
(a) Data examination
Item b730 (Muscle power functions) handicap rate was 100% in the binarized data set, therefore excluded. The remaining 67 items were further analyzed as shown in .
Table 2. The remaining items in data examination during MSA.
As a significant correlation existed between the Guttman error number of each subject and the total score of the questionnaire as shown in (p < .001), Pearson’s correlation coefficient indicated a positive correlation and the effect reached .61, which was considered to be a moderate correlation.Citation40
Figure 1. The correlation between the Guttman error number of each subject and the total score of the questionnaire.
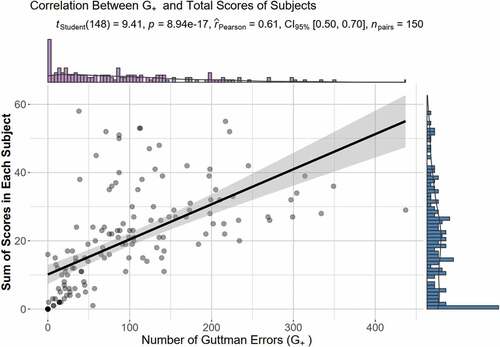
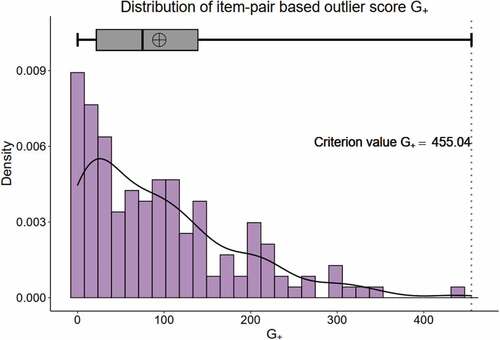
The distribution of the Guttman error number was skewed, and the upper bound of the adjusted boxplot was 455.04. In this study, no extreme value beyond the upper bound was found as shown in . Therefore, all subjects entered the next analysis.
Figure 2. The distribution of Guttman error.
(b) Scale identification
The overall homogeneity coefficient of the 67 items was .5235, which could be judged that the items constituted a strong scale.Citation29 The items needed to be furtherly filtered to conform to the MSA. The calculation results of AISP were illustrated in .
Table 3. The calculation results of AISP.
According to the report of the sample size required for MSA, the results of automated item filtering were examined around a threshold of .42.Citation34 There was 10 unscalable items (scale = 0), 2 minority dimension items (scale = 2) and 55 1-scale items (scale = 1). The remaining 1-scale items were concluded in .
Table 4. The remaining 1-scale items in the Mokken scale identification.
Based on the reserved 55 items, a new scale was constructed again, and the homogeneity coefficients of the whole and each item were calculated. The global homogeneity coefficient of the scale H = .5761 and the standard error (SE) = .0352 were concluded in . The Hi of every items was > .42, suggesting that the current sample size was suitable for the Mokken analysis of this item set. The standard error of b770 (Gait pattern functions) and d435 (Moving objects with lower extremities) was > .10, suggesting that more attention should be paid to future analysis and clinical evaluation.
Table 5. The global homogeneity coefficient and standard error of the reserved items.
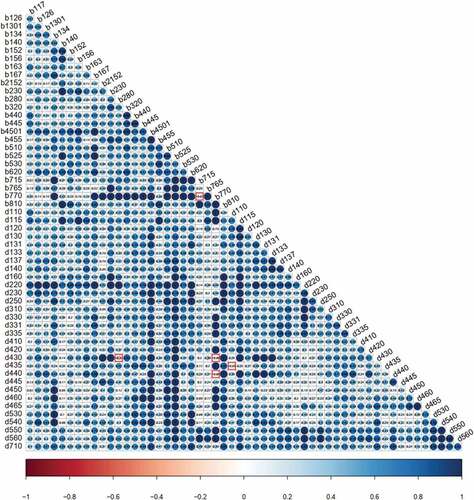
The homogeneity coefficient Hij was visualized in the form of a thermal diagram . The color of the origin was related to the value of Hij. The darker the blue, the larger Hij was; the darker the red, the smaller Hij was. A grid with a red box meant Hij < 0. By analyzing the figure, it was found that most of the absolute values of Hij violating the model were < .10: b770 and b715 (−.07), b770 and d430 (−.06), b770 and d440 (−.06) as well as d115 and d435 (−.05).
Figure 3. Local dependence based on the homogeneity coefficient Hij.
No items were eliminated through the local dependency algorithm embedded in the “check.ca” function. The 55 items were retained in the scale.
The indices of the monotonicity test were shown in . There were no significant violations , that was, #zsig was equal to 0. The item response function (IRF) of all items was of ascending type as shown in Appendix A.
Table 6. The indices of the monotonicity test.
There were four items defined with a significant violation number #zsig of 1 in the invariant item ordering (IIO) test. Among the four items, the corresponding Crit < 40, and the actual number of violations was 2 or 3. The b1301 had the highest Crit value and the highest number of possible violations. The b152 ranked second in the number of possible violations, but the number of actual violations was the largest. After Mokken’s IIO algorithm deleted these two items in sequence, the remaining items could be invariantly ordered. There were 53 items left as shown in till now.
Table 7. The remaining items after Mokken’s IIO algorithm (manifest invariant item ordering, MIIO).
(c) Scale properties
The reliability test results showed that the Cronbach’s alpha = .9621, lambda-2 = .9653, MS statistic = .9705, LCRC = .9811, which indicated good reliability of the 53-item Mokken scale.Citation41
Rasch Modeling
(a) Screening loop
There were two loops in this study, and all the excluded items were generated from the goodness-of-fit test of items in the first loop, including b2152 (Functions of external muscles of the eye), b280 (Sensation of pain), d110 (Watching) and d435 (Moving objects with lower extremities). The list of all deleted items was concluded in Appendix B.
The Rasch model constructed by the remaining 49 items was compared. The p = 1 indicated no significant difference between the restricted model and the unrestricted model. However, the AIC (5250.53) and BIC (5398.05) of the restricted Rasch model were lower than the unrestricted Rasch model (7019.16 and 7169.69 respectively), while the logLik was higher (−2576.27 v.s. −3459.58) as displayed in . Therefore, the restricted Rasch model was selected. This constrained Rasch model comprising 49 items moved on to the next stage.
Table 8. The comparison of the restricted Rasch model and the unrestricted model.
(b) Model checking
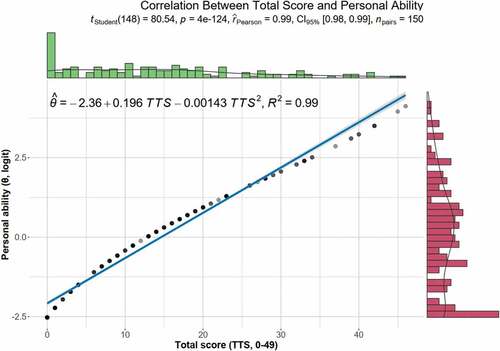
In this study, the GoF.Rasch algorithm of “ltm” package was applied and the resulted p value was .02. The selected Rasch model was considered to be not far from the simulated Rasch models based on the same parameters. The unidimensional test revealed that the measured second eigenvalue was 4.7482, while the average second eigenvalue of the Monte Carlo simulation model was 5.1080. The p value was .5545, which indicated there was no significant difference between the selected model and the simulated unidimensional models. In addition, a significant correlation between the total score of the scale and the individual ability level estimated by the Rasch model was shown in . The p value of the correlation test was 4 × 10−124, the effect value was .99, which meant a strong correlation.Citation40
Figure 4. The correlation between the total score of the scale and the individual ability level estimated by the Rasch model.
(c) Parameter estimation
The parameters of 49 items in the final Rasch model were displayed in , including item difficulty (also known as position), standard error (SE), and normalized value (z-score). It could be found that the Bonferroni adjusted p value of each item was greater than .05, suggesting that all items fit well.
Table 9. The parameters of 49 items in the final Rasch model.
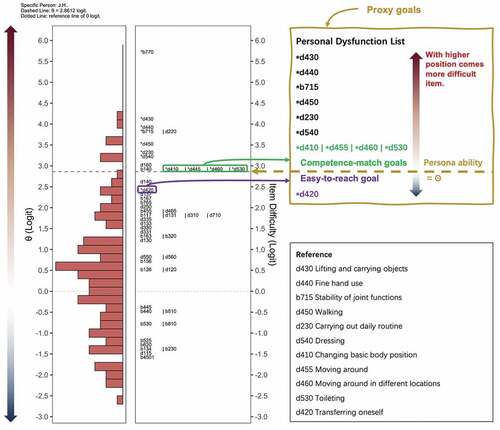
The Wright map of the relationship between individual capabilities and items was shown in , which suggested the items were fairly distributed across the range of individual abilities, and most items had proper difficulties. There was no obvious skewness in the distribution of individual ability.
Figure 5. The Wright map of the relationship between individual capabilities and item difficulties.
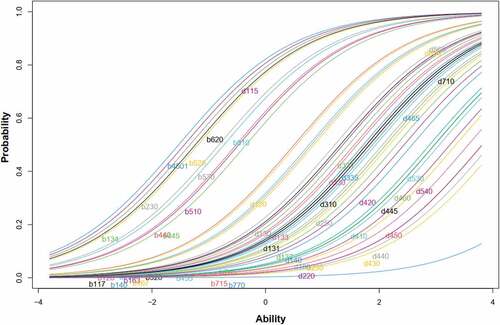
The ICCs indicated that the distribution of the items at different positions was s-shaped as shown in , and most item difficulties were in the range of 0–1. The slopes of curves were not far apart from each other. The parallelly increasing curves also supported the monotonicity and IIO.
Figure 6. The item characteristic curves in Rasch modeling.
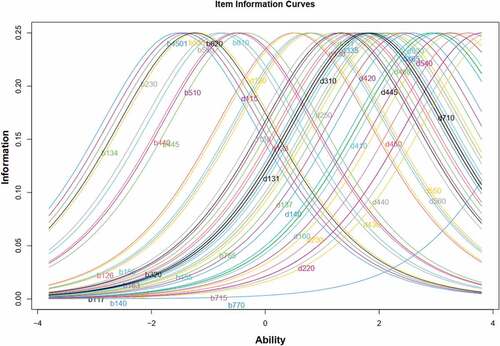
The item information curves indicated that each item had a relatively balanced amount of information at different levels of individual ability as displayed in . That was, although the bell-shaped curve moved along the horizontal axis, there was no significant difference in the highest point and the shape along the vertical axis.
Figure 7. The item information curves in Rasch modeling.
The Lord’s Chi-square limit was 3.84, but no items were identified as DIF items after Holm adjustment for multiple comparisonsas shown in . It was suggested that the Rasch model with 49 ICF items established had no significant gender bias in the estimation of individual ability level.
Table 10. The output of Lord’s Chi-square test.
There was a significant correlation between the individual ability level of each participant in the Rasch model and the GMFCS score (p = .006 < .05). The correlation coefficient was Spearman r = −.28 with 95%CI [−.42, −.12]. However, there was no significant correlation between individual ability level and MACS score (p = .192, Spearman r = −.19, 95%CI [−.37, −.00387]).
Discussion
The present study employed MSA based on the ICF-CY and estimated psychometric properties of children with CP through the Rasch model derived from the Mokken scale. The results confirmed the unidimensionality of the instrument and realized a simple assessment of ICF-based personability estimation for children with CP.
It is necessary to build a scale based on ICF to measure individual competence from the healthy level instead of the disabled degree. IRT is a theoretical system developed from the examination method to solve this requirement. As one of the best-known IRT models, the Rasch model has been applied to several ICF studies with the ICF brief core set, the rehabilitation set and the spinal cord injury set.Citation17–23 To describe the relationship between person ability and the scale score, the parametric IRT models set a variety of parameters including discrimination, difficulty, pseudo-guessing parameter, and careless responding. In recent years, the nonparametric IRT models based on the Mokken hypothesis have raised attention in medical research, which can simplify the procedure of item screening for further Rasch modeling.Citation24–26 Mokken proposes that high-ability subjects are more likely to score on low-difficulty tasks. Thus, MSA has been developed for the calculation of the total score, and the Mokken scale becomes the simplest form of clinical quantitative evaluation.Citation24,Citation35 On the one hand, MSA can rank the personal abilities by sorting total scores rather than by estimating parameters. The unidimensional Rasch model can help obtain the individual ability estimation of the subjects. In addition, the general ICF assessment takes a long time to complete the five-level score of each item, which limits the clinical application. By changing the graded method, a binary data series (0 means disabled, 1 means healthy) can be constructed, so that the total score can reflect the health level of patients.
This study excluded 24 items at the pre-processing phase. The great number of missing values in these items could be due to inapplicability to all age groups. For example, d815 (Preschool education) and d820 (School education) were not suitable for certain age groups. Also, b164 (Higher-level cognitive functions), d145 (Learning to write), d510 (Washing oneself), d520 (Caring for body parts), d845 (Acquiring, keeping, and terminating a job) were unfit for younger children. Item b730 (Muscle power functions) was eliminated in the data examination step of the MSA stage because of the 100% dysfunction rate. To apply Rasch modeling in the follow-up stage, it was necessary to build unidimensional data instead of multidimensional data. According to the recommendation criteria of the Mokken analysis, the threshold filtering requirements of a one-dimensional data set are as follows: A) most or all of the items are located in the same scale; B) there is a secondary scale less than the primary scale; C) one or above smaller scales are with some non-scalable entries.Citation29 If the screening scheme meets these three requirements, the item contained in A will be selected as the final item. As such, the AISP eliminated 12 items with a boundary of .42. The eliminated 0-scale item included b210 (Seeing functions), b260 (Proprioceptive function), b710 (Mobility of joint functions), b735 (Muscle tone functions), b740 (Muscle endurance functions), b755 (Involuntary movement reaction functions), b760 (Control of voluntary movement functions), d415 (Maintaining a body position), d455 (Moving around), d880 (Engagement in play), and the eliminated 2-scale items were d350 (Conversation) and d760 (Family relationships). During the invariant item ordering test of the MAS stage, b152 (Emotional functions) and b1301 (Motivation) were excluded. The former ranked second in the number of possible violations, but the number of actual violations was the largest. The latter got the highest Crit value and the highest number of possible violations. During item screening looping of the Rasch stage, four items failed to pass the goodness-of-fit test in the first loop, including b2152 (Functions of external muscles of the eye), b280 (Sensation of pain), d110 (Watching) and d435 (Moving objects with lower extremities). To sum up, a total of 19 items were excluded in MSA and Rasch modeling stages. Considering that the research population was children with CP, one possible reason for these exclusions could be that the content of the item was a favored and valued issue for diagnosis rather than for functioning level evaluation, such as b735 (Muscle tone functions), b755 (Involuntary movement reaction functions), b760 (Control of voluntary movement functions) and so on. Another potential reason may be that the items were assessed without sufficient consistency and precision. Some functions were more likely to vary in children than in adults. Some conditions may not be expressed clearly by children. For example, b1301 (Motivation), b152 (Emotional functions), b280 (Sensation of pain). One highly important reason that should be emphasized was that IRT modeling filterd out all items that did not contribute to differentiating person abilities. That was, although the removed items seemed valuable for CP children, they could not constitute a scale for ranking functioning abilities.
Ultimately, the number of preserved ICF items was reduced to 49, which would help to shorten the interview elapsed time visibly. The difficulty ranking of the items showed that among the top 10 items, 2 items were in the b domain and 8 items were in the d domain. Among them, b770 (Gait pattern functions) was the most difficult item, suggesting that children with CP were most prone to gait disorders. Most d domain items involved upper limb and hand mobility, indicating that most children with CP had dysfunction of upper limbs and hands. A distinct proportion of items 11 to 40 were related to cognitive and verbal functions, while the last 9 items were more related to basic functions such as b440 (Respiration functions), b134 (Sleep functions), b525 (Defecation functions), b620 (Urination functions) and so on. The score conversion table could be found in Appendix C.
The significant correlation between person ability and GMFCS revealed that the scale generated in this study can be used to reflect the gross exercise level of children. The lower the GMFCS score is, the lower the handicap level is, the higher the health level is.Citation40 In addition, the individual ability level calculated by the model can aid in the diagnosis and treatment of CP. However, the fine motor level (MACS) cannot be obtained by the conversion of score alone and may need to be combined with the special evaluation.
This study has certain clinical value. First, the binarization of the data offers a clinically friendly scoring system. The assessment can be done via a quick yes-or-no questionnaire. Second, the strategy of assigning impairment/dysfunction as 0 and independent/functioning as 1 makes the latent trait estimated by the IRT model to be level of person abilities rather than degree of person disabilities. Third, based on the “assigning by functioning” strategy, the difficulty estimated by the IRT model gets its clinical meaning of “how difficult is it to let this item get score 1, be independent, or maintain healthy.” Putting the three points together, for a specific person, their personal health level estimated through the IRT model and the specific dysfunction items in their response records can be embedded into a background of the populational distribution of person abilities and item difficulties. shows that the J.H. had personal ability value of 2.8612 logit. The d420 (Transferring oneself) was easier than her ability. From a populational perspective, J.H. should be capable of d420. However, her d420 was dependent. Therefore, we can propose the d420 as the preferred rehabilitation target. Among the categories more difficult than J.H.’s ability, the d410 (Changing basic body position), d445 (Hand and arm use), d460 (Moving around in different locations), and d530 (Toileting) were the four dependent items closest to her ability level. If we want to discuss with the caregiver/child about which item should be the optimal rehabilitation goal, the relationships between individual ability and populational item difficulty distribution can offer more solid evidence for the conversation. If we want to study the dependent items in more details, the rank of item difficulty may provide directions for assessments utilizing other comprehensive scales. To sum up, the primary purpose of this study is to provide a convenient ICF-based tool for children with CP at the level of functioning, independent, and health. Additionally, it can also provide a reference for the selection of therapeutic target items in clinical application.
Some limitations should be acknowledged in this study. First, the subjects of this study were children with CP, who may lack sufficient judgment, execution, and cooperation. Thus, a portion of the ICF assessments was completed by the guardians, which differs from the original design of IRT. This cohort of children will continue to be followed up in the future to determine if the model of this study reflects the actual health status in this age group. Second, the sample size needed to be expanded in order to help address the above issues and to provide the indicator as accurate as possible. We will continue to include subjects of different ages and educational levels, as the unscalable items in this study may be scalable well across populations with different age ranges and educational levels.
Conclusion
This study has confirmed the ICF clinical application through the Rasch model based on MSA, which focused on the healthy level rather than the disabled condition. With relatively fewer but more specific items, it can guide the grading of individual functioning degrees in the assessment and treatment for children with CP.
Supplemental Material
Download MS Word (478.3 KB)Acknowledgments
The study was approved by the ethics committee of TheSir Run Run Hospital, Nanjing Medical University (IRB# 2018-SR-017). We are grateful to all the participants and therapists for data collection.
Disclosure Statement
No potential conflict of interest was reported by the author(s).
Supplementary Material
Supplemental data for this article can be accessed online at https://doi.org/10.1080/17518423.2023.2166614
Additional information
Funding
References
- Furtado MAS, Ayupe KMA, Christovão IS, et al. Physical therapy in children with cerebral palsy in Brazil: a scoping review. Dev Med Child Neurol. Published online October 2, 2021. doi:10.1111/dmcn.15067.
- Schiariti V, Longo E, Shoshmin A, Kozhushko L, Besstrashnova Y, Król M, Neri Correia Campos T, Náryma Confessor Ferreira H, Verissimo C, Shaba D, et al. Implementation of the International Classification of Functioning, disability, and health (ICF) core sets for children and youth with cerebral palsy: global initiatives promoting optimal functioning. IJERPH. 2018;15(9):1899. doi:10.3390/ijerph15091899.
- Barutcu A, Barutcu S, Kolkiran S, Ozdener F. Evaluation of anxiety, depression and burden on caregivers of children with cerebral palsy. Dev Neurorehabil. 2021;24(8):555–60. doi:10.1080/17518423.2021.1917718.
- Katchburian LR, Oulton K, Main E, Morris C, Carr LJ. Protocol for The toxin study: understanding clinical and patient reported response of children and young people with cerebral palsy to intramuscular lower limb Botulinum neurotoxin-A injections, exploring all domains of the ICF. A pragmatic longitudinal observational study using a prospective one-group repeated measures design. BMJ Open. 2021;11(4):e049542. doi:10.1136/bmjopen-2021-049542.
- Makris T, Dorstyn D, Crettenden A. Quality of life in children and adolescents with cerebral palsy: a systematic review with meta-analysis. Disability and Rehabilitation. 2021 Published online 2019:11;43(3):299–308. doi:10.1080/09638288.2019.1623852.
- Reid SM, Meehan EM, Arnup SJ, Reddihough DS. Intellectual disability in cerebral palsy: a population‐based retrospective study. Dev Med Child Neurol. 2018;60(7):687–94. doi:10.1111/dmcn.13773.
- Benner JL, Hilberink SR, Veenis T, Stam HJ, van der Slot WM, Roebroeck ME. Long-term deterioration of perceived health and functioning in adults with cerebral palsy. Arch Phys Med Rehabil. 2017;98(11):2196–2205.e1. doi:10.1016/j.apmr.2017.03.013.
- Shevell M. Cerebral palsy to cerebral palsy spectrum disorder: time for a name change? Neurology. 2019;92(5):233–35. doi:10.1212/WNL.0000000000006747.
- Lins L, Carvalho FM. SF-36 total score as a single measure of health-related quality of life: scoping review. SAGE Open Med. 2016;4:205031211667172. doi:10.1177/2050312116671725.
- Mohon RT, Sawyer K, Pickett K, Bothwell S, Brinton JT, Sobremonte-King M, DelRosso LM. Sleep-related breathing disorders associated with intrathecal baclofen therapy to treat patients with cerebral palsy: a cohort study and discussion. NeuroRehabilitation. 2021 Published online 2021:11;48(4):481–91. doi:10.3233/NRE-210012.
- Palisano RJ, Avery L, Gorter JW, Galuppi B, Mccoy SW. Stability of the gross motor function classification system, manual ability classification system, and communication function classification system. Dev Med Child Neurol. 2018;60(10): 1026–32. doi:10.1111/dmcn.13903 .
- Jette AM. The Utility of and Need for Improving the ICF. Phys Ther. 2018;98(8):629–30. doi:10.1093/ptj/pzy056.
- Limsakul C, Noten S, Selb M, Stam HJ, Van WMA, Roebroeck ME. Developing an icf core set for adults with cerebral palsy: a global expert survey of relevant functions and contextual factors. J Rehabil Med. 2020;52(4 jrm00049). . doi:10.2340/16501977-2669.
- Noten S, Troenosemito LAA, Limsakul C, Selb M, de Groot V, Konijnenbelt M, Driessen DMF, Hilberink SR, Roebroeck ME, van den Berg‐emons RJG, et al. Development of an ICF Core Set for adults with cerebral palsy: capturing their perspective on functioning. Developmental Medicine & Child Neurology. 2021;63(7):846–52. Published online 2021:7. doi:10.1111/dmcn.14841.
- Schiariti V, Selb M, Cieza A, O’Donnell M. International classification of functioning, disability and health core sets for children and youth with cerebral palsy: a consensus meeting. Developmental Medicine & Child Neurology. 2015 Published online 2014:10;57(2):149–58. doi:10.1111/dmcn.12551.
- Pan YL, Hwang AW, Simeonsson RJ, Lu L, Liao HF. ICF-CY code set for infants with early delay and disabilities (EDD code set) for interdisciplinary assessment: a global experts survey. Disabil Rehabil. 2015;37(12):1044–54. doi:10.3109/09638288.2014.952454.
- Feng C, Jiang Z-L, Sun M-X, Lin F. Simplified post-stroke functioning assessment based on ICF via dichotomous mokken scale analysis and rasch modeling. Front Neurol. 2022;13:827247. doi:10.3389/fneur.2022.827247.
- Feng C, Geng B-F, Liu S-G, et al. Activity and participation in haemophiliacs: item response modelling based on international classification of functioning, disability and health. Haemophilia. 2022;28(1):1–9. doi:10.1111/hae.14702.
- Li K, Yan T, You L, Xie S, Li Y, Tang J, Wang Y, Gao Y. Psychometric properties of the international classification of functioning, disability and health set for spinal cord injury nursing based on rasch analysis. Disabil Rehabil. 2018;40(3):338–45. doi:10.1080/09638288.2016.1250169.
- Ehrmann C, Prodinger B, Stucki G, Cai W, Zhang X, Liu S, Liu S, Li J, Reinhardt JD. ICF Generic Set as new standard for the system wide assessment of functioning in China: a multicentre prospective study on metric properties and responsiveness applying item response theory. BMJ Open. 2018;8(12):e021696. doi:10.1136/bmjopen-2018-021696.
- Liu S, Reinhardt JD, Zhang X, Ehrmann C, Cai W, Prodinger B, Liu S, Li J. System-wide clinical assessment of functioning based on the international classification of functioning, disability and health in china: interrater reliability, convergent, known group, and predictive validity of the ICF generic-6. Arch Phys Med Rehabil. 2019;100(8):1450–1457.e1. doi:10.1016/j.apmr.2018.11.014.
- Gao Y, Yan T, You L, Li K, Zhang L, Zhang M. Psychometric properties of the international classification of functioning, disability and health rehabilitation set: a rasch analysis. Int J Rehabil Res. 2021;44(2):144–51. doi:10.1097/MRR.0000000000000463.
- Jia M, Tang J, Xie S, He X, Wang Y, Liu T, Yan T, Li K. Using a mobile app-based international classification of functioning, disability, and health set to assess the functioning of spinal cord injury patients: rasch analysis. JMIR Mhealth Uhealth. 2020;8(11):e20723. doi:10.2196/20723.
- Stochl J, Jones PB, Croudace TJ. Mokken scale analysis of mental health and well-being questionnaire item responses: a non-parametric IRT method in empirical research for applied health researchers. BMC Med Res Methodol. 2012;12(1):74. doi:10.1186/1471-2288-12-74.
- Vaughan B, Grace S. A Mokken scale analysis of the peer physical examination questionnaire. Chiropr Man Therap. 2018;26(1):6. doi:10.1186/s12998-018-0176-0.
- Zhang L, Li Z. A Mokken scale analysis of the Kessler-6 screening measure among Chinese older population: findings from a national survey. BMC Geriatr. 2020;20(1):361. doi:10.1186/s12877-020-01771-w.
- Mukhtiar K, Ibrahim S, Ahmed M. Application of ICF-CY Core Sets in Children with Spastic Cerebral Palsy. J Pediatr Neurol. 2020;18(1):017–021. doi:10.1055/s-0039-1685157.
- Patton MQ. Qualitative Research & Evaluation Methods: integrating Theory and Practice, Fourth ed. CA, US: SAGE Publications, Inc; 2015.
- Sijtsma K, van der Ark LA. A tutorial on how to do a Mokken scale analysis on your test and questionnaire data. Br J Math Stat Psychol. 2017;70(1):137–58. doi:10.1111/bmsp.12078.
- van der Ark LA. New developments in Mokken scale analysis in R. J Stat Softw. 2012;48(5): 1–27. doi:10.18637/jss.v048.i05.
- Hubert M, Vandervieren E. An adjusted boxplot for skewed distributions. Comput Stat Data Anal. 2008;52(12):5186–201. doi:10.1016/j.csda.2007.11.008.
- Newgard CD, Haukoos JS. Advanced statistics: missing data in clinical research-part 2: multiple imputation. Acad Emerg Med. 2007;14(7):669–78. doi:10.1111/j.1553-2712.2007.tb01856.x.
- Straat JH, van der Ark LA, Sijtsma K. Comparing optimization algorithms for item selection in Mokken scale analysis. J Classif. 2013;30(1):75–99. doi:10.1007/s00357-013-9122-y.
- Straat JH, van der Ark LA, Sijtsma K. Minimum sample size requirements for Mokken scale analysis. Educ Psychol Meas. 2014;74(5):809–22. doi:10.1177/0013164414529793.
- Straat JH, van der Ark LA, Sijtsma K. Using conditional association to identify locally independent item sets. Methodology. 2016;12(4):117–23. doi:10.1027/1614-2241/a000115.
- Sengul Avsar A. Ezel tavsancil. Examination of polytomous items’ psychometric properties according to nonparametric item response theory models in different test conditions. Educ Sci-Theor Pract. 2017. doi:10.12738/estp.2017.2.0246.
- Rizopoulos D. An R package for latent variable modeling and item response theory analyses. J Stat Soft. 2006;17(5). doi:10.18637/jss.v017.i05.
- Drasgow F, Lissak RI. Modified parallel analysis: a procedure for examining the latent dimensionality of dichotomously scored item responses. J Appl Psychol. 1983;68(3):363–73. doi:10.1037/0021-9010.68.3.363.
- Magis D, Béland S, Tuerlinckx F, De Boeck P. A general framework and an R package for the detection of dichotomous differential item functioning. Behav Res Methods. 2010;42(3):847–62. doi:10.3758/BRM.42.3.847.
- Akoglu H. User’s guide to correlation coefficients. Turk J Emerg Med. 2018;18(3):91–93. doi:10.1016/j.tjem.2018.08.001.
- Myszkowski N. A Mokken Scale analysis of the last series of the Standard Progressive Matrices (SPM-LS). J Intell. 2020;8(2):22. doi:10.3390/jintelligence8020022.
Appendix A.
The item response function (IRF) of items
