
ABSTRACT
Background
Fear of relapse into psychosis is an independent risk factor for future relapse events, indicating its importance as a novel intervention target.
Methods
Twenty-five participants responded to daily ecological momentary assessment prompts assessing common early warning signs of relapse and self-reported positive experiences like feeling supported by others. We conducted multilevel vector auto-regression using common symptoms assessed in early warning signs monitoring relapse prevention while controlling for positive self-reported experiences like feeling supported by others to estimate three networks (to explore concurrent, temporal and overall relationships).
Results
Reporting fear of relapse was positively associated (within the same cross-sectional time window) with hearing voices, alongside anxiety, negative affect and sleep change. Fear of relapse appeared to predict anxiety, negative affect and greater fear of relapse on the next consecutive day. However, none of the typical early warning signs predicted fear of relapse within the temporal window, and the observed relationships were small.
Discussion
Early warning signs appeared to be poor predictors of experiencing fear of relapse in this study. Fear of relapse predicts later anxiety and negative affect and may be a valuable intervention target within the daily life of people diagnosed with schizophrenia.
KEYWORDS:
Introduction
Fear of relapse describes distress and worry about experiencing a relapse of psychosis and is closely linked to the trauma of psychosis and experiences of psychiatric treatment (White & Gumley, Citation2009). The cognitive interpersonal model of relapse (Gumley et al., Citation2020) states that fear of relapse is associated with emotional, cognitive and behavioural avoidance and delayed help-seeking. Relapses may be preceded by so-called “early warning signs” (EWS), which are subtle changes in affect, thoughts and behaviour that occur before relapse events (Birchwood et al., Citation2000). Monitoring for EWS and intervening when they occur is a common relapse prevention strategy (NICE, Citation2014). Fear of relapse is an independent predictor of relapse itself, which makes it a potential EWS and a promising intervention target (Gumley et al., Citation2015). Beyond typical EWS, such as sleep changes and paranoia (Eisner et al., Citation2013), there is recognition that positive wellbeing experiences such as self-esteem may also play a protective role against relapse (Holding et al., Citation2013). Additionally, perceived social support may buffer against relapse (Vázquez Morejón et al., Citation2018).
Current research suggests fear of relapse is positively associated with depression and anxiety (Zukowska et al., Citation2022). In addition, fear of relapse may be a self-fulfilling process, which triggers further anxiety (Jamalamadaka et al., Citation2020). However, due to the cross-sectional nature of existing research, little is known about what might influence fear of relapse because these methodological approaches do not account for how psychotic and affective experiences fluctuate over time (Lecomte et al., Citation2018). Uncovering variables that influence daily fluctuations in fear of relapse using time-series methods may give insight into what mechanisms drive fear of relapse and map out potential intervention targets. For example, identifying what predicts fear of relapse at the next time point may uncover possible maintenance cycles. EWS are important within the cognitive interpersonal model because fear of relapse may both influence and be influenced by other EWS, which means it is important to understand how common EWS relate to fear of relapse. Therefore, there is merit in using multivariate approaches to explore relationships between fear of relapse and other symptoms and experiences, and the validity of a time-series model would be enhanced by including protective factors.
Constructing models to understand natural daily fluctuations requires intensive longitudinal data. Network analysis is a statistical framework particularly suited to understanding potential maintenance cycles in longitudinal data because it identifies relationships between variables that are observed repeatedly over time and estimates the temporal order of relationships (Epskamp et al., Citation2018). In network analysis, the relationships between variables (nodes) are represented as “edges” in a graph. This approach generates three types of networks: a temporal network, which estimates if symptoms predict one another over time (indicating potential maintenance cycles); a contemporaneous network, which shows if symptoms predict one another in the same window of measurement when controlling for previous time points (indicating what fear of relapse typically co-occurs with); and a between-subjects network, which is a cross-sectional between persons model and can indicate, for example, whether people who experience fear of relapse are, on average, also more likely to experience anxiety.
This study aimed to conduct a time series on an ecological momentary assessment (EMA) dataset collected from people who have experienced a relapse within the preceding 2 years using network analysis. The EMA protocol includes EWS that have been previously demonstrated to occur before a relapse (Eisner et al., Citation2013) (paranoia, anxiety, negative affect, sleep changes, fear of relapse and voice hearing) and includes protective factors (feeling confident and perceived social support). Due to existing cross-sectional research evidence, we were particularly interested in relationships between fear of relapse, low mood and anxiety. While these should not be considered hypotheses, to explore whether these identified factors were associated with fear of relapse and whether there were indications for temporal relations (potential maintenance cycles) in this sample we:
Examined the consecutive (lagged) relations between fear of relapse and the same variables with a temporal network.
Examined the concurrent relations between fear of relapse and common EWS and protective factors by estimating a contemporaneous network.
Examined general relationships between mean scores of fear of relapse and common EWS and protective factor variables across time by estimating a between-subjects network.
We pre-stated our intention to study how these relationships varied during both stable phases and relapse (Allan et al., Citation2019), but there were concerns about obtaining sufficient power to do so (i.e. >30 observations; (Howe et al., Citation2020)) because so few relapse events occurred (n = 7 when exposed to the intervention). We report one case study where a participant consistently supplied EMA data in the 30 days before a relapse event.
Methods
Data sources and participants
Data were collected in the UK and Australia as part of a cluster randomised controlled trial (EMPOWER ISRCTN99559262) (Gumley et al., Citation2022). The West of Scotland Research Ethics Service (GN16MH271 Ref: 16/WS/0225) and Melbourne Health Human Research Ethics Committee (HREC/15/MH/344) approved the study. All participants met the criteria for schizophrenia spectrum diagnosis using the ICD-10 with diagnosis established from clinical notes. Recruitment occurred via community mental health teams.
Measures
The EMPOWER platform was used to collect participant responses. EMA prompts appeared at a pseudo-random moment once a day; this meant that an alert would appear on the app inviting a participant to complete a questionnaire at a randomly selected time between 10 am and 6 pm. Pseudo-randomisation was chosen as there is less chance for memory distortion than when people are asked to summarise information from longer periods. Additionally, time of day may influence feelings (Napa Scollon et al., Citation2009) which the pseudorandomised design helps to control. When the app was set up, participants were instructed to answer questions reflecting on what they felt at that moment. All EMA questions asked participants to rate themselves between 1 (lowest) and 7 (highest). The 22 questionnaire items completed by participants reflected different domains (e.g. mood, anxiety, coping, psychotic experiences, self-esteem, and fear of relapse). Out of the original 22 items, all participants were asked to respond to 16 core items, with the additional 6 items allowing for tailoring of questions. Participants could use the app for up to 12 months. By June 2019, the server was shut down, and EMA data were available for analysis.
Responses to EMA prompt questions were nodes for the network analysis. With 16 questions, the core EMA set is large. However, networks with eight or more nodes are considered “highly dense” (Jordan et al., Citation2020), so to be parsimonious, we selected eight variables to function as nodes within this analysis – shown in . This is in line with good practice within the field, which recommends researchers start simple with variables based on existing research evidence (Jongeneel et al., Citation2019) which can then be refined in later research, as opposed to initially constructing complicated and explorative models, which may be difficult to interpret.
Table 1. Items and associated constructs included in the analysis.
Due to the high potential for analytical flexibility, we have been transparent about our variable choices (Flake & Fried, Citation2020), and a full list, which includes reasons for inclusion and non-inclusion of all 16 original variables (including item wording) can be seen in , we summarise this in more detail in the supplementary materials.
Table 2. Items and associated constructs not included in the analysis.
Group level
Multiple vector autoregression (VAR)
Data were analysed on R Studio version 4.0.2. All analysis code can be seen (https://osf.io/6gbs5/files/).
To estimate temporal relationships between fear of relapse and other variables of interest with multilevel VAR, we utilised the R package mlVAR (version 0.4.4) to estimate networks (Epskamp et al., Citation2018). mlVAR generated temporal networks that predicted each variable from its previous value (autocorrelation) and all other variables during the last measurement window (time-lagged effects) while controlling for all other network variables. We used a lag of 1 day. Next, mlVAR constructed the between-subjects network that represents the mean mutual regression of all variables in the form of a cross-sectional analysis. An edge that connects two nodes in a between-subjects network represents the mean of two regressions that are calculated using both nodes once as predictor and once as outcome. This way, between-subjects networks can be interpreted as cross-sectional associations between variables over the assessment period. From the residuals of the previous models, mlVAR generated a contemporaneous network representing the relationship between two nodes at the same time point, controlling for all other nodes in the network and temporal effects, indicating which variables occur simultaneously.
To minimise bias, we did not impute any missing data because we were not confident data were missing at random (Ono et al., Citation2019). To reduce the risk of false positives, we visualised the estimated networks using qgraph (version 1.6.5) (Epskamp et al., Citation2012), where we utilised the “and” rule, which requires that both edge relationships are significant in both potential directions. We applied a Bonferroni correction to determine edge statistical significance; this only reflects adjusting for multiple comparisons and is somewhat arbitrary (Lutz et al., Citation2018), which results in a sparse network with somewhat increased edge likelihood (Costantini et al., Citation2015). Due to the study’s exploratory nature, we included all significant edges.
Positive relationships in are blue and red relationships indicate negative relationships. In terms of the effect size interpretation, we used the same definition as Jongeneel and colleagues, who used Cohen’s definition for standardised partial correlations where r = 0.1 is small, r = 0.3 moderate, and r = 0.5 is large (Jongeneel et al., Citation2019).
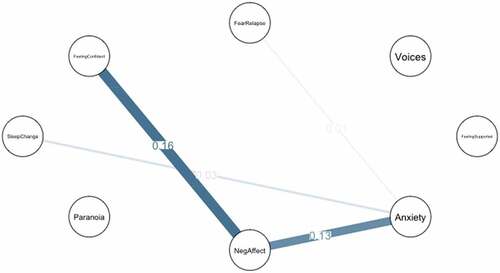
Figure 1. Contemporaneous network graph.
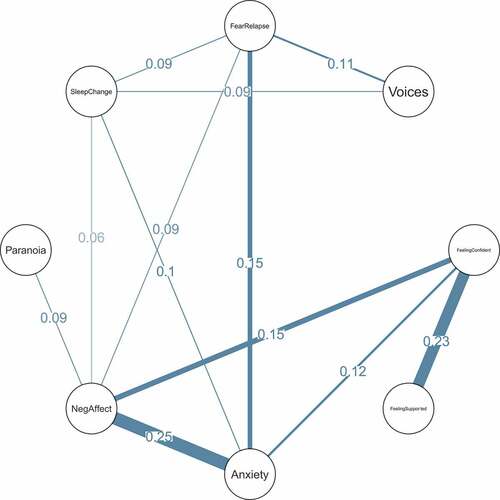
Figure 2. Temporal network graph.
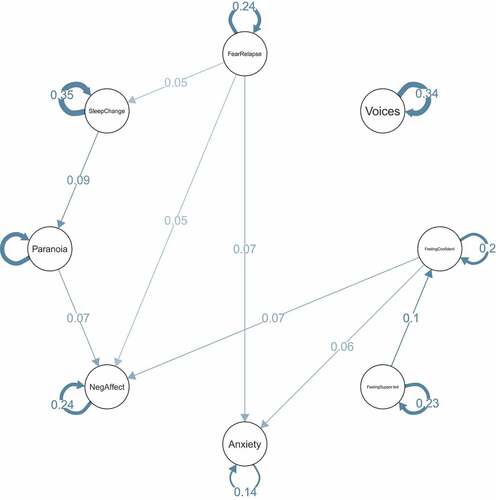
Figure 3. Between participants’ network.
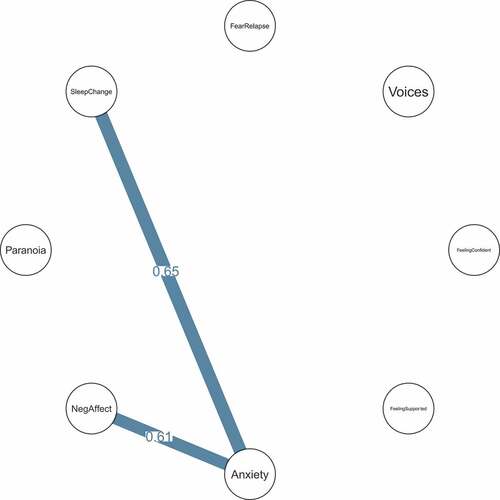
Figure 4. Contemporaneous network of 30 days prior to a relapse event.
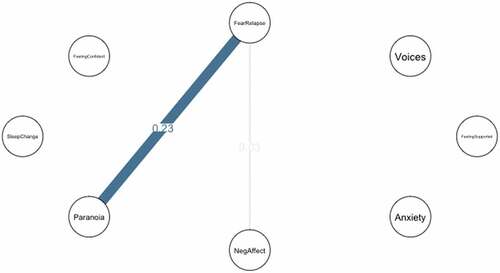
Figure 5. Contemporaneous network of the same participant over the whole time period.
Individual level
Graphical vector autoregression
Relapse was an outcome measure for the EMPOWER trial. The relapses were identified by research assistants completing an analysis of case notes – defined as (1) a return or worsening in psychotic symptoms of at least a moderate degree; (2) where symptoms lasted at least 1 week, (3) there was evidence of a decline in functioning and/or an increase in risk to self or others and (4) there is evidence of clinical response from services. From these, the research assistants gave a date of relapse onset. In addition, one participant used EMPOWER during a relapse event, so we were able to estimate idiographic lagged (lag 1 autoregressive) and contemporaneous (concurrent) graphical VAR models for the 30 days before relapse using the graphicalvar package (version 0.2.4). The results indicate lagged partial correlations between observed responses to EMA prompts (Epskamp et al., Citation2018). The mean variable scores for the case study (both during a relapse and in their overall usage period) are in .
Table 3. Mean scores for relapse case study in the 30-day period prior to relapse.
Table 4. Mean scores for relapse case study for overall usage period.
Results
Descriptive statistics
Recruitment occurred between the 19th of January and the 8th of August 2018. In total, 42 participants were randomised to receive EMPOWER and 41 completed app installation. Missing data are expected in EMA studies (Palmier-Claus et al., Citation2019) and in the absence of clear guidance on how much data are sufficient, we included participants who met the criteria of having completed at least 30 EMA questionnaires (Howe et al., Citation2020) and who had answered at least 33% valid prompts (Gumley et al., Citation2020) and had completed a 4-week baseline – meaning 25 participants included in this network analysis.
A recent review suggested age, gender, education, duration of illness, depression, positive symptoms and negative symptoms may impact digital intervention engagement (Arnold et al., Citation2021), so we explored baseline differences between the groups. There were no significant differences between groups on baseline demographics (gender, years of education, trial site, age and duration of contact with mental health services) or baseline scores on clinical assessment measures, including the positive, negative subscales and total scores of the Positive and Negative Syndrome Scale (Kay et al., Citation1987; van der Gaag et al., Citation2006) (PANSS), or total scores on the Calgary Depression Scale (Addington et al., Citation1993). Additionally, there were no differences in the Fear of Relapse subscale on the Fear of Relapse Scale. Therefore, we report baseline characteristic differences for those included (n = 25) and not included (n = 17) in .
Table 5. Characteristics of randomised sample at Baseline (Means and standard deviations).
The final dataset for the 25 included participants consisted of 6529 measurement occasions, of which 4928 (75.4%) were a complete set of EMA questions. Participants reported fear of relapse (defined as a score of more than 1) on 60.1% of complete responses to EMA prompts (individual range 0.45–100%) which indicated that at least some level of fear of relapse was present. However, multilevel VAR uses only consecutive responses because the temporal network explores relationships between consecutive prompts and the contemporaneous network is estimated from temporal residuals. Therefore, when removing non-consecutive responses (where there was at least one missing EMA prompt following a completed prompt), there were 4660 prompts, meaning the data utilised in this analysis represent 71.3% of possible measurement occasions for the 25 participants. Therefore, all further descriptive statistics are based upon consecutive responses to prompts. The descriptive statistics for responses to EMA prompts can be seen in .
Table 6. Mean scores for responses to EMA prompts used in the analysis.
The mean lag between the 4660 consecutive prompts was 23.99 hours (SD = 0.21). Therefore, the temporal network estimates how people respond around 24 hours after their previous questions. The shortest lag between consecutive beeps for a participant was 17.9 hours, and the longest was 30.87 hours. We will now describe the network analysis results and further sensitivity and stability tests.
Assumption checks
Both the group level and case study methods have assumptions, including stationarity and multivariate normality (Epskamp et al., Citation2018). Kolmogorov–Smirnov tests and visual inspection of density plots were done to assess the multivariate normality assumptions. According to the Kolmogorov–Smirnov tests, residuals of the multilevel VAR model were not normally distributed for any variable (all p < .001). The stationarity assumption is that the conditional probability distributions do not depend on time and are thus stable over time. To explore the stationarity, we used the Kwiatkowski-Phillips-Schmidt-Shin unit root test; all variables were stationary for all participants (p > 0.002, which was our Bonferroni corrected alpha level). To increase our confidence in this result (Jordan et al., Citation2020), we also conducted an Augmented Dicky–Fuller test, which indicated that variables were not stationary (p > 0.002). Due to these inconsistent results, we chose to run all network analyses (both group level and case study) on detrended data (with each participant detrended for their usage period using ordinary least-squares regression). This is in line with the exploratory research aims of the study because we are interested in what factors are associated with fear of relapse at a given time point for future theoretical development, rather than changes in the processes that have resulted in observed values (Piccirillo et al., Citation2019). Group-level and individual network estimation methods are underpinned by the assumption of Granger causality (Granger, Citation1969), where causes occur before any observed effects.
Sensitivity analyses
We ran two further supplemental analyses on the detrended data and another on the non-detrended data (results and rationale are in the appendix).
Group level results
Contemporaneous network
The contemporaneous network shows variables that tended to co-occur, at the same time controlling for all other variables. For example, within the contemporaneous network, fear of relapse showed positive relationships with (in decreasing order of partial correlation strength) anxiety (0.15), voices (0.11), sleep changes (0.09) and negative affect (0.09). Other relationships were observed between feeling confident and feeling supported (0.23), negative affect and anxiety (0.25), and feeling confident and anxiety (0.12) and negative affect (0.15).
Temporal network
The temporal network highlights variables that predicted themselves and each other across time. In the temporal network, fear of relapse had directed relationships with negative affect (r = 0.05,95%CI = 0.02,0.08), anxiety (r = 0.07,95%CI = 0.03,0.10) and sleep change (r = 0.08,95%CI = 0.02,0.11). Fear of relapse showed a positive autoregressive co-efficient (r = 0.24,95%CI = 0.16,0.32), indicating that reporting fear of relapse in a single time window was significantly positively associated with reporting fear of relapse in the next time window. However, none of the other variables predicted fear of relapse. Autocorrelation was observed for all variables. Other significant relationships of note included feeling supported predicting increased self-confidence (r = 0.10,95%CI = 0.04,0.11) and sleep change predicting persecutory paranoia (r = 0.08,95%CI = 0.03,0.14).
Between participants partial correlations network
The between-subject partial correlations show partial correlations among the stationary means of participant EMA responses (when controlling for the mean levels of all other variables). In other words, this network suggests that people who generally reported having changeable sleep also reported experiencing higher anxiety (r = 0.65). Additionally, anxiety was positively associated with negative affect (r = 0.61) – large effect sizes. We did not observe any relationships that were statistically linked to fear of relapse. The means of the within-person standardised mean levels used to create the between-subjects network can be seen in .
Table 7. Means of intra-individual data that forms between-subjects network.
Individual case study of relapse
In the 30 days prior to relapse onset, the contemporaneous network demonstrated a moderate positive partial correlation between fear of relapse and persecutory paranoia (0.23) and a very weak positive correlation between fear of relapse and negative affect (0.02). The temporal network did not demonstrate any significant relationships, and since this was a fully sparse network, we have not visualised the resulting graph. For comparison, we present the contemporaneous network for the overall usage period (280 days, 62.8% adherence) where fear of relapse shows a very weak (0.01) positive relationship with anxiety and no apparent link with paranoia.
Sensitivity analyses
We discuss sensitivity analyses in detail in the supplementary materials.
Discussion
In the current study, we investigated dynamic network associations between fear of relapse, protective factors and common EWS, including negative affect and anxiety. The cognitive interpersonal model (Gumley et al., Citation2020) assumes that fear of relapse may lead to the development of schemas, which influence meaning ascribed to psychotic or other personally salient EWS experiences. Although this study was preliminary, our main aim was to examine networks in line with this model. Findings indicate that fear of relapse demonstrated temporal and contemporaneous associations with anxiety and negative affect – even when controlling for all potential relationships between variables. Additionally, fear of relapse demonstrated additional positive relationships with voices and sleep changes in the contemporaneous network only. No significant associations were observed between fear of relapse and any variables in the between subjects’ network, which suggests that people who report fear of relapse did not generally tend to experience high levels of any included variable.
In terms of potential maintenance cycles, fear of relapse appeared to predict greater fear of relapse at the next time point and appears self-sustaining. However, none of the included variables predicted next-day fear of relapse, suggesting common EWS alone did not predict and may be unlikely to be useful intervention targets for fear of relapse. However, fear of relapse predicted next-day anxiety and negative affect – expanding upon previous cross-sectional work (Jamalamadaka et al., Citation2020). Intervening on fear of relapse may reduce anxiety and break the fear of relapse self-sustaining maintenance cycle. The effect sizes for the observed positive relationships between fear of relapse, voice, anxiety and negative affect were small; it may be the case that on a day-to-day basis fear of relapse results in later anxiety, which may have a cumulative effect over time (Funder & Ozer, Citation2019).
In the case study, fear of relapse demonstrated a positive contemporaneous relationship with persecutory paranoia before a relapse event, which may indicate heightened sensitivity to potential interpersonal threats (Meisel et al., Citation2018) – in line with the cognitive interpersonal model (Gumley et al., Citation2020). However, like the group-level analysis, no significant temporal relationships were observed, meaning none of the included variables predicted fear of relapse even before relapse. Our overarching interpretation of the three group networks and the single case study is that in daily life, fear of relapse is positively associated with negative emotional experiences, which may include persecutory paranoia before relapse. Consistent with the cognitive interpersonal model, the models suggest fear of relapse (perhaps triggered by a contextual factor) leads to negative experiences, rather than having high general fear of relapse being generally associated with low mood and anxiety given the lack of relationships between these variables in the between subjects’ network.
Beyond fear of relapse, other significant group-level relationships in the temporal network were apparent. For example, feeling supported was positively associated with increased self-confidence the next day. Low self-esteem is something many people diagnosed with schizophrenia want treatment and support for (Freeman et al., Citation2019), finding ways to help people feel that they are supported may be a useful target to increase everyday self-confidence. Additionally, sleep changes predicted later persecutory paranoia, supporting research linking the two (Waite et al., Citation2019). Finally, some observed relationships were unexpected. For example, the small positive partial correlation between negative affect and feeling confident and anxiety in the contemporaneous network may indicate that people feel confident despite negative emotional experiences.
These results must be interpreted considering several limitations. Firstly, we are reporting a subsample of a small number of people in a feasibility study. As the study was exploratory, we estimated edges conservatively, and the findings should be considered preliminary. Secondly, multilevel VAR assumes that the time lags between prompts are equal, but EMPOWER participants responded to pseudorandomised prompts. Exactly how departure from this assumption may impact network structure is still unknown (Oreel et al., Citation2019). Edges cannot be interpreted as authentic causal relationships because edges can arise from different unobserved factors that might influence daily fluctuations. While variable choices included common EWS that patients diagnosed with schizophrenia are advised to monitor for themselves (Morriss et al., Citation2013), the symptoms and experiences that get called EWS may only function as actual EWS before a relapse event and those included might not be sensitive enough or specific enough for predicting fear of relapse. Therefore, the group-level analysis will likely have missed specific phase changes when someone moves from a stable to a pre-relapse and relapse state – noted elsewhere (Bak et al., Citation2016). Finally, the data were skewed, which is common in psychosis studies assessing psychotic experiences in people diagnosed with psychotic conditions (Weijers et al., Citation2018), which led to non-normality. Non-parametric alternatives to network modelling (Aalbers et al., Citation2018) may be beneficial for research in the field of psychosis.
Network models only demonstrate potential connections between variables included within the network (Ryan et al., Citation2019). For example, we have not included data on how participants appraised the impact symptoms, which would be more informative and point to understanding the function of fear of relapse. Appraisal theories posit that emotional experiences emerge from the continuous evaluations of encountered stimuli on dimensions such as novelty and agency but also compatibility with a person’s values and experiences (Lange et al., Citation2020). Future work should consider operationalising aspects of the cognitive interpersonal model, such as differentiating cognitive triggers (for example, appraisal of psychosis) and contextual triggers (such as interpersonal encounters). Additionally, the single ESM item used to measure fear of relapse, “I have been worrying about relapse”, presents a psychological formulation for fear of relapse, which, as a construct, features behavioural components like avoidance (Zukowska et al., Citation2022). Additionally, the item wording is potentially biased as it refers to worry. Measurement refinement options to be considered in future studies would be to separate affect domains (such as anxiety) and cognitive domains (I am thinking about my illness) and behavioural (I am avoiding other people) separately and to involve patients’ perspectives in the prototyping of EMA measures. Finally, the EMA protocol was delivered only once daily, so it may have missed fast-acting processes. Research with more frequent observations is now needed to explore how long fear of relapse persists and what contextual factors are associated with longer duration and/or intensity of fear of relapse.
Conclusions
Fear of relapse appeared to be a relatively common experience in the day-to-day lives of people diagnosed with schizophrenia. This study was the first to use network models to explore the relationship between fear of relapse and common EWS, as anticipated by an existing psychological model. Network analysis suggested that fear of relapse was positively associated with negative affect and anxiety within the same time window and directionally predicted later experiences of fear of relapse, anxiety, and negative affect. However, no standard EWS variables appeared to predict fear of relapse, which suggests a need for revisions to the cognitive interpersonal model. Confirmatory hypothesis-driven research is now needed to explore the extent to which the relationships observed here (found to be generally small) in an independent sample.
Disclosure statement
No potential conflict of interest was reported by the authors.
Data availability statement
Data related to this research will be made available as soon as possible based upon a reasonable request to the study chief investigator.
Additional information
Funding
References
- Aalbers, G., Mcnally, R. J., Heeren, A., De Wit, S., & Fried, E. I. (2018). Social media and depression symptoms: A network perspective. 1(999), 1–9. https://psycnet.apa.org/doiLanding?doi=10.1037%2Fxge0000528
- Addington, D., Addington, J., & Maticka-Tyndale, E. (1993). Assessing depression in schizophrenia: The Calgary depression scale. British Journal of Psychiatry, 163(S22), 39–44. https://doi.org/10.1192/S0007125000292581
- Allan, S., Mcleod, H., Bradstreet, S., Beedie, S., Moir, B., Gleeson, J., Farhall, J., Morton, E., & Gumley, A. (2019). Understanding implementation of a digital self-monitoring intervention for relapse prevention in psychosis: Protocol for a mixed method process evaluation. JMIR Research Protocols, 8(12), e15634. https://doi.org/10.2196/15634
- Arnold, C., Farhall, J., Villagonzalo, K. A., Sharma, K., & Thomas, N. (2021). Engagement with online psychosocial interventions for psychosis: A review and synthesis of relevant factors. Internet Interventions, 25(June), 100411. https://doi.org/10.1016/j.invent.2021.100411
- Bak, M., Drukker, M., Hasmi, L., & Van Jim, O. S. (2016). An n=1 clinical network analysis of symptoms and treatment in psychosis. PLoS One, 11(9), 1–15. https://doi.org/10.1371/journal.pone.0162811
- Birchwood, M., Spencer, E., & Mcgovern, D. (2000). Schizophrenia: Early warning signs. Advances in Psychiatric Treatment, 6(2), 93–101. https://doi.org/10.1192/apt.6.2.93
- Costantini, G., Epskamp, S., Borsboom, D., Perugini, M., Mõttus, R., Waldorp, L. J., & Cramer, A. O. J. (2015). State of the aRt personality research: A tutorial on network analysis of personality data in R. Journal of Research in Personality, 54(July), 13–29. https://doi.org/10.1016/j.jrp.2014.07.003
- Eisner, E., Drake, R., & Barrowclough, C. (2013). Assessing early signs of relapse in psychosis: Review and future directions. Clinical Psychology Review, 33(5), 637–653. https://doi.org/10.1016/j.cpr.2013.04.001
- Epskamp, S., Borsboom, D., & Fried, E. I. (2018). Estimating psychological networks and their accuracy: A tutorial paper. Behavior Research Methods, 50(1), 195–212. https://doi.org/10.3758/s13428-017-0862-1
- Epskamp, S., Cramer, A. O. J., Waldorp, L. J., Schmittmann, V. D., & Borsboom, D. (2012). Qgraph: Network visualizations of relationships in psychometric data. Journal of Statistical Software, 48(4). https://doi.org/10.18637/jss.v048.i04
- Epskamp, S., Waldorp, L. J., Mõttus, R., & Borsboom, D. (2018). The Gaussian graphical model in cross-sectional and time-series data. Multivariate Behavioral Research, 3171(4), 1–28. https://doi.org/10.1080/00273171.2018.1454823
- Flake, J. K., & Fried, E. I. (2020). Measurement schmeasurement: Questionable measurement practices and how to avoid them. Advances in Methods and Practices in Psychological Science, 3(4), 456–465. https://doi.org/10.1177/2515245920952393
- Freeman, D., Taylor, K. M., Molodynski, A., & Waite, F. (2019). Treatable clinical intervention targets for patients with schizophrenia. Schizophrenia Research, 221, 44–50. https://doi.org/10.1016/j.schres.2019.07.016
- Funder, D. C., & Ozer, D. J. (2019). Evaluating effect size in psychological research: Sense and nonsense. Advances in Methods and Practices in Psychological Science, 2(2), 156–168. https://doi.org/10.1177/2515245919847202
- Granger, C. W. T. (1969). Investigating causal relations by econometric models and cross-spectral methods. Economentrica, 37(3), 424–438. https://doi.org/10.2307/1912791
- Gumley, A., Bradstreet, S., Ainsworth, J., Allan, S., Alvarez-Jimenez, M., Aucott, L., Birchwood, M., Briggs, A., Bucci, S., Cotton, S. M., Engel, L., French, P., Lederman, R., Lewis, S., Machin, M., MacLennan, G., McLeod, H., McMeekin, N., Mihalopoulos, C. … Gleeson, J. (2022). The EMPOWER blended digital intervention for relapse prevention in schizophrenia: A feasibility cluster randomised controlled trial in Scotland and Australia. The Lancet Psychiatry, 9(6), 477–486. https://doi.org/10.1016/S2215-0366(22)00103-1
- Gumley, A., Bradstreet, S., Ainsworth, J., Allan, S., Alvarez-Jimenez, M., Beattie, L., Bell, I., Birchwood, M., Briggs, A., Bucci, S., Castagnini, E., Clark, A., Cotton, S. M., Engel, L., French, P., Lederman, R., Lewis, S., Machin, M., MacLennan, G. … Gleeson, J. (2020). Early signs monitoring to prevent relapse in psychosis and promote well-being, engagement, and recovery: Protocol for a feasibility cluster randomized controlled trial harnessing mobile phone technology blended with peer support corresponding author. JMIR Research Protocols, 9(1), e15058. https://doi.org/10.2196/15058
- Gumley, A., Macbeth, A., Reilly, J. D., O’Grady, M., White, R. G., McLeod, H., Schwannauer, M., & Power, K. G. (2015). Fear of recurrence: Results of a randomized trial of relapse detection in schizophrenia. British Journal of Clinical Psychology, 54(1), 49–62. https://doi.org/10.1111/bjc.12060
- Holding, J. C., Tarrier, N., Gregg, L., & Barrowclough, C. (2013). Self-esteem and relapse in schizophrenia: A 5-year follow-up study. The Journal of Nervous and Mental Disease, 201(8), 653–658. https://doi.org/10.1097/NMD.0b013e31829c4ffc
- Howe, E., Bosley, H. G., & Fisher, A. J. (2020). Idiographic network analysis of discrete mood states prior to treatment. Counselling and Psychotherapy Research, 1–9, October 2019. https://doi.org/10.1002/capr.12295
- Jamalamadaka, T., Griffith, E., Steer, H., & Salkovskis, P. (2020). Fear of illness recurrence and mental health anxiety in people recovering from psychosis and common mental health problems. British Journal of Clinical Psychology, 59(3), 403–423. https://doi.org/10.1111/bjc.12253
- Jongeneel, A., Aalbers, G., Bell, I., Fried, E. I., Delespaul, P., Riper, H., Van Der Gaag, M., & Van Den Berg, D. (2019). A time-series network approach to auditory verbal hallucinations: Examining dynamic interactions using experience sampling methodology. Schizophrenia Research, 215, 148–156. https://doi.org/10.1016/j.schres.2019.10.055
- Jordan, D. G., Winer, E. S., & Salem, T. (2020). The current status of temporal network analysis for clinical science: Considerations as the paradigm shifts? Journal of Clinical Psychology, 76(9), 1591–1612. https://doi.org/10.1002/jclp.22957
- Kay, S. R., Fiszbein, A., & Opler, L. A. (1987). The positive and negative syndrome scale for schizophrenia. Schizophrenia Bulletin, 13(2), 261–276. https://doi.org/10.1093/schbul/13.2.261
- Lange, J., Dalege, J., Borsboom, D., van Kleef, G. A., & Fischer, A. H. (2020). Toward an integrative psychometric model of emotions. Perspectives on Psychological Science, 15(2), 444–468. https://doi.org/10.1177/1745691619895057
- Lecomte, T., Leclerc, C., & Wykes, T. (2018). Symptom fluctuations, self-esteem, and cohesion during group cognitive behaviour therapy for early psychosis. Psychology and Psychotherapy: Theory, Research and Practice, 91(1), 15–26. https://doi.org/10.1111/papt.12139
- Lutz, W., Ofmann, S. G., Fisher, A. J., Rubel, K., & Husen, J. A. (2018). Using network analyses for the prediction of treatment dropout in patients with mood and anxiety disorders: A methodological proof-of-concept study. Scientific Reports, 8(1), 1–25. https://doi.org/10.1038/s41598-018-25953-0
- Meisel, S. F., Garety, P. A., Stahl, D., & Valmaggia, L. R. (2018). Interpersonal processes in paranoia: A systematic review. Psychological Medicine, 48(14), 2299–2312. https://doi.org/10.1017/S0033291718000491
- Morriss, R., Vinjamuri, I., Faizal, M. A., Bolton, C. A., & McCarthy, J. P. (2013). Training to recognise the early signs of recurrence in schizophrenia. Cochrane Database of Systematic Reviews, 2. https://doi.org/10.1002/14651858.CD005147.pub2
- Napa Scollon, C., Prieto, C.-K., & Diener, E. (2009). Experience sampling: Promises and pitfalls, strength and weaknesses. In E. Diener (Ed.), Assessing well-being: The collected works of Ed Diener (pp. 157–180). Springer Netherlands. https://doi.org/10.1007/978-90-481-2354-4_8
- NICE. (2014, February). Psychosis and schizophrenia in adults: Psychosis and schizophrenia in adults: Prevention and management. www.Nice.Org.Uk
- Ono, M., Schneider, S., Junghaenel, D. U., & Stone, A. A. (2019). What affects the completion of ecological momentary assessments in chronic pain research? An individual patient data meta-analysis. Journal of Medical Internet Research, 21(2), e11398. https://doi.org/10.2196/11398
- Oreel, T. H., Borsboom, D., Epskamp, S., Hartog, I. D., Netjes, J. E., Nieuwkerk, P. T., Henriques, J. P. S., Scherer-Rath, M., van Laarhoven, H. W. M., & Sprangers, M. A. G. (2019). The dynamics in health-related quality of life of patients with stable coronary artery disease were revealed: A network analysis. Journal of Clinical Epidemiology, 107, 116–123. https://doi.org/10.1016/j.jclinepi.2018.11.022
- Palmier-Claus, J., Haddock, G., & Varese, F. (Eds.). (2019). Experience sampling in mental health research. Routledge, Taylor & Francis Group.
- Piccirillo, M. L., Beck, E. D., & Rodebaugh, T. L. (2019). A clinician’s primer for idiographic research: Considerations and recommendations. Behavior Therapy, 50(5), 938–951. https://doi.org/10.1016/j.beth.2019.02.002
- Ryan, O., Bringmann, L. F., & Schuurman, N. K. (2019). The challenge of generating causal hypotheses using network models. PsyArXiv, 29(6), 1–30. https://www.tandfonline.com/doi/full/10.1080/10705511.2022.2056039
- van der Gaag, M., Hoffman, T., Remijsen, M., Hijman, R., de Haan, L., van Meijel, B., van Harten, P. N., Valmaggia, L., de Hert, M., Cuijpers, A., & Wiersma, D. (2006). The five-factor model of the positive and negative syndrome scale II: A ten-fold cross-validation of a revised model. Schizophrenia Research, 85(1–3), 280–287. https://doi.org/10.1016/j.schres.2006.03.021
- Vázquez Morejón, A. J., León Rubio, J. M., & Vázquez-Morejón, R. (2018). Social support and clinical and functional outcome in people with schizophrenia. The International Journal of Social Psychiatry, 64(5), 488–496. https://doi.org/10.1177/0020764018778868
- Waite, F., Sheaves, B., Isham, L., Reeve, S., & Freeman, D. (2019). Sleep and schizophrenia: From epiphenomenon to treatable causal target. Schizophrenia Research, 221, 44–56. https://doi.org/10.1016/j.schres.2019.11.014
- Weijers, J., Viechtbauer, W., Eurelings-Bontekoe, E., & Selten, J.-P. (2018). Reported childhood abuse and stress reactivity in psychosis: A conceptual replication and exploration of statistical approaches. Frontiers in Psychiatry, 9(November), 1–7. https://doi.org/10.3389/fpsyt.2018.00639
- White, R. G., & Gumley, A. I. (2009). Postpsychotic posttraumatic stress disorder. The Journal of Nervous and Mental Disease, 197(11), 841–849. https://doi.org/10.1097/NMD.0b013e3181bea625
- Zukowska, Z., Allan, S., Eisner, E., Ling, L., Gumley, A., & Allan, S. (2022). Fear of relapse in schizophrenia: A mixed ‑ methods systematic review. Social Psychiatry and Psychiatric Epidemiology, 0123456789. https://doi.org/10.1007/s00127-022-02220-2