
ABSTRACT
Despite general disagreement over what the most suitable monetary value for a carbon price is, one particular carbon price somehow became the most commonly used price in cost–benefit analysis in the transport sector in Norway for a short period. This article examines how that came about by tracing that particular carbon price through several documents over the course of ten years. In understanding how the carbon price could travel, this study looks at the carbon price and its movements as a sequence of detachments, what I call ‘price picking.’ The study shows how a distribution of accountability stabilized the carbon price, and that certain guiding principles in the field of economics took part in steering and maintaining the carbon price. The study concludes that the distribution of accountability through price picking is both an expression of, and a response to, price realization being both a moral and political practice.
Introduction
In 2009, a handful of Norwegian analysts sat down to estimate a monetary value for greenhouse gas emissions, trying to foresee future developments in the carbon market. Ten years later, by 2019, some of the figures they came up with were in full circulation, but at this time they were used for a different purpose: namely, cost–benefit analysis in the transport sector in Norway. The carbon market analysts seem surprised and find it ‘a bit strange’ that their work can be traced forward to cost–benefit analysis.Footnote1 How did these figures travel from carbon market forecasts and end up denoting the cost of greenhouse gas emissions in cost–benefit analysis reports? This article traces this carbon price through a number of documents and investigates how it became legitimized and influential. Many of the economists interviewed for this article see the consensus on using this specific carbon price in cost–benefit analysis as the result of coincidence, and the following study enquires into how and why this ‘coincidence’ came about.
But first, what is a carbon price? A carbon price expresses the cost of greenhouse gas emissions by linking carbon dioxide equivalents (CO2-eq) to monetary value. It is a particular kind of price that does not originate from the market, but rather belongs to a ‘hypothetical’ market located in sites such as public policy (Fourcade Citation2011b, Stark Citation2011). The particular carbon price that is traced in this article consists of three monetary values linked to one tonne of CO2-eq as well as to three particular years, 2015, 2020 and 2030, and was until recently used in cost–benefit analysis. Cost–benefit analysis reports are meant to assist policymakers by elaborating and summarizing pros and cons of future investments. Questions of monetary valuation in cost–benefit analysis have been the subject of heated debate (Boudia Citation2016); in Norway, the pricing of greenhouse gas emissions is especially debated and is seen as more ‘political’ and demanding than, for instance, the pricing of air pollution.Footnote2 Even though greenhouse gas emissions have featured in cost–benefit analysis for a decade and a half, a consensus on the proper monetary value for greenhouse gas emissions has not yet been established in Norway, with the curious exception of the transport sector.
Compared to other sectors in Norway, the use of cost–benefit analysis is particularly common in the transport sector (Welde et al. Citation2013), and is often used to evaluate long-term investment projects involving high costs and the development of large material infrastructures. Some of these cost–benefit analysis reports form the basis for a Norwegian white paper and twelve-year investment plan for all transport modes that evaluate projects in terms of their benefits for society every four years. This article uses a broad understanding of the term ‘transport sector’ by including all public and private actors that work to plan, implement and evaluate solutions related to transport and communication in Norway. Various companies and units of government are responsible for the different modes of transport, which are all owned by or subordinated to the Ministry of Transport and Communication.Footnote3 Road transport, aviation, railway and shipping are responsible for 32% of Norway's greenhouse gas emissions, which makes this sector the biggest emitter when compared to other sectors (Norwegian Environment Agency Citation2019). The Norwegian government aims to halve the nation's transport emissions by 2030 (Norwegian Environment Agency Citation2019, Norwegian Ministry of Transport and Communication Citation2019). In cost–benefit analysis reports developed in the transport sector, the sector's future and potential greenhouse gas emissions are increasingly often taken into account.
The enquiries in this article are guided by the following question: how and why did one specific carbon price end up being commonly used in cost–benefit analysis in the transport sector in Norway? I introduce the idea of ‘price picking’ as a way of understanding how this particular carbon price has travelled and established itself in cost–benefit analysis in the Norwegian transport sector, and point to the distribution of accountability as a way of understanding why this carbon price managed to travel despite general disagreement over what a suitable carbon price is. The carbon price traced in this study was not only picked because of its actual monetary values, but because it has a particular form that complies with certain guiding principles in the field of economics. As the carbon price travelled from document to document, these travels served to secure it with legitimacy, authority and, to some degree, universality in cost–benefit analysis conducted in the Norwegian transport sector.
First, this article will present the approach and methods to conceptualize the framework combining insights from science and technology studies (STS) on economization and accountability. After a brief historical account of cost–benefit analysis, and how it works to take greenhouse gas emissions into account, the main section traces the carbon price back to carbon market forecasting. I then follow the carbon price on to its actual use in cost–benefit analysis and manuals advising such analysis, showing how it became increasingly formalized as it served the purpose of denoting greenhouse gas emissions in evaluation reports meant to support decision-making processes in the transport sector.
Approach and methods
As I examine a particular carbon price and the conditions of its ‘price realization’ (Çalışkan Citation2010), I analyse the travels of the carbon price as a process of price picking. The notion is inspired by the work of Latour (Citation1987) who has studied how an inscription may travel far due to an ability to avoid major modifications along the way,Footnote4 and who also notes that ‘form’ is one of the most important methods of translation because it allows something to be transported from one site to another (Latour Citation2005). Carbon prices have a particular form, since all are based on a standardized unit value attaching a tonne or kilogram of carbon dioxide equivalents to a monetary value. This form has been shaped through a process of commensuration that creates relations between things and makes them comparable through a common metric (Espeland and Stevens Citation1998, Espeland Citation2001); in turn making it possible for entities originating from highly different judgments, methods and contexts to have the same ‘exchange rate’ (MacKenzie Citation2009). This renders all carbon prices ‘detachable’ (Callon and Muniesa Citation2005) – pickable – from multiple contexts, thereby allowing them to travel. By choosing the verb ‘picking,’ I do not only wish to direct attention to the human actor who picks, such as a person conducting cost–benefit analysis, but to the calculative devices that enable and steer picking. The idea of such ‘distributed agency’ (Callon and Muniesa Citation2005), is central to the literature on ‘economization,’ which explores how the making of actions, devices and descriptions as ‘economic’ (Çalışkan and Callon Citation2009, p. 369) enables the ‘laws of economics’ to be applied to them (Grandclément and Nadaï Citation2018, Yearley Citation2018, p. 148). In this study, I argue that economization, as it mobilizes calculative devices in price formation processes, enables ‘distributed accountability.’
Accountability is the ‘capacity and desirability of holding certain actors and agencies to account for their actions’ (Neyland and Woolgar Citation2002, p. 264). Central to the literature on accountability, which makes it a continuation of the literature on distributed agency, is that non-human actors may both hold and distribute accountability. Studies have shown that market-based interventions can be considered ‘accountability devices’ that prefigure what should happen and accordingly hold participants to account as actions unfold (Neyland et al. Citation2018), that visual evidence can redistribute relationships and participate in settling matters (Neyland and Coopmans Citation2014), and that epidemiological risk scores can enact accountability and acquire legitimacy despite issues and limitations (Amelang and Bauer Citation2019). In this study, the guiding principles of economics are among the calculative devices that hold and distribute accountability, as they shape and maintain the carbon price that is traced in this article. Another central actor is the carbon price itself: as simultaneously a good and a calculative device (Callon and Muniesa Citation2005), it readily accounts for the monetary value of greenhouse gas emissions, and works as a mediator by holding and distributing accountability.
As this study investigates valuations of greenhouse gas emissions in cost–benefit analysis; it aims to contribute to the economization literature by combining it with insights from literature on accountability. Cost–benefit analysis has been previously explored in STS and affiliated disciplines (e.g. Espeland Citation2001, Porter Citation2007, Harvey and Knox Citation2008, Hirschman and Berman Citation2014, Boudia Citation2016, Souza Citation2018, Shafiee Citation2019); however, the monetary valuation of greenhouse gas emissions in cost–benefit analysis has only been explored by a few social scientists outside the field of economics (Lohmann Citation2009, Randalls Citation2011, Yearley Citation2018). This study also adds to research on carbon economics, where attention has especially been given to ‘carbon pricing’ by scholars studying the making of feed-in tariffs (e.g. Pallesen Citation2016, Cointe and Nadaï Citation2018), green taxes (e.g. Asdal Citation2014), and different carbon markets (e.g. Callon Citation2009, Ehrenstein and Muniesa Citation2013, Engels and Wang Citation2018). Practices of cost–benefit analysis arguably link these objects of study because cost–benefit analysts address them all as sites from which they can pick a carbon price.
The scope of this study is limited to a specific carbon price and its travels from 2009 to 2019. This carbon price first emerged in manuals for cost–benefit analysis in the Norwegian transport sector in 2014 and was used for at least five years. I have traced the carbon price in documents in which the carbon price circulates; these are various kinds of texts, including cost–benefit reports, manuals for cost–benefit analysis and carbon market analysis reports. In addition to these enquiries, I conducted and transcribed seven in-depth interviews in 2018 and 2019. Interviewees were selected based on their potential for highlighting the carbon price and its travels from various perspectives, as well as their potential for providing insights into the practices of cost–benefit analysis. The interviewees include a cost–benefit analyst at a consultancy who conducts cost–benefit analysis regularly, a former employee at a government agency who has used cost–benefit analysis reports in her work, the editor of a manual for cost–benefit analysis in the transport sector, and two of the analysts who wrote the aforementioned carbon market forecasts in 2009.Footnote5 In addition, I have interviewed a researcher and author of a white paper and reports on cost–benefit analysis who could share her general thoughts on carbon pricing, and an economist at a research institute of transport economics who has published a report suggesting an alternative to the carbon price that is traced in this article. I contacted the interviewees directly after identifying their names in documents addressing the carbon price in various ways, and one or two interviewees were suggested to me by other interviewees. Together with several informal conversations and attendance at a seminar devoted to this topic, these enquiries have provided an understanding of the settings in which the analysed documents were developed and used.
Accounting for costs and benefits
Institutionalizing cost–benefit analysis in policymaking
Cost–benefit analysis, by serving to clarify and visualize the effects of measures such as reforms, regulations and investments, is a form of investigation that is used as a steering mechanism. It was first introduced to support environmental management in the selection of water projects in the US in the 1930s, and has, over time, increasingly turned the US government into a ‘cost–benefit state’ that seeks regulations that promise net benefits (Porter Citation1996, Wiener Citation2013, Boudia Citation2016). Cost–benefit analysis is closely linked to welfare economics, and today it is a central theme for environmental economics, which emerged as a field in the 1960s (Sandmo Citation2015). As a policy device, cost–benefit analysis plays a crucial part in the governance of Western and modern bureaucracy (Bowker and Star Citation2000, Porter Citation2007, Dussauge et al. Citation2015, Yearley Citation2018), and to a lesser degree, in the world of business (Espeland Citation2001). The use of cost–benefit analysis is proliferating around the world, increasingly including developing countries (Livermore and Revesz Citation2013). In general, cost–benefit analysis is often practiced in highly politically-charged contexts (Porter Citation2007).
In Norway, the institutionalization of economic analysis in policymaking began several decades ago, and the Ministry of Finance and Customs developed its first manual for cost–benefit analysis in 1978 (NOU Citation2012). In the late 1990s, economic experts were still discussing whether or not environmental goods should be included in cost–benefit analysis (NOU Citation1997), but since then, increasingly many environmental goods have been assigned a monetary value for the purpose of cost–benefit analysis. Norwegian policymakers and bureaucrats frequently order evaluations and assessments including cost–benefit analysis to support decision-making processes, and cost–benefit analysis has even become compulsory prior to large public investments. Some cost–benefit analysts work in the public sector in Norway, but private companies regularly conduct analysis on behalf of public actors since the production of cost–benefit reports demands substantial resources for short periods of time. Interestingly, some studies have shown that economic advice based on cost–benefit analysis reports are often irrelevant to policy debates and practical policy (e.g. Sager Citation2016, Office of the Auditor General Citation2018); nevertheless, cost–benefit analysis is a far-reaching system, and substantial resources are put into turning the wheels of that system. As cost–benefit analysis studies have pushed economic thinking into public debates (Persky Citation2001), their conclusions set the agenda and shape our ‘cognitive infrastructure’ (Hirschman and Berman Citation2014) by formulating problem descriptions and solutions. The power of economic valuations of nature cannot be ignored in the study of environmental issues, hence further enquiries into the inner workings of cost–benefit analysis are called for.
Expressing the cost of greenhouse gas emissions
Cost–benefit analysis accounts for greenhouse gas emissions in monetary equivalents of ‘social costs’ – costs that denote changes in human well-being, also referred to as ‘utility’ (OECD Citation2018) – when it evaluates the public utility lost or gained by a planned action (Porter Citation1996). Based on an assumption that the market is a device for the evaluation of goods (Callon and Muniesa Citation2005), cost–benefit analysis steps in because the market is unable to evaluate all the goods that exist. In cases of market failure, the goods of public utility have simply been overlooked, and cost–benefit analysis puts a price on these ‘externalities’ and strives to make them visible and calculable (Callon Citation1998). In addition to increased greenhouse gas emissions, examples of such implicit costs are air pollution, accidents, noise and loss of time. ‘Benefits’ are in this context understood as reduced costs. Avoiding social costs does not necessarily give a financial return in the ‘real’ market but provides an opportunity for the transport sector to ‘summarize, reassemble, simplify and rank’ (Latour Citation1987) multiple potential actions.
To the cost–benefit analyst, a unit value is an important input for a mathematical formula (Muniesa Citation2007, Stark Citation2011, Cooper Citation2015), and if she aims to calculate the social costs caused by greenhouse gas emissions, she will need a carbon price. What all carbon prices share is that they express the cost of carbon by linking one parameter – one tonne or kilogram of CO2-eq – to another parameter, a monetary value. A carbon price is sometimes expressed in a specific unit mainly readable to the trained eye, for example, as ‘€/tCO2e’ (Point Carbon Citation2009b), or ‘US$/tCO2-eq’ (IPCC Citation2007). On one side, is the highly standardized entity that is money, and on the other, a parameter for greenhouse gases that has been shaped in other commensuration processes in carbon accounting, including efforts to classify, measure, monitor, report and verify emissions (Liu Citation2017, p. 525).Footnote6 A carbon price's universal ‘exchange rate’ makes it possible for analysts conducting cost–benefit analysis to pick a carbon price from many different sources. Yet, the parameter of the unit value which is the monetary value must contain a specific figure. The question then becomes what that monetary value should be.
Until a few years ago, cost–benefit reports produced in the transport sector used different carbon prices in their calculations. When conducting cost–benefit analysis, analysts traditionally make sure to adhere to a directive published by the Norwegian Ministry of Finance; in 2015, the Ministry was expected to provide guidelines for the inclusion of greenhouse gas emissions, but was not able to (Volden Citation2013, Norwegian National Rail Administration Citation2015). This implies that analysts and authors of cost–benefit analysis manuals have had to find their carbon price elsewhere. Cost–benefit analysts do not invent a carbon price themselves, but often pick it from manuals that, in a like manner, have picked it from somewhere else. Several Norwegian economists have written books and reports discussing different carbon prices and their suitability for cost–benefit analysis (e.g. NOU Citation2012, Volden Citation2013, Bye Citation2016). In general, questions of monetary valuation in cost–benefit analysis are addressed with a small number of approaches and techniques (Boudia Citation2016), and the list of available carbon prices to choose from only provides a limited number of options. There follows an account of some of the contexts from which cost–benefit analysis may pick its carbon price, and regulation is a suitable place to start.
A carbon tax is considered to be an expression of a government's preferred carbon price by many economists, and in Norway, carbon taxes are sometimes used to state the carbon price in cost–benefit analysis. Even though this changed a couple of years after 2019, in the period of this study, the tax only provided one single figure – a flat rate. A flat rate was a downside to the price because cost–benefit analysts prefer a price path that increases over time, based on an assumption that future generations will consider the cost of greenhouse gas emissions to be higher than we do today. This process of increasing the price path is called discounting and is one of the key principles in environmental economics.Footnote7 Cost–benefit analysts can also pick their carbon price from the actual carbon markets. About half of Norwegian greenhouse gas emissions are regulated by the European Union Emissions Trading Scheme (EU ETS),Footnote8 where the carbon price during 2019 peaked at EUR 30 (Trading Economics Citation2021) – about 300 NOKFootnote9 – a price that has been suggested for cost–benefit analysis, but is rarely (if ever) used, partly because it only offers a flat rate.
Economists sometimes use what they call ‘valuation techniques’ in order to place a price on social costs, and one of these techniques sets out to identify a group of individuals’ ‘willingness to pay’ (WTP). The term WTP is an expression of individuals’ personal willingness to pay for the avoided damages of climate change, and this willingness is either measured explicitly or implicitly in, for example, surveys or observational studies. However, to imagine the long-term effects of greenhouse gas emissions has proven to be demanding for people, and such estimates are rarely (if ever) used in Norway. Another approach to determine the cost of climate inaction, and the losses it causes and will cause, is to present estimates on quantifiable damage. Quantifying such loss is about assessing what the damage of climate change might hypothetically cost society if it is not avoided. The winner of the 2018 Nobel Memorial Prize in Economic Sciences, William Nordhaus, has made efforts at such an approach, providing estimates for what is often called ‘the social cost of carbon’ (Nordhaus Citation2017). Critics argue that Nordhaus’ price is too low. In Norway, the damage related to climate change is generally seen as uncertain, complex and very difficult to quantify (NOU Citation2012), and the social cost of carbon is still rarely (if ever) used as a carbon price in cost–benefit analysis in Norway.
Compared to the examples already mentioned, considerably higher carbon prices have been presented in the context of climate research and climate policy advice. Here, the method has been to calculate the cost of greenhouse gas emissions by finding the carbon price required to comply with certain climate mitigation targets, and estimating the expense required to motivate a sufficient number of actors to choose alternative zero- and low-emissions solutions. Carbon price estimates based on global targets are very diverse (Bye Citation2016). In Norway, economists have estimated a carbon price based on national targets, and in 2010, the cost associated with achieving such national targets within Norwegian borders was estimated as at least 1,500 NOK (EUR 150) per tonne CO2-eq (Fæhn et al. Citation2010). Yet, that figure, which is the highest carbon price among the prices mentioned in this list of examples, seems to have never been considered for cost–benefit analysis. In fact, none of the aforementioned methods for placing a price on greenhouse gas emissions is the method that developed the carbon price that ended up being commonly used in cost–benefit analysis in the Norwegian transport sector. As we shall see in what follows, that carbon price was picked from the context of carbon market forecasting.
Picking the carbon price
Forecasting prices in the carbon market
The carbon price commonly used in cost–benefit analysis in the Norwegian transport sector over a five-year period between 2014 and 2019 can be traced back to a report called ‘Assessment of Future Carbon Prices’ (Norwegian Pollution Control Authority Citation2009). This was a sub-report for Climate Cure 2020, which was a voluminous government report developed when Norwegian policymakers initiated an evaluation of current national climate policy. At that time, assessing future carbon prices was regarded as relevant for climate policy purposes. The Climate Cure 2020 sub-report was edited and published by a government agency called the Norwegian Pollution Control Authority.Footnote10 A group of actors – consisting of representatives from different national directorates and state-owned organizations within the fields of pollution, statistics, energy and transport – contributed to and evaluated its content. In the sub-report, a table () suggested how the carbon market could develop over the next two decades in three different scenarios, each stating a price determined by the year the emission would be accounted for, in low, medium and high scenarios. Importantly, the report expected a carbon price in line with the medium scenario. In a separate section, the authors also mentioned that they expected the carbon price to be at EUR 100 in 2030 (Norwegian Pollution Control Authority Citation2009). The carbon price used in cost–benefit analysis in 2019, ten years later, consisted of the figures linked to the years 2015 and 2020 from the expected medium scenario, plus the 2030 estimate. In the context of cost–benefit analysis, a range of documents point back to the Climate Cure 2020 sub-report when stating the carbon price for cost–benefit analysis, and this is informally referred to as ‘the climate cure price.’ Ever since the sub-report, that carbon price maintained the same monetary values, although it has been interpolated (annually increased) and recalculated to different exchange rates along the way.
Figure 1. Excerpt from Climate Cure 2020 sub-report ‘Assessment of Future Carbon Prices’ (Norwegian Pollution Control Authority 2009). The table is titled ‘Future carbon prices.’ It presents the expected future carbon price in the carbon market for the years 2012, 2015 and 2020 in three scenarios called ‘Low’ (Lav), ‘Medium’ (Middels), and ‘High,’ (Høy) (translated from Norwegian).
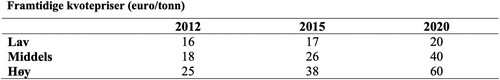
For the purpose of this study, it is relevant to look at where the Climate Cure 2020 sub-report got some of its numbers from. There we find some quite unknown (and to the public, partly undisclosed) documents. The aforementioned Climate Cure 2020 sub-report is mainly based on three studies commissioned by the sub-report's authors: first and foremost, two reports by the consultancy Point Carbon (Point Carbon Citation2009a, Citation2009b) which were authored by a political scientist and a chemical engineer, and second, a report by the state-owned entity Statistics Norway (Citation2009), authored by two economists. In both reports, the analysts estimated carbon prices in 2012, 2015 and 2020 in three scenarios, some of which were presented as the ‘most probable.’ With one exception,Footnote11 the ‘medium’ scenario in the table from the Climate Cure 2020 sub-report consists of several carbon prices from the ‘probable’ scenarios in the Point Carbon and Statistics Norway reports, more specifically the estimate for 2015 (Point Carbon) and 2020 (Point Carbon and Statistics Norway). The Climate Cure 2020 sub-report especially emphasized the carbon price expected in 2020, which it had picked from both the Point Carbon and Statistics Norway reports. Both of these reports considered EUR 40 to be the most probable carbon price in 2020, yet the interviewed analysts behind the forecast-estimates consider it ‘a mere coincidence’ that they landed on the same figure.Footnote12 As we have seen, the Climate Cure 2020 sub-report also mentioned a carbon price for 2030, which was picked from one of Point Carbon's reports on that very topic.
The analysts at Point Carbon and Statistics Norway were handed a challenging task that they solved with the best tools they had at hand, but ten years later these analysts regarded their forecasts of ten years ago as deeply optimistic given that the aforementioned ‘probable’ carbon price estimates had been too high compared to actual development in the carbon market.Footnote13 Nevertheless, such ‘inaccuracies’ were of little importance to the people actively using the carbon price in cost–benefit analysis ten years later. If anything, the carbon price has been criticized for being too low, not too high. In other words, when the carbon price was able to detach from the carbon market forecasts in which it was partly prefigured, it managed to move beyond the purpose to which it was previously linked ‘without taking with it the whole calculative apparatus’ (Callon and Muniesa Citation2005, p. 1231). Just as climate scientists did not create carbon dioxide equivalents to assist in the financialization of the global atmosphere (Cooper Citation2015), neither did the previously discussed analysts create, in 2009, carbon market forecasts to assist cost–benefit analysis ten years later. However, the moment these actors formulated a carbon price, they created something that would take on a life of its own.
Entering into cost–benefit analysis
An important reason why the Climate Cure 2020 sub-report became the most commonly used source of the carbon price in cost–benefit analysis in the transport sector, is that it was picked up by the manuals of different government agencies.Footnote14 All the government agencies in the transport sector publish their own manual for cost–benefit analysis, and whenever someone in the transport sector conducts such analysis, these detailed manuals provide necessary guidance. The most influential manual of all is published by the Norwegian Public Roads Administration, a government agency that is in charge of all state roads and ferry connections in Norway. The Norwegian Public Roads Administration has a long tradition of producing manuals for cost–benefit analysis, and the agency even has its own tool for conducting cost–benefit analysis, the computer programme ‘EFFEKT’ (translated ‘effect’) which has been in use since the 1990s. As early as 2006, the manual published by the Norwegian Public Roads Administration (Citation2006) stated a monetary value for greenhouse gas emissions, but in 2014, this single figure was replaced with the carbon price that is traced in this article. Picking the figures from the Climate Cure 2020 sub-report made the Norwegian Public Roads Administration able to replace a flat rate with a carbon price that increases year by year, which is more in line with the cost–benefit analysis principle of discounting. Hence, the price was especially useful due to its form. Also, the Climate Cure 2020 sub-report presented the carbon price as a result of a cross-sectorial collaboration, which signalled a sense of consensus, and it was therefore perceived to be ‘an official document that marked it [the given carbon price] as an acceptable price.’Footnote15 Lastly, experts hired by the Norwegian government had, a few months before, argued in an Official Norwegian Report (NOU) that such forecasts could provide a suitable carbon price for cost–benefit analysis (NOU Citation2009), something which was repeated in the Climate Cure 2020 sub-report itself. In other words, several actors seemed to already have accepted a shared responsibility for promoting the price.
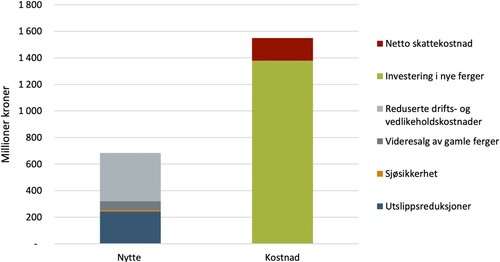
In the Norwegian Public Roads Administration manual, the carbon price is presented in a formalized step table () providing monetary values for the years 2015, 2020 and 2030 (Norwegian Public Roads Administration Citation2018). This excerpt from the manual shows how the carbon price truly has become one single entity, presented as a ‘closed, obvious, firm and packaged premise’ (Latour Citation1987). The ‘low’ ‘medium’ and ‘high’ scenarios are gone, and a single scenario presents the ‘climate cure price’ in one single composition. From this step table, the carbon price has frequently travelled into actual cost–benefit analysis reports. How does this carbon price work in action? In 2017 a private consultancy produced a report commissioned by the Norwegian Maritime Administration (Menon Citation2017). The purpose of the report was to evaluate the potential effects of regulations that would force a phase-out of old ferries and replace them with new ones by the year 2032. In the report, the economists compared the expected investment costs and social costs, including those involved in replacing the old ferries with new and more energy-efficient ferries that emit less carbon dioxide. The authors presented the carbon price in a neat table that, interpolated and adjusted to the correct exchange rate, corresponded with its reference: the table in the Norwegian Public Roads Administration's manual. By stating the expected tonnes of CO2-eq reduced and multiplying them by the carbon price, the economists calculated that the CO2-eq emission reduction resulting from replacing old ferries would be worth 50 million NOK in avoided social costs – a considerable amount of money, one might say. However, even after other avoided social costs had been added to the total, such as ‘loss of life’ and ‘damage to health,’ the benefits did not outweigh the investment costs. Hence, this specific report concluded that replacing old ferries with new ones would not be adequately beneficial for society, which is illustrated in the excerpt from their report (). The report was handed to the Norwegian Maritime Administration, who was clearly considering such replacements. It remains to be seen whether or not they implement changes by 2032.
Figure 2. Excerpt from the Norwegian Public Roads Administration's manual, Table 5–39 (Norwegian Public Roads Administration Citation2018). The step table presents monetary values on the left under the heading ‘Norwegian Krone/tonne CO2-equivalent’ for the years 2015, 2020 and 2030 on the right under the heading ‘Year’ (translated from Norwegian).

Figure 3. 3 Excerpt from the cost-benefit report (Menon Citation2017). This is a bar chart with the title ‘Measure B: Phase-out by 2032’. ‘Benefits’ (Nytte) are represented by the left bar, and ‘Costs’ (Kostnad) are represented by the right bar. Listed on the right, are the investment costs ‘Net tax cost’ (Netto skattekostnad) and ‘Investment in new ferries’ (Investering i nye ferger), and the social benefits ‘Reduced operational costs and maintenance cost’ (Reduserte drifts- og vedlikeholdskostnader), ‘Resale of old ferries’ (Videresalg av gamle ferger), ‘Water safety’ (Sjøsikkerhet) and ‘Emission reductions’ (Utslippsreduksjoner) (translated from Norwegian).
Resisting critique by distributing accountability
Both Norwegian and international scholars have noted that calculations on greenhouse gas emissions rarely add up in favour of action when weighted against other interests (Randalls Citation2011, Welde et al. Citation2013, Yearley Citation2018).Footnote16 If we look to Sweden, which is a comparable country to Norway due to similar methods of cost–benefit analysis (Welde et al. Citation2013), people working in the transport sector report that despite a remarkably high carbon price due to a recent increase of 600% in 2020 (Swedish Transport Administration Citation2018, Swedish Transport Administration Citation2019, Welde et al. Citation2013), the new price will probably not enable the transport sector to meet its climate targets by 2030. Whether or not such lack of ‘environmental impact’ is a problem depends on whether cost–benefit analysis is deemed a strategy for reducing emissions or a strategy to take the effects of emissions into account, as Asdal (Citation2008, p. 129) puts it in her study of ‘critical loads’ of pollutants. Some scholars are generally critical towards cost–benefit analysis as a strategy, including Steven Yearley (Citation2018), who warns against expressing the value of environmental goods in monetary terms because it involves accepting the risk that other monetary values may ‘exceed the value of ecosystems’ (Citation2018, p. 152).Footnote17 This study rather focuses on the critique that the carbon price has received from economists who do see cost–benefit analysis as a potential strategy for reducing greenhouse gas emissions, and who believe that increasing carbon's monetary value will solve the problem of lacking environmental impact.
The carbon price traced in this study has been subject to critique from economists who claim that the carbon price is too low. These critics have questioned how the Norwegian transport sector can aim to cut greenhouse gas emissions in half by 2030, while at the same time using a carbon price that is unable to tip cost–benefit analysis in favour of projects in line with these mitigation targets. Critique has not been directed at one particular actor, and no single human or institution has yet been held accountable for the monetary values of this particular carbon price being too low. Would it be reasonable to demand that the analysts from Statistics Norway and Point Carbon answer for why their estimates from 2009 were included in cost–benefit analysis ten years later? Probably not. Neither can the authors of the Climate Cure 2020 sub-report take full responsibility for the carbon price because their job was merely to make a carbon market forecast; their report simply indicated that the carbon price could be used in cost–benefit analysis. Likely, the authors of the cost–benefit analysis manuals in the transport sector simply acted upon this encouragement from Climate Cure 2020 and other experts. Accountability has been distributed.
Nevertheless, how did the carbon price resist being replaced, despite critique? When interviewed in 2018 and 2019, some economists who work with cost–benefit analysis were sceptical as regards to setting a new carbon price because there is insufficient information on the social cost of greenhouse gas emissions. They believe it is better to leave the valuation to the politicians.Footnote18 According to one interviewee, a common hypothesis among civil servants as to why the Ministry was not able to decide upon a new carbon price, which they set out to do in 2015, was that they realized it would be ‘too political’ to point to a specific price.Footnote19 These repeated references to politics mean that placing a price on the social cost of greenhouse gas emissions is controversial compared to determining other social costs. Given a general disagreement on what a suitable carbon price is, government institutions have been reluctant to explicitly formulate new carbon prices meant for cost–benefit analysis. If the Ministry of Finance had explicitly pointed to a carbon price – a price that most probably would have replaced all the carbon prices currently used in cost–benefit analysis – the Ministry could also have been held accountable for it.
Another reason why this carbon price resisted pressure, despite critique, was because of an important guiding principle of economics that makes the carbon price difficult to replace. Sticking with the same price instead of replacing it ensures something essential to cost–benefit analysis, which is comparability. To illustrate with an example: if a policymaker juxtaposes two cost–benefit reports mapping out two different transport projects, these should be comparable in terms of the social cost. For this reason, some argue that it is better to use a carbon price that is consistent, but inaccurate, rather than different ones.Footnote20 As one interviewee said, ‘once a figure has been put to use, then more people will use that figure.’Footnote21 According to another interviewee, it would have been easier to introduce a new price if the current carbon price was not already in use.Footnote22 The moment a carbon price has managed to get picked, it increases its chance of being picked all over again, aided by the calculative device that is the principles of economics. In this case, a resistance against critique was achieved through practices of picking and the distribution of accountability.
Conclusions
As I have traced the ‘material movement’ (Callon and Muniesa Citation2005) of a particular carbon price, one that consists of several prices per tonne CO2-eq connected to particular years, it has become apparent that carbon prices do not travel into cost–benefit analysis following standardized procedures. Nor did this carbon price become the most commonly used carbon price in cost–benefit analysis in the Norwegian transport sector because one grand puppet master was pulling the strings to move the carbon price a certain way; instead, this adoption is perceived to be a coincidence. Seeking to understand this ‘coincidence,’ I have enquired into how this particular carbon price was increasingly formalized and stabilized, aiming to supplement discussions about what prices are and do by understanding the valuation work that enables their circulation (Helgesson and Muniesa Citation2013). This study has looked beyond the meaning of prices to the technologies that sustain the price system, and thus adds to studies showing that prices are made possible and visible through the frameworks of economization (Çalışkan Citation2010, p. 24, Fourcade Citation2011a, Citation2011b).
When the particular carbon price that is traced in this study travelled into cost–benefit analysis in the transport sector, a range of conditions enabled it to do so. First, the alternative options available had been narrowed down. From the outset, a monetary value that denotes the social cost of greenhouse gas emissions could be just about any figure imaginable, but the guiding principles of carbon economics has established that it needs to have a particular form. Only a small collective of carbon prices, linked to the same unit value, are seen as potential inputs for cost–benefit analysis, something which automatically limits the options available to be picked. Second, in this case the different options available, in which monetary values already had been accounted for, were compared in terms of their legitimacy. The particular carbon price traced in this study travelled from a context of forecasting where influential actors had legitimized the price, making it possible for the carbon price to detach. Third, this particular carbon price complied with certain guiding principles of economics; the concern for discounting made this carbon price especially suitable since it includes estimates of several future prices, and the concern for comparability made it resistant once it had been picked. Together, the assessments that deemed this carbon price suitable for cost–benefit analysis went far beyond inspecting the carbon price's monetary values.
This article contributes to studies of the economization of greenhouse gas emissions in the underexplored context of cost–benefit analysis. The study has revealed some of the dynamics of cost–benefit analysis, which in its search for input to calculations has established price picking as a common practice. On a more general note, this study has revealed some of the mechanisms at work when ‘intangible’ (Chiapello and Engels Citation2021) and debated greenhouse gas emissions are assigned monetary value; as policy makers currently consider introducing or making changes in carbon taxes, subsidizing renewable energy investments, or intervening in carbon markets, existing carbon prices and principles of economics are prepared to guide the process. Reassembling the travels of this carbon price, I have found that the carbon price is – similarly to what Çalışkan (Citation2007) finds in his work on price realization – ‘made’ by a multiplicity of actors that includes calculative devices themselves.Footnote23 I propose to research carbon pricing, and economization in general, as processes of distributing accountability.
Practices such as that of assigning a price to environmental factors are not just technical practices, but are moral and political at their very core (Espeland Citation2001), and that is especially evident in the case of carbon prices. A carbon price in many ways encapsulates one of humanity's greatest challenges and most discussed topics: greenhouse gas emissions and the consequences of these emissions. No wonder, perhaps, that people struggle to agree upon suitable carbon prices in a great many contexts. This wide-spread controversy makes it particularly interesting that one carbon price managed to become agreed upon for a time – the carbon price in the context of cost–benefit analysis in the Norwegian transport sector.Footnote24 Neyland and Woolgar (Citation2002) state that some practical actions are more accountable than others, and I would argue that price picking is among the less accountable ones. Even though the carbon price traced in this study has been modified, simplified and formalized, actors have been able to use the price without taking full accountability for it upon themselves. Price picking is a specific kind of valuation strategy that is especially useful in contexts handling controversial topics such as climate change. Despite common assumptions, economists do not necessarily challenge the conclusion that a price is always socially and culturally embedded (Çalışkan Citation2007). Price picking, as it shifts and distributes accountability, is both an expression of, and a response to, price realization being both a moral and political practice.
Acknowledgements
The author wishes to thank Susanne Bauer, Béatrice Cointe, Knut Einar Rosendahl and Sylvia Irene Lysgård for their comments to previous versions of this paper. Many thanks to the journal editors and two anonymous reviewers for their valuable feedback.
Disclosure statement
No potential conflict of interest was reported by the author.
Additional information
Notes on contributors
Irene Øvstebø Tvedten
Irene Øvstebø Tvedten is a PhD Research Fellow in science and technology studies (STS) at the TIK Centre for Technology, Innovation and Culture at the University of Oslo, Norway.
Notes
1 Interview 8 November 2018 and interview 15 November 2018. Translated from Norwegian.
2 Interview 9 November 2018. Translated from Norwegian.
3 This includes the company Avinor (aviation), the Public Roads Administration (road transport), the Norwegian Railway Directorate (railway) and the Norwegian Coastal Administration (shipping).
4 Latour (Citation1987) calls these ‘immutable mobiles.’ Years later, Howlett and Morgan (Citation2010) called similar entities ‘travelling facts.’
5 Since the Statistics Norway report has only two authors, the interviewee wishes the article to specify his full name, Bjart Holtsmark, in order to avoid confusion.
6 For more literature on carbon accounting, see MacKenzie (Citation2009) and Ormond and Goodman (Citation2015).
7 For more literature on discounting, see Doganova (Citation2018).
8 Aviation is the only Norwegian mode of transport regulated by the EU ETS.
9 NOK stands for Norwegian Krone.
10 Today it is called the Norwegian Environment Agency.
11 The carbon price for 2015 was calculated as a gradual increase from 2012 to 2030. The 2012 estimate is based on the Climate Cure 2020 authors’ own assessment, but it only differs from Point Carbon's estimate by EUR 1.
12 Interview 8 November 2018 and Interview 15 November 2018. Translated from Norwegian.
13 In February 2021, the carbon price climbed above EUR 40 for the first time (Trading Economics Citation2021), indicating that the ‘probable’ scenarios were more accurate than first assumed when interviews were conducted in 2018.
14 This includes the Norwegian National Rail Administration (Citation2015), which provides the carbon price with reference to Climate Cure 2020 in their manual. The Norwegian Coastal Administration used the carbon price from Climate Cure 2020 in their manual draft as of January 2019, and in the manual published in 2020 (Norwegian Coastal Administration Citation2020).
15 Interview 26 November 2018. Translated from Norwegian.
16 In a special issue in the Journal of Cultural Economy, several articles argue and exemplify how the commodification of environmental impacts often fails to deliver the environmental promises (Chiapello and Engels Citation2021).
17 In a critical account of cost-benefit analysis, STS researcher Soraya Boudia (Citation2016) has noted that cost-benefit analysis, by definition, encourages over-exploitation of recourses.
18 Interview 9 November 2018. Translated from Norwegian.
19 Interview 23 January 2019. Translated from Norwegian.
20 Interview 9 November 2018. Translated from Norwegian.
21 Interview 21 January 2019. Translated from Norwegian.
22 Interview 23 January 2019. Translated from Norwegian.
23 In the work of Çalışkan (Citation2010), price realization depends on devices and equipment he calls ‘prostheses,’ and the deployment of this equipment results in ‘prosthetic prices.’
24 The scope of this study is limited to a particular carbon price and the years 2009–2019. In 2021, the Public Roads Administration revised its manual for cost-benefit analysis and suggested a carbon price at 1500 NOK in 2020 with an annual increase of 4%. An avenue for future research could be to study how this new carbon price came about.
References
- Amelang, K. and Bauer, S., 2019. Following the algorithm: how epidemiological risk-scores do accountability. Social Studies of Science, 49, 476–502.
- Asdal, K., 2008. Enacting things through numbers: taking nature into account/ing. Geoforum; Journal of Physical, Human, and Regional Geosciences, 39, 123–132.
- Asdal, K., 2014. From climate issue to oil issue: offices of public administration, versions of economics, and the ordinary technologies of politics. Environment and Planning A, 46, 2110–2124.
- Boudia, S., 2016. Des instruments pour mettre en économie l’environnement. L’économicisation par approximation et occultation. . Ecologie & Politique, 52, 45–61.
- Bowker, G.C. and Star, S.L., 2000. Sorting things out: classification and its consequences. Cambridge, MA: MIT Press.
- Bye, B., ed., 2016. Samfunnsøkonomiske kostnader fra utslipp av klimagasser. Trondheim: Ex ante akademisk forlag.
- Çalışkan, K., 2007. Price as a market device: cotton trading in Izmir mercantile exchange. The Sociological Review, 55, 241–260.
- Çalışkan, K., 2010. Market threads: how cotton farmers and traders create a global commodity. Princeton, NJ: Princeton University Press.
- Çalışkan, K. and Callon, M., 2009. Economization, part 1: shifting attention from the economy towards processes of economization. Economy and Society, 38, 369–398.
- Callon, M., 1998. The laws of the markets. Hoboken, NJ: Blackwell Publishers/Sociological Review.
- Callon, M., 2009. Civilizing markets: carbon trading between in vitro and in vivo experiments. Accounting, Organizations and Society, 34, 535–548.
- Callon, M. and Muniesa, F., 2005. Peripheral vision: economic markets as calculative collective devices. Organization Studies, 26, 1229–1250.
- Chiapello, E. and Engels, A., 2021. The fabrication of environmental intangibles as a questionable response to environmental problems. Journal of Cultural Economy, 14, 517–532.
- Cointe B. and Nadaï A., 2018. Feed-in tariffs in the European Union. Progressive Energy Policy. Cham: Palgrave Macmillan.
- Cooper, M.H., 2015. Measure for measure? Commensuration, commodification, and metrology in emissions markets and beyond. Environment and Planning A, 47, 1787–1804.
- Doganova, L., 2018. Discounting the future: a political technology. Economic Sociology_the European Electronic Newsletter, 19, 4–9.
- Dussauge, I., Helgesson, C.-F., and Lee, F., 2015. Value practices in the life sciences and medicine. Oxford, UK: Oxford University Press.
- Ehrenstein, V. and Muniesa, F., 2013. The conditional sink: counterfactual display in the valuation of a carbon offsetting reforestation project. Valuation Studies, 1, 161–188.
- Engels, A. and Wang, C., 2018. The value of a valuation perspective for theorizing about social change and climate change: a study on carbon pricing in China. Valuation Studies, 5, 93–130.
- Espeland, W.N., 2001. Value-matters. Economic and Political Weekly, 36, 1839–1845.
- Espeland, W.N. and Stevens, M.L., 1998. Commensuration as a social process. Annual Review of Sociology, 24, 313–343.
- Fæhn, T., Jacobsen, K., and Strøm, B., 2010. Samfunnsøkonomiske kostnader ved klimamål for 2020. En generell modelltilnærming. Available at: https://www.ssb.no/natur-og-miljo/artikler-og-publikasjoner/samfunnsokonomiske-kostnader-ved-klimamaal-for-2020 [Accessed 15 May 2019].
- Fourcade, M., 2011a. Cents and sensibility: economic valuation and the nature of “nature”. American Journal of Sociology, 116, 1721–1777.
- Fourcade, M., 2011b. Price and prejudice: on economics and the enchantments (and disenchantment) of nature. In: J. Beckert and P. Aspers, eds. The worth of goods: valuation and pricing in the economy. Oxford: Oxford University Press, 41–62.
- Grandclément, C. & Nadaï, A. 2018. Devising the consumer of the competitive electricity market: the mundane meter, the unbundling doctrine, and the re-bundling of choice. Journal of Cultural Economy, 11, 440–457.
- Harvey, P. and Knox, H., 2008. ‘OTHERWISE ENGAGED’: culture, deviance and the quest for connectivity through road construction. Journal of Cultural Economy, 1, 79–92.
- Helgesson, C.-F. and Muniesa, F., 2013. For what it’s worth: an introduction to valuation studies. Valuation Studies, 1, 1–10.
- Hirschman, D. and Berman, E.P., 2014. Do economists make policies? On the political effects of economics. Socio-Economic Review, 12, 779–811.
- Howlett, P. and Morgan, M.S., 2010. How well do facts travel?: The dissemination of reliable knowledge. Cambridge: Cambridge University Press.
- IPCC, 2007. 2007: Agriculture. Climate change 2007: Mitigation. Contribution of working group III to the fourth assessment report of the intergovernmental panel on climate change. Avaliable at: https://www.ipcc.ch/report/ar4/wg3/.
- Latour, B., 1987. Science in action: how to follow scientists and engineers through society. Cambridge, MA: Harvard University Press.
- Latour, B., 2005. Reassembling the social: an introduction to actor-network-theory. Oxford: Clarendon Press.
- Liu, J.C.-E., 2017. Pacifying uncooperative carbon: examining the materiality of the carbon market. Economy and Society, 46, 522–544.
- Livermore, M.A. and Revesz, R.L., 2013. The globalization of cost-benefit analysis in environmental policy. Oxford: Oxford University Press.
- Lohmann, L., 2009. Toward a different debate in environmental accounting: the cases of carbon and cost–benefit. Accounting, Organizations and Society, 34, 499–534.
- MacKenzie, D., 2009. Making things the same: gases, emission rights and the politics of carbon markets. Accounting, Organizations and Society, 34, 440–455.
- Menon, 2017. Samfunnsøkonomisk analyse av utfasing av ferger uten skadestabilitet. Available at: https://www.menon.no/publication/samfunnsokonomisk-analyse-utfasing-ferger-skadestabilitet/ [Accessed 15 May 2019].
- Muniesa, F., 2007. Market technologies and the pragmatics of prices. Economy and Society, 36, 377–395.
- Neyland, D. and Coopmans, C., 2014. Visual accountability. The Sociological Review, 62, 1–23.
- Neyland, D., Ehrenstein, V., and Milyaeva, S., 2018. Mundane market matters: from ordinary to profound and back again. Journal of Cultural Economy, 11, 377–385.
- Neyland, D. and Woolgar, S., 2002. Accountability in action?: The case of a database purchasing decision. The British Journal of Sociology, 53, 259–274.
- Nordhaus, W.D., 2017. Revisiting the social cost of carbon. Proceedings of the National Academy of Sciences, 114, 1518–1523.
- Norwegian Coastal Administration, 2020. Veileder i samfunnsøkonomisk analyse. The Norwegian Maritime Administration. Available at: https://www.kystverket.no/contentassets/92960a15253e427aa60723519d048d1b/veileder-i-samfunnsokonomisk-analyse.pdf/download [Accessed 26 October 2021].
- Norwegian Environment Agency, 2019. Klimagssutslipp fra transport. Available at: https://miljostatus.miljodirektoratet.no/tema/klima/norske-utslipp-av-klimagasser/klimagassutslipp-fra-transport/ [Accessed 10 December 2019].
- Norwegian Ministry of Transport and Communication, 2019. Nasjonal transportplan 2022–2033 – Oppdrag 9: prioriteringer. Available at: https://www.regjeringen.no/contentassets/2ceaece5bb1b405f9b9e183395c722b8/oppdrag-9-25112019.pdf [Accessed 10 December 2019].
- Norwegian National Rail Administration, 2015. Metodehåndbok. Samfunnsøkonomiske analyser for jernbanen 2015. Available at: https://www.jernbanedirektoratet.no/contentassets/f9ed15eb368e4abb9dc6d2f558432135/metodehandbok-2015.pdf [Accessed 24 April 2019].
- Norwegian Pollution Control Authority, 2009. Vurdering av framtidige kvotepriser (Assessment of Future Carbon Prices). Available at: http://www.miljodirektoratet.no/old/klif/publikasjoner/2545/ta2545.pdf [Accessed 10 November 2018].
- Norwegian Public Roads Administration, 2006. Konsekvensanalyser. Håndbok 140. Statens vegvesen. Available at: https://brage.bibsys.no/xmlui/handle/11250/195982 [Accessed 24 April 2019].
- Norwegian Public Roads Administration, 2018. Konsekvensanalyser. Håndbok V712. Statens vegvesen. Available at: https://www.vegvesen.no/fag/veg+og+gate/planlegging/Grunnlagsdata/Konsekvensanalyser [Accessed 24 April 2019].
- NOU, 1997. Nytte-kostnadsanalyser. Prinsipper for lønnsomhetsvurderinger i offentlig sektor. Norwegian Government. Available at: https://www.regjeringen.no/no/dokumenter/nou-1997-27/id116359/ [Accessed 15 May 2019].
- NOU, 2009. Globale miljøutfordringer – norsk politikk. Norwegian Government. Available at: NOU 2009. Globale miljøutfordringer – norsk politikk. [Accessed 15 May 2019].
- NOU, 2012. Samfunnsøkonomiske analyser. Available at: https://www.regjeringen.no/no/dokumenter/nou-2012-16/id700821/?ch=3 [Accessed 15 May 2019].
- OECD, 2018. Cost–benefit analysis and the environment: further developments and policy Use. Paris: OECD, Organisation for Economic Co-operation and Development. doi:https://doi.org/10.1787/9789264085169-en [Accessed 24 April 2019].
- Office of the Auditor General, 2018. Riksrevisjonens undersøkelse av overføring av godstransport fra vei til sjø og bane. Available at: https://www.riksrevisjonen.no/globalassets/rapporter/no-2017-2018/godstransport.pdf [Accessed 24 April 2019].
- Ormond, J. and Goodman, M.K., 2015. A new regime of carbon counting: The practices and politics of accounting for everyday carbon through CO2e. Global Environmental Change, 34, 119–131.
- Pallesen, T., 2016. Valuation struggles over pricing–determining the worth of wind power. Journal of Cultural Economy, 9, 527–540.
- Persky, J., 2001. Cost-benefit analysis and the classical creed. Journal of Economic Perspectives, 15, 199–208.
- Point Carbon, 2009a. European carbon prices in 2030. Norwegian Environment Agency. Unpublished report retrieved from the Norwegian Environment Agency.
- Point Carbon, 2009b. European carbon prices towards 2020. Unpublished report retrieved from the Norwegian Environment Agency.
- Porter, T.M., 1996. Trust in numbers: the pursuit of objectivity in science and public life. Princeton: Princeton University Press.
- Porter, T.M., 2007. The rise of cost–benefit rationality as solution to a political problem of distrust. In: R.O. Zerbe, ed. Research in law and economics. Bingley: Emerald Group Publishing Limited, 337–344.
- Randalls, S., 2011. Optimal climate change: economics and climate science policy histories (from heuristic to normative). Osiris, 26, 224–242.
- Sager, T.Ø., 2016. Why don’t cost-benefit results count for more? The case of Norwegian road investment priorities. Urban, Planning and Transport Research, 4, 101–121.
- Sandmo, A., 2015. The early history of environmental economics. Review of Environmental Economics and Policy, 9, 43–63.
- Shafiee, K., 2019. Cost-benefit analysis at the floodgates: governing democratic futures through the reassembly of Iran’s waterways. Social Studies of Science, 50, 94–120.
- Souza, C.D., 2018. Cost-benefit analysis as democratic ritual: the controversy over a proposed uranium mining and milling project in Virginia (1981–2013). PhD, Virginia State University.
- Stark, D., 2011. What’s valuable? In: J. Beckert and P. Aspers, eds. The worth of goods: valuation and pricing in the economy. Oxford: Oxford University Press, 319–338.
- Statistics Norway, 2009. Vurdering av framtidige klimakvotepriser (Assessment of future carbon prices). Available at: https://www.ssb.no/natur-og-miljo/artikler-og-publikasjoner/vurdering-av-framtidige-klimakvotepriser?fane=om [Accessed 1 November 2019].
- Swedish Transport Administration, 2018. Analysmetod och samhällsekonomiska kalkylvärden för transportsektorn: ASEK 6.1. Available at: https://www.trafikverket.se/contentassets/4b1c1005597d47bda386d81dd3444b24/asek-6.1/asek_6_1_hela_rapporten_180412.pdf [Accessed 10 May 2019].
- Swedish Transport Administration, 2019. Åtgärder för ökad andel godstransporter på järnväg och med fartyg. Redovisning av regeringsuppdrag. Available at: http://trafikverket.diva-portal.org/smash/record.jsf?pid=diva2%3A1352252&dswid=-5497 [Accessed 3 January 2020].
- Trading Economics, 2021. EU carbon permits. Available at: https://tradingeconomics.com/commodity/carbon [Accessed 10 November 2021].
- Volden, G.H., 2013. Bruk av karbonpriser i praktiske samfunnsøkonomiske analyser. En oversikt over praksis fra analyser av statlige investeringsprosjekter under KVU-/KS1-ordningen. NTNU: NTNU. Available at: https://www.ntnu.no/documents/1261860271/1262010703/Concept_rapport_nr_37.pdf [Accessed 15 April 2019].
- Welde, M., et al., 2013. Planprosesser, beregningsverktøy og bruk av nytte-kostnadsanalyser i vegsektor. En sammenligning av praksis i Norge og Sverige. Concept. Available at: https://www.ntnu.no/documents/1261860271/1262010703/Concept_rapport_nr_33.pdf [Accessed 15 April 2019].
- Wiener, J.B., 2013. The diffusion of regulatory oversight. In: M.A. Livermore and R.L. Revesz, eds. The globalization of cost-benefit analysis in environmental policy. Oxford: Oxford University Press, 123–140.
- Yearley, S., 2018. Economic valuation of the environment. In: M.E. Boström and D.J.E. Davidson, eds. Environment and society. Concepts and challenges. London: Palgrave Macmillan, 143–166.