
ABSTRACT
(a) Objective: Obstructive sleep apnea syndrome (OSAS) is typically diagnosed through polysomnography (PSG). However, PSG incurs high medical costs. This study developed new models for screening the risk of moderate-to-severe OSAS (apnea-hypopnea index, AHI ≥15) and severe OSAS (AHI ≥30) in various age groups and sexes by using anthropometric features in the Taiwan population.
(b) Participants: Data were derived from 10,391 northern Taiwan patients who underwent PSG.
(c) Methods: Patients’ characteristics – namely age, sex, body mass index (BMI), neck circumference, and waist circumference – was obtained. To develop an age- and sex-independent model, various approaches – namely logistic regression, k-nearest neighbor, naive Bayes, random forest (RF), and support vector machine – were trained for four groups based on sex and age (men or women; aged <50 or ≥50 years). Dataset was separated independently (training:70%; validation: 10%; testing: 20%) and Cross-validated grid search was applied for model optimization. Models demonstrating the highest overall accuracy in validation outcomes for the four groups were used to predict the testing dataset.
(d) Results: The RF models showed the highest overall accuracy. BMI was the most influential parameter in both types of OSAS severity screening models.
(e) Conclusion: The established models can be applied to screen OSAS risk in the Taiwan population and those with similar craniofacial features.
Introduction
In recent years, obstructive sleep apnea syndrome (OSAS) has become a major health concern globally.Citation1 The estimated prevalence of moderate-to-severe OSAS in the United States was 10% and 17% in men aged 30–49 and 50–70 years, respectively, and 3% and 9% in women aged 30–49 and 50–70 years, respectively.Citation2 OSAS is considered an independent risk factor for many comorbidities including cardiovascular diseases, systemic hypertension, stroke, abnormal glucose metabolism, and even cancer.Citation3,Citation4 Studies have reported correlations between OSAS and brain damage, cognitive impairment, and dementia.Citation5–7 OSAS can thus strongly affect an individual’s quality of life.
In-laboratory polysomnography (PSG) is the standard modality used to determine OSAS severity.Citation8 However, in-laboratory PSG incurs high resource costs because medical personnel are required for continuous sleep monitoring.Citation9 Given the high cost of in-laboratory PSG and the lack of space in sleep laboratories, the waiting list for PSG is usually long; the average waiting time for receiving medical therapy after PSG in the United States is 11.6 months.Citation10 This limited availability causes delays in the diagnosis of sleep disorders.Citation11 To overcome these limitations, the Home Sleep Test (HST) is considered an alternative portable examination for determining OSAS severity. However, the HST has many limitations. For instance, the HST cannot accurately diagnose OSAS if patients have comorbidities.Citation12 Moreover, established clinical guidelines for the HST are not available for patients with a body mass index (BMI) of >40 kg/m2 or for patients aged >65 years.Citation13 Various questionnaires have been developed for screening for OSAS on the basis of clinical prediction rules, including the Berlin Questionnaire, Epworth Sleepiness Scale, and STOP-Bang questionnaire.Citation14 Although these questionnaires have been found to have high sensitivity for OSAS screening, they exhibited low specificity in all severity groups.Citation15 Hence, considering the shortcomings of the current methods used for diagnosing OSAS, a new method for accurately determining the OSAS risk must be developed.
Determining the significant predictors of OSAS severity (e.g., sex) can be beneficial to developing a new examination method. A studyCitation16 reported that the prevalence of OSAS in southern Pennsylvania was nearly three times higher in men than in women. The same study reported that the prevalence of OSAS was significantly higher in postmenopausal women (2.7%) than in premenopausal women (0.6%). Moreover, a higher mean BMI and larger mean neck circumference were observed in patients with severe OSAS (n = 25) than in normal controls (n = 14) in Turkey (BMI = 34.55 vs 29.83 kg/m2, p = .021; neck circumference = 40.84 vs 36.11 cm, p < .001).Citation17 In Turkish adults, the odds ratio for OSAS was 1.09 (95% confidence interval [CI] = 1.014–1.17, p < .05) for each increase of 3.5 cm in neck circumference.Citation18 In a study conducted in Turkey, a significantly larger mean waist circumference was reported in the severe OSAS group (n = 437) than in the control group (n = 72; 111.74 ± 12.47 vs 91.67 ± 12.00 cm, p < .001).Citation19 A study conducted in the United States reported significant associations of the apnea–hypopnea index (AHI) with BMI (r = 0.349, p = .008), neck circumference (r = 0.276, p = .038), and waist circumference (r = 0.459, p < .001) in patients with OSAS (n = 59).Citation20 Although epidemiological studies have reported an association between anthropometric measures and OSAS severity, to the best of the authors’ knowledge, an OSAS risk assessment modality considering the effects of anthropometric data, sex, and age is not yet available. Furthermore, the associations among anthropometric features, alterations in the sleep structure, and disordered sleep indices for different age groups and sexes remain unclear.
The present study hypothesized that body profile, as an indicator of OSAS severity, can be used to assess OSAS risk, including moderate-to-severe OSAS (AHI ≥15) and severe OSAS (AHI ≥30). The primary objective of this study was to develop OSAS risk screening models for various age and sex groups on the basis of body profile. These models were developed using various machine learning methods: logistic regression (LR), k-nearest neighbor (kNN), naive Bayes (NB), random forest (RF), and support vector machine (SVM). Furthermore, this study investigated the effects of anthropometric features on sleep stage alterations and disordered sleep indices in various age and sex groups by using the regression model. The paper is organized as follows. Section 2 describes the collection of the dataset, analysis of statistical data, and establishment of the screening model. Section 3 presents the baseline characteristics of patients, statistical outcomes of body profile and PSG parameters, and classification performance of the trained model. Section 4 discusses the results and compares the findings of the present study with those of other studies. Section 5 concludes the paper.
Methods
Ethics
The study protocol was approved by the Ethics Committee of the Taipei Medical University–Joint Institutional Review Board (Shuang Ho Hospital [SHH] approval no: N201911007). The examination institution (Sleep Center of SHH) was qualified by the Taiwan Society of Sleep Medicine. Experiments were conducted in accordance with approved guidelines.
Study population
This study included patients who underwent PSG for the assessment of OSAS severity in the Sleep Center of Taipei Medical University SHH (New Taipei City, Taiwan) between March 2015 and Jan 2021. This study included patients who were aged between 18 and 90 years, did not undergo any invasive surgery for OSAS treatment, did not regularly use hypnotic or psychotropic medications, and had a total PSG recording time of more than 6 hours. A baseline screening questionnaire was administered to record age, sex, BMI, neck circumference, and waist circumference. In addition, information regarding the usage of medication and surgical history of each patient was obtained from their clinical registration data. All participants were Taiwan population, and craniofacial features are considered to be more strongly related to OSAS severity in those of Han ethnicity compared with people of other ethnicities.Citation21 However, craniofacial features were not used as predictors because only patients in northern Taiwan were recruited in this study.
PSG
Full-night PSG examinations were performed using ResMed Embla N7000 (ResMed Corp., San Diego, CA, USA) and Embla MPR (Natus Medical, Pleasanton, CA, USA) in the SHH Sleep Center. The following data were recorded during PSG: electroencephalography, electrooculography, chin and leg electromyography, electrocardiography, nasal and oral airflow, thoracic and abdominal bands, snoring patterns, body position, and oxygen saturation. These data were scored by certified polysomnographic technologists by using RemLogic software (version 3.41, Embla, Thornton, CO, USA). Sleep stages and respiratory events were scored using the American Academy of Sleep Medicine Scoring Manual 2017.Citation22 Diagnosis of OSAS was based on the frequency of apnea and hypopnea events.Citation23 The AHI for each patient was calculated as the total number of apnea and hypopnea events divided by the total sleeping time. In accordance with clinical practice, patients were recommended to undergo an active intervention when their AHI was higher than 15 times per hour, which is the clinical threshold for moderate-to-severe OSAS.Citation24 Patients whose AHI was higher than 30 times per hour were strongly recommended to receive a curative intervention.Citation25 Therefore, in this study, for the first type of models, patients were divided into two groups to examine the risk of moderate-to-severe OSA: those with an AHI ≥15 and those with an AHI <15. Next, to establish the model for screening the risk of severe OSAS, patients were divided into severe and non-severe OSAS (AHI ≥ 30 and AHI < 30, respectively) groups.Citation26
Statistical analysis
All statistical analyses were performed using the open-source Python statistics module Scikit-learn (version 0.21.2).Citation27 The PSG data of patients recruited in this study on the basis of the inclusion criteria were divided into two groups according to sex. The characteristics of the two groups were compared using the independent Student’s t-test for continuous variables or the chi-square test for categorical variables. To determine the correlations among anthropometric features, sleep structure alterations, and disordered sleep indices considering the effects of sex and menopause, the male and female groups were further divided into groups according to their age (>50 years and ≤50 years).Citation28 Linear regression models were used to examine the associations of body profile with PSG parameters among the four groups. The level of significance was set at p < .05.
Machine learning approaches
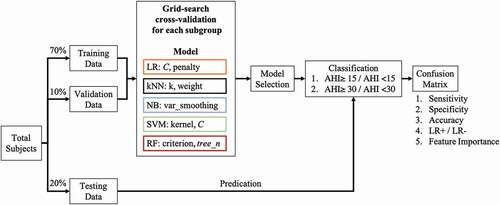
Studies have used classification methods, such as the genetic algorithmCitation29 and SVM,Citation30 to predict OSAS severity. In this study, various prediction models – namely LR, kNN, NB, RF, and SVM – were used, and their classification performance was compared. The procedure used for training, validating, and testing the models is illustrated in . In this study, 70%, 10%, and 20% of the PSG data of the four groups were used as training, validation, and testing datasets, respectively. In the training and validation stages, to determine the optimal classifier of each machine learning approach, the grid search cross-validation was applied to test the various parameters settings.Citation31 In more detail, the various inverse values of regularization (C, from 10–Citation5 to 105) and different penalty strategies (Lasso or Ridge regression) were combined and tested for determining the parameters of the logistic regression model with the highest accuracy. For the kNN model, the k value (ranging from 2 to 5) and weight type (uniform or distance) were combinedly tested to determine the parameters for constructing the highest valuation accuracy model. Next, the portion of the largest variance of all features for NB (var_smoothing, from 10−9 to 109) was tested to determine the values that exhibited the highest accuracy. For the SVM, various kernel types (linear, polynomial, and radial basis function) and regularization values (C, between 10−3 and 103) were combined and tested. In terms of the RF, the different criterion (Gini index or entropy) and the number of classification and regression trees in RF (tree_n, set as 500, 800, 1000, and 1200) were combinedly tested. In addition, the RF model was trained using the bootstrap technique.Citation32 For each established model, the accuracy of cross-validation results for the four groups was obtained. The machine learning approach that exhibited the highest overall accuracy was selected for predicting the testing data, and its feature importance was discussed.
Figure 1. Training Process with Grid Search Cross-Validation. Various machine learning models were trained using grid search cross-validation with subject-independent validation data for preventing overfitting. The overall accuracy of models for four age groups and sex groups was determined. The model exhibiting the highest performance was used to predict the testing data, and parameter importance was examined.
Accuracy evaluation
On completion of the training process, the testing dataset was input into the selected model to examine the model’s sensitivity, specificity, and accuracy for each group. The confusion matrix, which is a measurement of the performance of classification, was computed. True-positive (TP), true-negative (TN), false-positive (FP), and false-negative (FN) values were calculated. In addition, several indices, namely sensitivity (TP/[TP + FN]), specificity (TN/[TP + FN]), and accuracy ([TP + TN]/[TP + TN + FP + FN]), were calculated to validate the accuracy of the trained model. The receiver operating characteristic (ROC) curve was plotted to determine the optimal point, which served as the point most balanced between sensitivity and specificity. The area under the ROC curve (AUC) was calculated to determine the separability of the model. The closer this value was to 1, the better was the separability of the model. Additionally, DeLong’s test was used to perform the statistical examination among the derived AUCs.Citation33 Furthermore, the positive and negative likelihood ratios were calculated to validate model performance.
Results
Characterization of study patients
A total of 10,391 patients, of whom 69.54% (7226) were men, were enrolled in this study, and their baseline characteristics are listed in . The number of patients with different OSAS severities significantly differed between the male and female groups (p < .01). The average age of patients in the male group (48.01 ± 13.66 years) was significantly lower than that in the female group (51.19 ± 14.05 years; p < .01). Regarding anthropometric features, the mean BMI (27.33 ± 4.67 kg/m2), neck circumference (39.49 ± 4.13 cm), and waist circumference (94.77 ± 11.73 cm) were significantly higher in the male group than in the female group (p < .01).
Table 1. Baseline characteristics of patients according to sex.
PSG results
The mean PSG values of the patients are listed in . The average sleep efficiency (SE) was significantly higher in younger men (80.04% ± 13.71%) than older men (73.59% ± 15.01%; p < .01). Similarly, the average SE was significantly higher in younger women (79.96% ± 13.52%) than in older women (74.73% ± 14.75%; p < .01). The average wake time after sleep onset (WASO) in both sexes was significantly lower in younger patients (men: 51.09 ± 42.85 min and women: 44.88 ± 39.41 min) than in older patients (men: 75.71 ± 47.64 min and female: 65.01 ± 43.54 min; p < .01).
Table 2. PSG results of patients according to sex.
With regard to sleep stages, the mean percentages of the wake stage and of stage one (N1) among younger patients were significantly lower than those in older patients of both sexes (all p < .01). By contrast, younger patients of either sex had significantly higher mean percentages of stage three (N3) and rapid-eye-movement (REM) stages than those of older patients (all p < .01). In addition, the mean percentage of stage two (N2) among younger men was significantly higher than that among older men. Regarding differences in sex and age, the male patients in both the younger and older groups had significantly higher mean percentages of the waking and N1 stages relative to their younger and older female counterparts, respectively (all p < .05). Conversely, the mean percentages of the N2, N3, and REM stages among both younger and older male patients were significantly lower than those among female patients in both the younger and older groups, (all p < .05).
As for the sleep quality indices and the age difference for each sex, the mean values of AHI, oxygen desaturation index ≥3% (ODI-3%), snoring, and arousal index were significantly higher among older female patients than among younger female patients (all p < .01). However, no significant differences between younger and older male patients were observed, except in the arousal index (younger men: 25.51 ± 19.08 events/hour; older men: 27.29 ± 16.78 events/hour, p < .05). As for sex difference at the same age, the younger-adult male patients had significantly higher mean values in all sleep quality indices relative to their younger-adult female counterparts. Additionally, the same significant tendencies were observed between the older male and female patients.
PSG results and anthropometric features
Correlations between PSG parameters and body profile for the various age and sex–stratified groups are presented in (male group) and (female group). Among the male patients, SE was significantly negatively correlated with neck circumference in the younger group and with waist circumference in both age groups. WASO was significantly positively correlated with BMI and with neck and waist circumference in younger men and with waist circumference in older men. Regarding sleep stage and sleep quality indexes, among younger men, BMI and neck and waist circumference were negatively correlated with the mean percentages of N2, N3, and REM, whereas these body profiles were positively correlated with the percentages for the waking and N1 stages and with all sleep quality indexes (all p < .05). Similarly, in the older male group, positive correlations between these three body profiles, the N1 stage, and all the sleep quality indexes were observed, whereas REM and N2 percentage were negatively correlated with the body profiles (all p < .05). In addition, among older men, waist circumference was positively correlated with the wake stage and neck circumference was negatively correlated with the N3 stage (both p < .05).
Table 3. Pearson’s correlation coefficients for PSG variables and anthropometric features in male.
Table 4. Pearson’s correlation coefficients for PSG variables and anthropometric features in female.
Among female patients, SE was negatively correlated with neck circumference (p < .05) in the older group. WASO was positively correlated with BMI and waist circumference in the younger group (p < .05). With regard to the sleep cycle variable, wake percentage was positively correlated with BMI among younger female patients (p < .05). The percentage of the N1 sleep stage was significantly and positively correlated with all body profiles in all female groups, whereas significant negative correlations between N3 and body variables were observed. Additionally, a significant negative correlation was observed between the N2 stage and neck circumference in the older female group. The percentage of the REM sleep stage was negatively correlated with all body profiles among older women (p < .05) and negatively correlated with waist circumference among younger women (p < .05). With regard to sleep quality, AHI, ODI-3%, snoring, and the arousal index were positively correlated with BMI and with neck and waist circumferences in all female groups (all p < .05).
Validation performance of machine learning approaches
Comparison of grid-search cross-validation accuracy of the two OSAS severity types is provided in . For moderate-to-severe OSAS (AHI ≥ 15 or AHI < 15), the RF model exhibited the highest overall accuracy in grid-search cross-validation outcomes among the established models (LR: 72.45% ± 2.70%; kNN: 82.47% ± 2.46%; NB: 73.03% ± 1.82%; SVM: 73.41% ± 2.80%; and RF: 84.59% ± 2.35%). Similarly, regarding the screening of severe OSAS (AHI ≥ 30), the RF model had the highest overall accuracy in grid-search cross-validation results (LR: 68.69% ± 2.92%; kNN: 76.88% ± 2.69%; NB: 69.27% ± 2.91%; SVM: 66.28% ± 2.97%; and RF: 81.50% ± 2.32%).
Table 5. Comparison of the accuracy of screening moderate-to-severe and severe OSAS in grid search cross-validation of models based on groups.
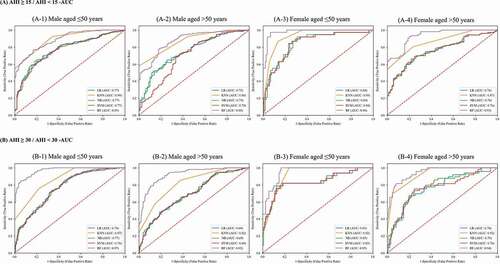
and present the AUC of each machine learning approach of different OSAS severity classifications. The AUC of RF in most of the groups demonstrated the highest values (from 88.73% to 97.88%), except in the young male group of moderate to severe OSA severity. Additionally, significant differences were observed in most comparisons when examining the statistical difference between the AUC values of RF and other machine learning approaches. Therefore, the RF model was used to classify the testing dataset, and the parameter importance of RF was computed by averaging the decrease in impurity for determining the effect of different factors.Citation34–36
Table 6. Comparison of the area under the receiver operating characteristic curve (AUC) of grid search cross-validation outcomes by using various machine learning approaches.
Figure 2. Area Under the Receiver Operating Characteristic Curve (AUC) of Grid Search Cross-Validation Outcomes by using Different Machine Learning Models.
Accuracy performance and parameter importance
The results of the classification and parameter importance for the testing dataset for each age- and sex-independent model are presented in (for moderate-to-severe OSAS) and (for severe OSAS). Among screening models for moderate-to-severe OSAS, the prediction accuracy of the various groups ranged from 73.87% to 76.33%. The AUC of the ROC was between 68.57% (64.78%-72.87%) and 80.86% (77.98%-83.66%). BMI was the most important parameter for the four groups, contributing to 40.77%, 41.50%, 41.99%, and 39.84% of the effect among younger men, older men, younger women, and older women, respectively. Waist circumference was the second-highest contributing factor in screening moderate-to-severe OSAS risk, except in the younger women group (waist circumference: 25.76%, and neck circumference: 32.25%). Regarding severe OSAS screening models, the prediction accuracy for the various groups ranged from 67.17% to 84.10%. The AUC of the ROC ranged from 68.82% (65.21%-72.42%) to 81.24% (73.98%-87.59%). Similar to the moderate-to-severe OSAS model outcomes, the accuracies of older patient models were lower than those of younger patient models. BMI remained the most important parameter in the four groups, contributing to 40.72%, 38.98%, 38.11%, and 38.84% of the effect among younger men, older men, younger women, and older women, respectively. Similar to the moderate-to-severe OSAS screening models, the neck circumference was the second-highest contributing factor (neck circumference: 36.36%, waist circumference: 25.53%) in the younger women group, whereas the contribution of waist circumference in the other three groups was the second-highest and ranged from 34.41% to 36.89%.
Table 7. Classification of the results of the age-dependent body profile in the random forest model for screening moderate-to-severe risk of OSAS for four groups.
Table 8. Classification results of the age-dependent body profile in random forest model for screening severe OSAS risk for four groups.
Discussion
This study examined the association between PSG parameters and anthropometric features while considering the effect of age and sex. Age- and sex-independent models based on anthropometric features were successfully established for examining the risk of moderate-to-severe OSAS (AHI ≥15) and severe OSAS (AHI ≥30). The established models had a high prediction accuracy of screening the OSAS risk for those who had Taiwan population craniofacial features. Crucial anthropometric parameters affecting OSAS severity were determined for each group. In addition, large-scale statistical data including Taiwan population anthropometric feature, sleep stage detail, and PSG result data were obtained.
Regarding model performance, the RF model with optimal parameters from grid search cross-valuation demonstrated the highest overall accuracy compared with the optimal version of other machine learning approaches. Although no direct evidence indicated the superiority of RF over other machine learning approaches, there are some potential reasons for this finding. RF, which is an ensemble learning model, computes results rapidly, has favorable anti-noise ability, has stable performance with high accuracy, and prevents overfitting by using the bootstrap method.Citation37 Therefore, the RF method has been widely used to make diagnoses and for support decision making in the medical field.Citation38,Citation39 In addition, the RF model had higher accuracy for younger patients of both sexes than for older patients. This finding may be attributable to the strong associations between sleep-related and anthropometric parameters in younger patients. In older patients, other potential underlying factors such as medication use, comorbidities, muscle strength, and circadian rhythm alterations may be correlated with OSAS severity. A study conducted in 2013 analyzed the data of 13,742 Americans and reported that considerably higher regression coefficients of BMI and waist circumference were associated with decreased total sleep time in individuals aged between 20 and 39 years.Citation40 Another study indicated that BMI was significantly associated with inadequate sleep in 3682 younger participants (aged between 32 and 49 years) but not in older patients (>50 years).Citation41 The aforementioned results indicate that anthropometric parameters may more strongly affect OSAS severity in younger patients than in older patients.
BMI was the most important in terms of OSA risk for the four groups, and waist circumference had the second-highest importance in terms of their effects on the AHI in men and older women, but their importance differed in younger women. Visceral fat, a type of body fat deposited around internal organs, is related to the AHI and BMI as well as waist circumference are unique indicators of a individuals’ visceral fat distribution.Citation42 In other words, BMI is considerably used to assess the total body fat deposition or excess fat mass, whereas waist circumference can be employed to evaluate abdominal obesity, the amount of central abdominal fat, and metabolic syndrome.Citation43 A study reported the bidirectional associations among OSAS severity, obesity, and metabolic syndrome.Citation44 Moreover, intermittent hypoxia caused by OSAS reduced insulin sensitivity and glucose uptake and stimulated hepatic gluconeogenesis.Citation45 These interactions can worsen metabolic syndrome and lead to visceral fat accumulation. One study observed a significantly high amount of visceral fat, increased levels of inflammatory biomarkers, and insulin resistance in 14 men with obesity and OSAS than in 11 men with obesity but without OSAS.Citation46 By contrast, the presence of a high amount of adipose tissue reduces the lung volume, increasing the mechanical load of ventilatory muscles, and even led to respiratory tract narrowing, resulting in increased OSAS severity.Citation47 Therefore, BMI and waist circumference may be clinically used to screen for the risk of OSAS on the basis of their considerable associations. Similarly, a study reported that BMI may serve as a predictive factor for OSAS severity.Citation48 A related study analyzed data from Chinese participants and suggested that BMI and waist circumference were significant independent determinants of OSAS.Citation49 In the present study, the contribution of factors in the model for younger women exhibited an inconsistent percentage distribution relative to the models for men and older women. These results may be attributed to the menopause effect. This effect may not lead to weight gain directly, but it may be correlated with fat distribution changes. In perimenopause women, increased abdominal adiposity and decreased lean body mass have been observed.Citation50 This change is similar to the fat distribution in men, who tend to develop a higher degree of upper-body obesity.
With regard to neck circumference, which is an indicator of fat distribution in the upper airway, significant correlations were observed between the snoring index and arousal index. Increased neck circumference may lead to narrowing of the upper airway and increase the turbulence of airflow, thereby causing snoring. In addition, the collapsible upper airway and increased upper airway resistance may result in an increase in respiratory effort to maintain ventilation. Increased respiratory effort may stimulate transient arousal and lead to sleep fragmentation. Similar findings have been reported in previous studies. Large neck circumference was indicated as a risk factor for snoring.Citation51 Other studies have demonstrated strong correlations among neck circumference, BMI, and OSAS severity.Citation52,Citation53 However, another similar study reported that waist circumference exhibited a stronger association than neck circumference with OSAS severity over 30 years of follow-up.Citation54
Younger women reported higher overall sleep quality and had lower sleep disorder indices. These results may be attributed to aging-induced collagen loss in the upper airway connective tissue. If neuromuscular tension is decreased, the upper airway is more likely to collapse during sleep. Besides, for older women, decreased hormone levels during menopause can result in increased sleep disorder indexes and affect sleep quality. Similarly, studies have shown that obstruction events and severe OSAS were significantly more likely in older patients.Citation55,Citation56 Regarding sex difference, both younger and older male patients exhibited elevated sleep disorder indexes and poor sleep quality compared with female patients. Although the mechanisms underlying such sex difference are not entirely clear, these differences may result from the tendency of male individuals to have a considerably greater gathering of visceral and hepatic fat.Citation57 A systemic review revealed that the prevalence of OSAS is two- to threefold higher among male than among female individuals worldwide.Citation58 Considered jointly, our findings are consistent with those of previous studies, indicating that the risk of OSAS is affected by age, sex, and body profile.
In the present study, the established models demonstrated adequate accuracy in predicting OSAS severity but only relied on the easily obtained anthropometric parameters. Compared with other recently proposed methods, which used various contacted biosensors to measure physiological singles, such as electrocardiogram data or variation in the blood oxygen level,Citation59 the present proposed model may be more likely applicable in the real-world clinical field when considering the time efficacy. For example, a study developed models by using various machine learning approaches based on single-lead electrocardiogram signals to perform OSAS classification.Citation60 Although high accuracy was documented, the classification methods used may not be applicable to some patients with underlying heart diseases or arrhythmia. Additionally, oxygen saturation during sleep time may serve as the predictor for OSAS severity because that parameter is straightforwardly associated with this sleep disorder.Citation61,Citation62 However, several factors, including incorrect probe placement, contact problems with the probe, and line trouble in the pulse oximetry as well as body movements, may cause artifacts in the oxygen saturation measurement.Citation63 In terms of contactless methods, a recent relevant study proposed craniofacial feature scan combined with machine learning approaches for predicting OSAS severity.Citation64 Those models, trained using continuous facial images (rendering and rotating scans by 45-degree increment), demonstrated appropriate accuracy (67%) in the classification of moderate to severe OSAS. Although craniofacial factors seem to affect the OSAS directly, variation in captured scanning images may considerably cause uncertain precision. Next, the pathology of OSAS is not entirely attributed to craniofacial factors, and factors such as age, sex, and menopause state, may all possibly influence OSAS severity. Collectively, the presently established age- and sex-independent models based on readily obtained anthropometric parameters may serve as a fast-screening method for OSAS severity in clinical practice.
This study has some limitations that should be addressed. First, the dataset used in this study was limited to a Taiwan population, and body variables rather than craniofacial factors were considered despite craniofacial factors being considered predictors of sleep-disordered breathing.Citation65 Moreover, the models are applicable only to individuals with Taiwan population craniofacial factors. Next, according to the clinical standard, PSG is required to determine the AHI for classifying OSAS severity. PSG is still conducted through manual interpretation; because PSG results were scored by various technologists, scoring variability may have affected the accuracy.Citation66 Although data were derived from one sleep center that regularly performed training relating to inter-score consistency, scoring variability may have affected the results. Furthermore, the first night effect, which is a phenomenon occurring on the first night of testing and is characterized by an altered sleep cycle and affected sleep physiology, could also have caused inaccuracy in the PSG results.Citation67 To minimize this effect, some PSG parameters, such as SE, should be employed to rule out patients and rearrange PSG for preventing the bias. Another limitation concerns the lack of information regarding some factors that interact with OSAS. OSAS is recognized as multifactorial sleep-disordered breathing, and factors including smoking, alcohol use, environmental parameters, and menopausal status have been reported to be strongly associated with OSAS.Citation68,Citation69 To understand the effect of lifestyle factors, questionnaires can be used to obtain information regarding personal habits. In addition, OSAS is affected by various diseases.Citation68 Comorbidities can also affect PSG results. Disease-related parameters that are already available from clinical information can be obtained and serve as significant variables in prescreen classification. In future work, a dataset with comprehensive dimensions – including information regarding personal habits, comorbidities, additional anthropometric parameters, and body composition – will be collected for training a novel model.
Conclusion
With OSAS becoming a major health concern globally, this study noted the need for developing a method of measuring OSAS severity because of the limitations of currently available methods. Models for screening moderate-to-severe OSAS risk and severe OSAS risk for various age and sex groups based on body profile were developed using the data of 10,391 patients from Taiwan.
The present results indicate that high BMI, neck circumference, and waist circumference reduced the N2, N3, and REM duration and increased sleep disorder indices and the percentages of wake and N1 stages. Prediction models were established for various sex and age groups by using anthropometric parameters as predictors, and the RF models had high accuracy. Exploration of parameter importance revealed that BMI was the most crucial contributing factor for both women and men, whereas waist circumference was the second-highest contributor (except for younger women).
These prediction models can be used for individuals with the craniofacial features of the Taiwan population.
Availability of Data and Materials
All the data of this study were derived from the Sleep Center of Taipei Medical University Shuang Ho Hospital (New Taipei City, Taiwan) between March 2015 and Jan 2021. Since there was personal information within the dataset, the dataset was not available in the supplement file. Please get in touch with the corresponding author to require the dataset or relevant documents if needed.
Ethics approval and consent to participate
Existing records were used to conduct this retrospective study. All necessary approvals and a waiver of informed consent were obtained from the Ethics Committee of the Taipei Medical University–Joint Institutional Review Board (SHH: N201911007).
Acknowledgments
We would like to thank all participants for their contribution to this research.
Funding
This study was funded by the Ministry of Science and Technology, Taiwan (MOST 108-2634-F-038-003) . The funder had no role in the study design, data collection and analysis, or writing of the manuscript.
Disclosure statement
No potential conflict of interest was reported by the author(s).
Correction Statement
This article has been republished with minor changes. These changes do not impact the academic content of the article.
References
- Gibson GJ. Obstructive sleep apnoea syndrome: underestimated and undertreated. Br Med Bull. 2004;72(1):49–65. PMID: 15798032. doi:10.1093/bmb/ldh044.
- Peppard PE, Young T, Barnet JH, Palta M, Hagen EW, Hla KM. Increased prevalence of sleep-disordered breathing in adults. Am J Epidemiol. 2013;177(9):1006–14. PMID: 23589584 PMCID: PMC3639722. doi:10.1093/aje/kws342.
- Gonzaga C, Bertolami A, Bertolami M, Amodeo C, Calhoun D. Obstructive sleep apnea, hypertension and cardiovascular diseases. J Hum Hypertens. 2015;29(12):705–12. PMID: 25761667. doi:10.1038/jhh.2015.15.
- Brenner R, Kivity S, Peker M, Reinhorn D, Keinan-Boker L, Silverman B, Liphsitz I, Kolitz T, Levy C, Shlomi D, others, et al. Increased risk for cancer in young patients with severe obstructive sleep apnea. Respiration. 2019;97(1):15–23. PMID: 30419556. doi:10.1159/000486577.
- Peter-Derex L, Yammine P, Bastuji H, Croisile B. Sleep and alzheimer’s disease. Sleep Med Rev. 2015;19:29–38. PMID: 24846773. doi:10.1016/j.smrv.2014.03.007.
- Alvarez-Sabin J, Romero O, Delgado P, Quintana M, Santamarina E, Ferre A, Maisterra O, Riba-Llena I, Montaner J, Sampol G., et al. Obstructive sleep apnea and silent cerebral infarction in hypertensive individuals. J Sleep Res. 2018;27(2):232–39. PMID: 28631309. doi:10.1111/jsr.12571.
- Buratti L, Luzzi S, Petrelli C, Baldinelli S, Viticchi G, Provinciali L, Altamura C, Vernieri F, Silvestrini M. Obstructive sleep apnea syndrome: an emerging risk factor for dementia. CNS Neurol Disord Drug Targets. 2016;15(6):678–82. PMID: 27189468. doi:10.2174/1871527315666160518123930.
- Kushida CA, Littner MR, Morgenthaler T, Alessi CA, Bailey D, Coleman J Jr., Friedman L, Hirshkowitz M, Kapen S, Kramer M, others, et al. Practice parameters for the indications for polysomnography and related procedures: an update for 2005. Sleep. 2005;28(4):499–521. PMID: 16171294. doi:10.1093/sleep/28.4.499.
- Ancoli-Israel S, Cole R, Alessi C, Chambers M, Moorcroft W, Pollak CP. The role of actigraphy in the study of sleep and circadian rhythms. Sleep. 2003;26(3):342–92. PMID: 12749557. doi:10.1093/sleep/26.3.342.
- Rotenberg B, George C, Sullivan K, Wong E. Wait times for sleep apnea care in Ontario: a multidisciplinary assessment. Can Respir J. 2010;17(4):170–74. PMID: 20808975 PMCID: PMC2933773. doi:10.1155/2010/420275.
- Stewart SA, Skomro R, Reid J, Penz E, Fenton M, Gjevre J, Cotton D. Improvement in obstructive sleep apnea diagnosis and management wait times: a retrospective analysis of home management pathway for obstructive sleep apnea. Can Respir J. 2015;22(3):167–70. PMID: 25751031 PMCID: PMC4470551. doi:10.1155/2015/516580.
- Collop NA, Anderson WM, Boehlecke B, Claman D, Goldberg R, Gottlieb DJ, Hudgel D, Sateia M, Schwab R. Clinical guidelines for the use of unattended portable monitors in the diagnosis of obstructive sleep apnea in adult patients. J Clin Sleep Med. 2007;3(7):737–47. PMID: 18198809 PMCID: PMC2556918.
- Kundel V, Shah N. Impact of portable sleep testing. Sleep Med Clin. 2017;12(1):137–47. PMID: 28159092 PMCID: PMC5458525. doi:10.1016/j.jsmc.2016.10.006.
- Mirrakhimov AE, Sooronbaev T, Mirrakhimov EM. Prevalence of obstructive sleep apnea in Asian adults: a systematic review of the literature. BMC Pulm Med. 2013;13(1):10. PMID: 23433391 PMCID: PMC3585751. doi:10.1186/1471-2466-13-10.
- El-Sayed IH. Comparison of four sleep questionnaires for screening obstructive sleep apnea. Egyptian Journal of Chest Diseases and Tuberculosis. 2012;61(4):433–41. doi:10.1016/j.ejcdt.2012.07.003.
- Bixler EO, Vgontzas AN, Lin HM, Ten Have T, Rein J, Vela-Bueno A, Kales A. Prevalence of sleep-disordered breathing in women: effects of gender. Am J Respir Crit Care Med. 2001;163(3 Pt 1):608–13. PMID: 11254512. doi:10.1164/ajrccm.163.3.9911064.
- Ahbab S, Ataoglu HE, Tuna M, Karasulu L, Cetin F, Temiz LU, Yenigun M. Neck circumference, metabolic syndrome and obstructive sleep apnea syndrome; evaluation of possible linkage. Med Sci Monit. 2013;19:111–17. PMID: 23403781 PMCID: PMC3628860. doi:10.12659/MSM.883776.
- Onat A, Hergenç G, Yüksel H, Can G, Ayhan E, Kaya Z, Dursunoğlu D. Neck circumference as a measure of central obesity: associations with metabolic syndrome and obstructive sleep apnea syndrome beyond waist circumference. Clinical Nutrition. 2009;28(1):46–51. PMID: 19010573. doi:10.1016/j.clnu.2008.10.006.
- Unal Y, Ozturk DA, Tosun K, Kutlu G. Association between obstructive sleep apnea syndrome and waist-to-height ratio. Sleep and Breathing. 2019;23(2):523–29. PMID: 30238284. doi:10.1007/s11325-018-1725-4.
- Tom C, Roy B, Vig R, Kang DW, Aysola RS, Woo MA, Harper RM, Kumar R. Correlations between waist and neck circumferences and obstructive sleep apnea characteristics. Sleep and Vigilance. 2018;2(2):111–18. PMID: 30637368 PMCID: PMC6326580. doi:10.1007/s41782-018-0041-1.
- Sutherland K, Lee RW, Cistulli PA. Obesity and craniofacial structure as risk factors for obstructive sleep apnoea: impact of ethnicity. Respirology. 2012;17(2):213–22. PMID: 21992683. doi:10.1111/j.1440-1843.2011.02082.x.
- Berry RB, Brooks R, Gamaldo C, Harding SM, Lloyd RM, Quan SF, Troester MT, Vaughn BV. AASM scoring manual updates for 2017 (version 2.4). J Clin Sleep Med. 2017;13(5):665–66. PMID: 28416048 PMCID: PMC5406946. doi:10.5664/jcsm.6576.
- Force AAoSMT. Sleep-related breathing disorders in adults: recommendations for syndrome definition and measurement techniques in clinical research. Sleep. 1999;22:667–89. PMID: 10450601. doi:10.1093/sleep/22.5.667.
- Kapur VK, Baldwin CM, Resnick HE, Gottlieb DJ, Nieto FJ. Sleepiness in patients with moderate to severe sleep-disordered breathing. Sleep. 2005;28(4):472–77. PMID: 16171292. doi:10.1093/sleep/28.4.472.
- Abad VC, Guilleminault C. Treatment options for obstructive sleep apnea. Curr Treat Options Neurol. 2009;11(5):358–67. PMID: 19744402. doi:10.1007/s11940-009-0040-6.
- Hang LW, Wang HL, Chen JH, Hsu JC, Lin HH, Chung WS, Chen YF. Validation of overnight oximetry to diagnose patients with moderate to severe obstructive sleep apnea. BMC Pulm Med. 2015;15(1):24. PMID: 25880649 PMCID: PMC4407425. doi:10.1186/s12890-015-0017-z.
- Pedregosa F, Varoquaux G, Gramfort A, Michel V, Thirion B, Grisel O, Blondel M, Prettenhofer P, Weiss R, Dubourg V., et al. Scikit-learn: machine learning in python. The Journal of Machine Learning Research. 2011;12:2825–30.
- Polo-Kantola P. Sleep and menopause. Womens Health (Lond). 2007;3(1):99–106. PMID: 19803869. doi:10.2217/17455057.3.1.99.
- Sun LM, Chiu HW, Chuang CY, Liu L. A prediction model based on an artificial intelligence system for moderate to severe obstructive sleep apnea. Sleep Breath. 2011;15(3):317–23. PMID: 20602177. doi:10.1007/s11325-010-0384-x.
- Liu WT, Wu HT, Juang JN, Wisniewski A, Lee HC, Wu D, Lo YL. Prediction of the severity of obstructive sleep apnea by anthropometric features via support vector machine. PLoS One. 2017;12(5):e0176991. PMID: 28472141 PMCID: PMC5417649. doi:10.1371/journal.pone.0176991.
- Choksatchawathi T, Ponglertnapakorn P, Ditthapron A, Leelaarporn P, Wisutthisen T, Piriyajitakonkij M, Wilaiprasitporn T. Improving heart rate estimation on consumer grade wrist-worn device using post-calibration approach. IEEE Sens J. 2020;20(13):7433–46. doi:10.1109/JSEN.2020.2979191.
- Breiman L. Random forests. Mach Learn. 2001;45(1):5–32. doi:10.1023/A:1010933404324.
- DeLong ER, DeLong DM, Clarke-Pearson DL. Comparing the areas under two or more correlated receiver operating characteristic curves: a nonparametric approach. Biometrics. 1988;(3):837–45. PMID: 3203132. doi:10.2307/2531595.
- Altmann A, Tolosi L, Sander O, Lengauer T. Permutation importance: a corrected feature importance measure. Bioinformatics. 2010;26(10):1340–47. PMID: 20385727. doi:10.1093/bioinformatics/btq134.
- Archer KJ, Kimes RV. Empirical characterization of random forest variable importance measures. Comput Stat Data Anal. 2008;52(4):2249–60. doi:10.1016/j.csda.2007.08.015.
- Pal M. Random forest classifier for remote sensing classification. Int J Remote Sens. 2005;26(1):217–22. doi:10.1080/01431160412331269698.
- Liu D, Sun K. Random forest solar power forecast based on classification optimization. Energy. 2019;187:115940. doi:10.1016/j.energy.2019.115940.
- Yang F, Wang H-Z, Mi H, Cai W-W. Using random forest for reliable classification and cost-sensitive learning for medical diagnosis. BMC Bioinform. 2009;10(1):S22. doi:10.1186/1471-2105-10-S1-S22.
- Alickovic E, Subasi A. Medical decision support system for diagnosis of heart arrhythmia using DWT and random forests classifier. J Med Syst. 2016;40(4):108. PMID: 26922592. doi:10.1007/s10916-016-0467-8.
- Ford ES, Li C, Wheaton AG, Chapman DP, Perry GS, Croft JB. Sleep duration and body mass index and waist circumference among US adults. Obesit. 2014;22(2):598–607. PMID: 23836704 PMCID: PMC4580243. doi:10.1002/oby.20558.
- Gangwisch JE, Malaspina D, Boden-Albala B, Heymsfield SB. Inadequate sleep as a risk factor for obesity: analyses of the NHANES I. Sleep. 2005;28(10):1289–96. PMID: 16295214. doi:10.1093/sleep/28.10.1289.
- Janssen I, Heymsfield SB, Allison DB, Kotler DP, Ross R. Body mass index and waist circumference independently contribute to the prediction of nonabdominal, abdominal subcutaneous, and visceral fat. Am J Clin Nutr. 2002;75(4):683–88. PMID: 11916754. doi:10.1093/ajcn/75.4.683.
- Bouchard C. BMI, fat mass, abdominal adiposity and visceral fat: where is the ‘beef’? Int J Obes. 2007;31(10):1552–53. PMID: 17549092. doi:10.1038/sj.ijo.0803653.
- Pillar G, Shehadeh N. Abdominal fat and sleep apnea: the chicken or the egg? Diabetes Care. 2008;31 Suppl 2(Supplement 2):S303–9. PMID: 18227501 PMCID: PMC2453667. doi:10.2337/dc08-s272.
- Trombetta IC, Maki-Nunes C, Toschi-Dias E, Alves M-JN, Rondon MUP, Cepeda FX, Drager LF, Braga AMF, Lorenzi-Filho G, Negrao CE., et al. Obstructive sleep apnea is associated with increased chemoreflex sensitivity in patients with metabolic syndrome. Sleep. 2013;36(1):41–49. PMID: 23288970 PMCID: PMC3524508. doi:10.5665/sleep.2298.
- Vgontzas AN, Bixler EO, Chrousos GP. Sleep apnea is a manifestation of the metabolic syndrome. Sleep Med Rev. 2005;9(3):211–24. PMID: 15893251. doi:10.1016/j.smrv.2005.01.006.
- Ryan S, Arnaud C, Fitzpatrick SF, Gaucher J, Tamisier R, Pépin J-L. Adipose tissue as a key player in obstructive sleep apnoea. European Respiratory Review. 2019;28(152). PMID: 31243096. doi:10.1183/16000617.0006-2019.
- Öğretmenoğlu O, Süslü AE, Öt Y, Önerci TM, Şahin A. Body fat composition: a predictive factor for obstructive sleep apnea. The Laryngoscope. 2005;115(8):1493–98. PMID: 16094131. doi:10.1097/01.mlg.0000172204.82314.c3.
- Lam JCM, Lam B, Lam C-L, Fong D, Wang JKL, Tse H-F, Lam KSL, Ip MSM. Obstructive sleep apnea and the metabolic syndrome in community-based Chinese adults in Hong Kong. Respir Med. 2006;100(6):980–87. PMID: 16337115. doi:10.1016/j.rmed.2005.10.003.
- Cremonini E, Bonaccorsi G, Bergamini CM, Castaldini C, Ferrazzini S, Capatti A, Massari L, Romani A, Marci R, Fila E, et al. Metabolic transitions at menopause: in post-menopausal women the increase in serum uric acid correlates with abdominal adiposity as assessed by DXA. Maturitas. 2013;75(1):62–66. PMID: 23415064. doi:10.1016/j.maturitas.2013.01.014.
- Biswas R, Rahman M. Fazlee Kibria Chowdhury Md (2018) Relation of snoring habits with body mass index and neck circumference among adult population. J Sleep Disord Ther. 2018;7(293):2167–0277.1000293. doi:10.4172/2167-0277.1000293.
- Strohl KP, Redline S. Recognition of obstructive sleep apnea. Am J Respir Crit Care Med. 1996;154(2 Pt 1):279–89. PMID: 8756795. doi:10.1164/ajrccm.154.2.8756795.
- Young T, Peppard P, Palta M, Hla KM, Finn L, Morgan B, Skatrud J. Population-based study of sleep-disordered breathing as a risk factor for hypertension. Arch Intern Med. 1997;157(15):1746–52. PMID: 9250236. doi:10.1001/archinte.1997.00440360178019.
- Carmelli D, Swan GE, Bliwise DL. Relationship of 30-year changes in obesity to sleep-disordered breathing in the Western collaborative group study. Obes Res. 2000;8(9):632–37. PMID: 11225711. doi:10.1038/oby.2000.81.
- Kiral N, Salepçi B, Fidan A, Torun E, Cömert S, Saraç G, Havan A, Çaglayan B. Relationship between obstructive sleep apnea syndrome severity and age. Eur Respiratory Soc; 2011; 38: p2190.
- Leppanen T, Toyras J, Mervaala E, Penzel T, Kulkas A. Severity of individual obstruction events increases with age in patients with obstructive sleep apnea. Sleep Med. 2017;37:32–37. PMID: 28899537. doi:10.1016/j.sleep.2017.06.004.
- Geer EB, Shen W. Gender differences in insulin resistance, body composition, and energy balance. Gend Med. 2009;6(Suppl 1):60–75. PMID: 19318219 PMCID: PMC2908522. doi:10.1016/j.genm.2009.02.002.
- Huang T, Lin BM, Markt SC, Stampfer MJ, Laden F, Hu FB, Tworoger SS, Redline S. Sex differences in the associations of obstructive sleep apnoea with epidemiological factors. Eur Respir J. 2018;51(3). PMID: 29449424 PMCID: PMC6110385. doi:10.1183/13993003.02421-2017.
- Leelaarporn P, Wachiraphan P, Kaewlee T, Udsa T, Chaisaen R, Choksatchawathi T, Laosiriratet R, Lakhan P, Natnithikarat P, Thanontip K, et al. Sensor-Driven achieving of smart living: a review. IEEE Sens J. 2021;21(9):10369–91. doi:10.1109/JSEN.2021.3059304.
- Zarei A, Asl BM. Automatic detection of obstructive sleep apnea using wavelet transform and entropy-based features from single-lead ECG signal. IEEE Journal of Biomedical and Health Informatics. 2018;23(3):1011–21. PMID: 29993564. doi:10.1109/JBHI.2018.2842919.
- Deviaene M, Testelmans D, Buyse B, Borzée P, Van Huffel S, Varon C. Automatic screening of sleep apnea patients based on the SpO2 signal. IEEE Journal of Biomedical and Health Informatics. 2018;23(2):607–17. PMID: 29993790. doi:10.1109/JBHI.2018.2817368.
- Gutiérrez-Tobal GC, Álvarez D, Crespo A, Del Campo F, Hornero R. Evaluation of machine-learning approaches to estimate sleep apnea severity from at-home oximetry recordings. IEEE Journal of Biomedical and Health Informatics. 2018;23(2):882–92. PMID: 29993673. doi:10.1109/JBHI.2018.2823384.
- Lin C-L, Yeh C, Yen C-W, Hsu W-H, Hang L-W. Comparison of the indices of oxyhemoglobin saturation by pulse oximetry in obstructive sleep apnea hypopnea syndrome. Chest. 2009;135(1):86–93. PMID: 18689584. doi:10.1378/chest.08-0057.
- Hanif U, Leary E, Schneider L, Paulsen R, Morse AM, Blackman A, Schweitzer P, Kushida CA, Liu S, Jennum P, et al. Estimation of Apnea-Hypopnea index using deep learning on 3D craniofacial scans. IEEE Journal of Biomedical and Health Informatics. 2021;25(11):4185–94. PMID: 33961569. doi:10.1109/JBHI.2021.3078127.
- Lee RW, Vasudavan S, Hui DS, Prvan T, Petocz P, Darendeliler MA, Cistulli PA. Differences in craniofacial structures and obesity in caucasian and Chinese patients with obstructive sleep apnea. Sleep. 2010;33(8):1075–80. PMID: 20815189 PMCID: PMC2910536. doi:10.1093/sleep/33.8.1075.
- Collop NA. Scoring variability between polysomnography technologists in different sleep laboratories. Sleep Med. 2002;3(1):43–47. PMID: 14592253. doi:10.1016/s1389-9457(01)00115-0.
- Riedel BW, Winfield CF, Lichstein KL. First night effect and reverse first night effect in older adults with primary insomnia: does anxiety play a role? Sleep Med. 2001;2(2):125–33. PMID: 11226861. doi:10.1016/s1389-9457(00)00054-x.
- Hizli O, Ozcan M, Unal A. Evaluation of comorbidities in patients with OSAS and simple snoring. ScientificWorldJournal. 2013;2013:709292. PMID: 23710145 PMCID: PMC3654252. doi:10.1155/2013/709292.
- Veldi M, Ani R, Vaher H, Eller T, Hion T, Aluoja A, Vasar V. Obstructive sleep apnea syndrome (OSAS): pathophysiology in Estonians. Pathophysiology. 2010;17(3):219–23. PMID: 20116218. doi:10.1016/j.pathophys.2010.01.001.