Abstract
Bad weather in many countries limits the use of optical satellite imageries in spatial and temporal monitoring of the environment. In this paper, a series of low-altitude oblique aerial photos taken on daily, weekly and monthly intervals were used to monitor the geomorphological changes in the upper part of the Mersey Estuary, northwestern England. This low-altitude aerial photo methodology reveals itself to be a satisfying compromise between cost, accuracy and difficulty of implementation. It offered a large amount of information on a spatial and temporal scale aiding in the understanding of channel mobility. This was an important consideration in the sitting and installation of new bridge pier foundations. This series of oblique aerial photos was used in a dynamic model to determine the migration of the ebb channel and was effective in identifying the main route of flow. Few uncertainties were encountered and the level of accuracy achieved in resolving these uncertainties in the images was in the range from 40 cm to a maximum of 1.7 m. This was compared with historical navigation charts and showed good correlation. Further applications are required to improve the quality of the data output from these images and the development of the technique.
1. Introduction
Estuaries are common features along many coasts all over the world, which are very important as navigation channels, sheltered mooring places and habitats for marine flora and fauna (Jeuken et al. Citation2003). Field survey is a typical accurate approach of surveying the morphology of the estuaries. It is, however, local in extent, costly and time-consuming (Gilvear et al. Citation2004). Remotely sensed data provides a potentially less costly on a long-term basis, source of information in monitoring estuarine changes particularly the synoptic view (Rainey et al. Citation2003). A wide range of remote sensing sensors are used for estuarine monitoring and mapping. This includes optical remote sensing of medium spatial resolution and multi-spectral resolution (e.g. SPOT, Landsat). However, the high spatial resolution of 1 m for the panchromatic and 4 m for the multi-spectral resolution (e.g. IKONOS, QUICKBIRD) are of great importance in estuarine mapping (Gilvear and Bryant Citation2003). These optical remote sensing techniques are proved to be an efficient and cost effective tool for real-time information that aids in environmental monitoring. There is no doubt that the rapid development of the technical specifications of remote sensing sensors has offered great potential for obtaining high spatial and spectral resolution images. This generates large amounts of data and information that are then frequently input into various forms of environmental models. However, the temporal and spatial coverage is a key constraint of remotely sensed optical data. Temporal coverage varies from a minimum of 16 days for Landsat in order to obtain a decent spatial resolution, whilst the coarse resolution from NOAA, which would cover the globe twice a day has a poor resolution for a detailed research and/or small-scaled project such as the Mersey study. Unfortunately, there are some additional constraints that might obstruct the full usage of this invaluable source of information. Bad weather, including high cloud coverage, during much of the year might handicap or prevent entirely the capturing of clear optical satellite images for a specific location on the globe (e.g. United Kingdom) (Gleitsmann and Kappas Citation2006). It is not just optical remote sensing, Light Detection and Ranging Radar (LiDAR) are found to be very efficient in studying the morphology of estuarine banks and floodplain morphology (Cobby et al. Citation2001, Witte et al. Citation2001).
The morphological style of a river is determined chiefly by the mass of water and sediment delivered to the channel. It is, however, modulated by the channel scale, its slope and the magnitude of the tide (Church Citation2006). So, understanding the geomorphological behaviour of one of the biggest and most highly dynamic estuaries of the UK, like the Mersey, requires frequent coverage of aerial photos to give a complete temporal and spatial picture of what is happing in the estuary. This is important, particularly for the strategic planning of major new structures where the installations will include new foundations, in this case for a bridge, with piers in the estuary. The interaction of bridge piers with this highly complex estuary environment requires study and ongoing monitoring. Frequent coverage of the estuary by satellite/aerial images would help with understanding the existing geomorphological behaviour of the estuary and in due course, provide the basis for predicting the possible interaction between the proposed bridge piers and the estuary (DEFRA Citation2006, Masselink and Hughes Citation2003). Such frequent coverage of satellite images is required to be spectrally in the range of colour composite (i.e. three or more channels), however, the spatial resolution should be in the range from 1m to 10m to meet the aim of monitoring the channel sinuosity and channel bed location. Optical satellite imageries failed to offer this coverage owing to bad weather during most of the year. Given that observed geomorphological changes within the estuary had occurred over a matter of a few tides, and significant changes in less than a month, then the poor temporal coverage from satellite images for this location ruled this option out.
Oblique aerial photos have been used in some research of mapping and monitoring of glacier areas (Gleitsmann and Trabant Citation2005, Gleitsmann and Kappas Citation2006) or for three-dimensional (3D) texture mapping (Henry et al. Citation2002, Frueh et al. Citation2004). It has been combined with automated digital photogrametery to monitor channel changes (Chandler et al. Citation2002). However, the full potential use of oblique aerial photographs in river geomorphology is still under exploration.
In this paper, the challenge was to use low-altitude oblique aerial photographs to monitor the geomorphological changes in the highly dynamic estuary (Mersey Estuary), North-Western UK. A flight path was chosen to follow the centreline of the estuary at or close to low tide, with flight altitude between 1400 and 1500 feet (425–457 m) above sea level. The technical specification of the camera used was a Canon IDS Mark 2 with 24/70 Zoom F2.8 lens, with no fixed viewing angle (Van Rhijn Citation2007). The flight schedule was applied on a daily, weekly and monthly basis to provide clear capture of aerial imaging for qualitative analysis. Quantitative analysis from these kind of images is, however, still questionable. In this case, the use of qualitative analysis was developed to monitor the dynamicity of the estuary and support the results obtained from other more deterministic models, including computational hydrodynamics models. The work was extended to explore some semi-quantitative analytical methods using the oblique image series.
The study focused on evaluating this methodology as a means of investigating the geomorphological behaviour and dynamicity of the estuary. Use was made of a close range remote sensing method employing a low-flying light aircraft as a basis for digital oblique aerial photogrametery. However, a key constraint of this method is the arbitrary nature of the information which limits its suitability for quantitative interpretation. Nevertheless, an attempt to obtain semi- quantitative measures of change within the estuary is reported. Both advantages and disadvantages of this approach are discussed in the paper.
2. Case study – Mersey Estuary
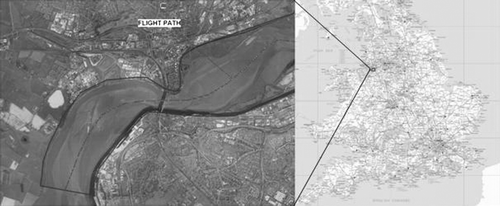
The Mersey Estuary is located on the North West coast of England (). It is a highly mobile Estuary with sand/mudflats which are exposed to frequent high/low tide cycles (ABPmer Citation2001, Van der Wal and Pye Citation2000). The Mersey estuary in the area of study is relatively shallow and is dominated by a number of low flow channels with areas of inter-tidal salt-marsh on both the southern bank and northern banks. (EMPHASYS Consortium Citation2000).
Figure 1. Area of study with the flight path.
A significant feature of the estuary is the highly asymmetrical tide induced by the severe constriction of the estuary at Runcorn Gap, located immediately downstream of the study area. This creates a flood tide of approximately 2 hours duration but an ebb tide of some 10 hours. The flood thus creates high velocities and induces rapid sediment uptake into the water column and considerable amounts of migration, erosion and deposition of bed material in the area.
This feature, combined with the randomness of the fluvial flows from the River Mersey which discharges into the estuary upstream of the study area, produces a highly complex geomorphological system.
3. Materials and methods
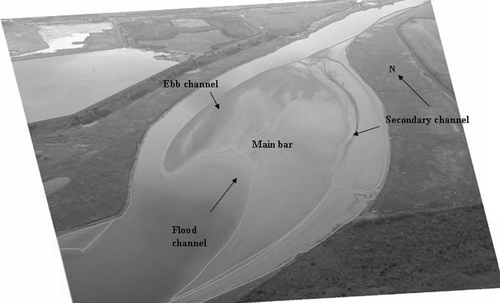
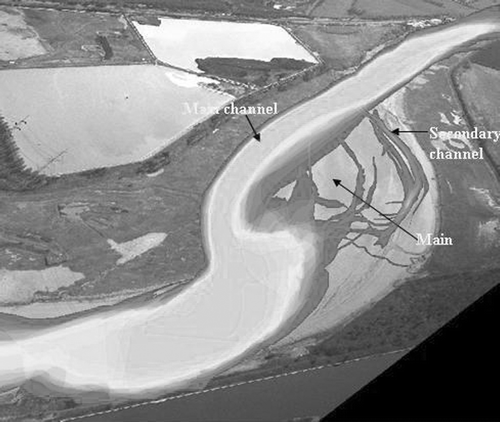
The flights used to obtain the oblique aerial photos were planned to be carried out during the time of low water in order to show the location of the low flow channels. These images also provided the opportunity to observe the onset of changes in bed morphology and the development of bed features that may subsequently induce more rapid, significant change. A limited number of images were taken at high water to determine the spatial extent of inundation on the salt-marshes. The altitude of the aeroplane has been maintained between 1400 to 1500 feet above sea level to minimise the number of occasions when cloud cover would hinder the survey. shows an example of the oblique aerial photo and the main channel bar is bounded with the grey coloured line.
Figure 2. Example of the oblique aerial photos that has been taken on 21 May 2007 at 15.29 GMT showing the main channel-bounded by the grey line.
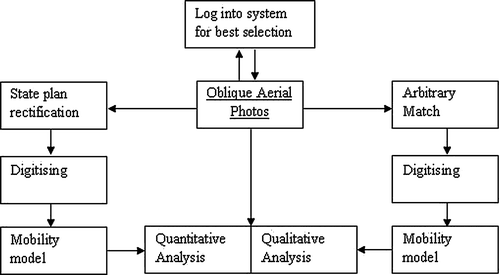
One of the disadvantages of the oblique images, particularly taken from such a relatively low altitude, is that these could not be rectified to a flat grid system; therefore the images were arbitrarily matched to a reference image (base image). This arbitrary rectification was based on the use of a number of clear ground control points on both images. This approach allowed for qualitative comparison between images and enabled the monitoring of both the mobility and sinuosity of the main ebb channel and sand bars in the estuary, and in particular, those in the proximity of the proposed location of the bridge piers.
The typical flight captures about 100 aerial photos, which therefore amounts to about 1200 per year from monthly flights. The majority of these photos are usable because, with the relatively low-level flight and picking the days when cloud cover is at minimum and with the flight not taking much more than an hour, we therefore get a good return. This is owing to our interest in low water, and there will be a range of two to three days that a return flight could occur around the absolute low water without losing the definition of low water we are using. This produced a large number of aerial photos, therefore a database log was established to record all the information about each flight. This includes:
-
date and time of the flight,
-
altitude of the aeroplane,
-
description of the flight,
-
location and orientation of the image (this is identified by the authors based on the relative location of the image to upstream or downstream),
-
state of tide,
-
weather conditions on the ground including wind speed and wind direction.
-
subsequently, fluvial flow records were obtained for the River Mersey discharge into the study area and this information was added to the database.
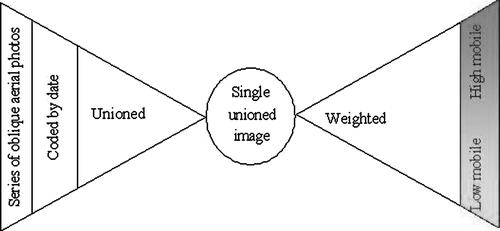
Figure 3. Conceptual model of the oblique aerial photo processing.
4. Uncertainties
There are uncertainties that arise using this approach to aerial imagery which are related to either the technique of capturing the oblique aerial photos or the data handling.
4.1 Parallax error (oblique position)
This error resulted from the technique of capturing the oblique photos and derived from the altitude of the aeroplane, the flight path, the field and angle of view together with the technical specifications of the camera. Whilst the images shows a high level of detail there is high distortion of the earth's features on the margin (i.e. in the distance from the camera) more than those in the centre (i.e. close to the camera). This error varies spatially within an image. Such images are very difficult to rectify to the state plan of the National Grid.
4.2 Rectification methodology
The flights could not be fixed to achieve an exactly repeatable set of images. Thus the oblique aerial images of the same study area differ in the area coverage, owing to the angle they are taken from, and, therefore, the images match each other with varying degrees of closeness. This error varies from one image to another, and depends on how much the images vary from the same general angle of view.
This presents difficulty in rectifying the images to the national grid system, and therefore an arbitrary matching approach was adopted. This arbitrary or false referencing is based on using a clear image to be the reference image and rectify all the rest of the images to this reference. This avoided the excessive distortion that would have otherwise arisen from the need to stretch the images to fit onto the state plan National Grid. The matching method was based on using clear and visible Ground Control Points (GCPs) and an accepted range of error within the images of 14 pixels to a maximum of 96 pixels. The statistical analysis of this range of RMS error in relation to the pixel size (dimension) and the size of the images (number of pixels) shows that it equates to 32%–46% of the pixel size (1 m). This means that the maximum error achieved is about 46 cm.
4.3 Subjective (digitising) error (channel recognition and digitising)
In order to detect channel mobility and sinuosity, the channel boundaries need to be identified in a systematic and repeatable manner. This was not an easy matter and required practice and training of the staff which were interpreting the data. Owing to either the high/low water level or the resolution of the image it was difficult to detect the channel boundary in some parts of the estuary. Two factors controlled the subjective digitising error, which are 1) interpretation of the boundary between different morphological features; and 2) hand accuracy in tracing these features.
In some areas the boundary was very clear but in others it was unclear and misinterpretation of the channel boundary leads to an error. This error varies spatially within an image, depending on boundary clarity and unless the staff member tracing these features is trained, the margin of error will be high.
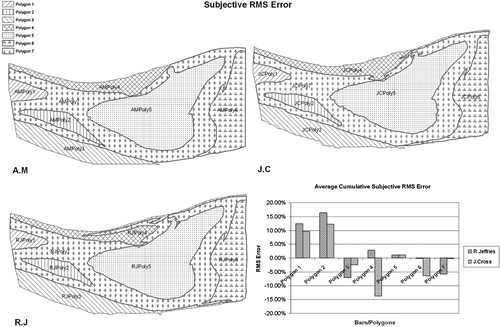
To assess this subjective digitising error, the channel and bar polygons were digitised by three staff members to compare the level of accuracy. The three staff had been trained to follow the boundary between water and sediment, thereby discriminating channels and bars. shows the average cumulative RMS (root mean square) error achieved from both the interpretation of the geomorphological bars and the accuracy of hand tracing. It shows a variable margin of error between 1 and 17%. When compared with the size of image and pixel size, and then compared with the potential impact on the location of the foundations (bridge piers), it was found the maximum 17% error was still an acceptable margin of error for the purpose of the study.
Figure 4. Subjective digitising error.
5. Analysis
Once the arbitrary rectification of the selected images was completed, the outline of the ebb channels, sand bars and salt marshes were digitised. This digitised record was then used to build a mobility model to detect the changes of the low water channel as well as sediment movements. Patterns of bar and erosion features were recorded and then overlays between successive flights were used to determine change, and in particular the degree of change. This qualitative analysis proved useful in building the team's understanding of the processes within the estuary and the factors that may induce rapid or significant change.
5.1 Channel mobility funnel
Channel mobility and sinuosity were studied on both spatial and temporal scales to determine the migration of the ebb channel. A geographic information system (GIS) model was developed to provide a more quantitative analysis of these observed changes. The GIS model was based on the union of all the channel boundaries and weighting the intersections to rank the intersected polygons. The conceptual model is shown in . The process started from selection of the appropriate images. These were those images where there was reasonable similarity of area covered and where features were sufficiently well defined to allow analysis. These were then coded by the date of the capture and GIS analysis was used to automate the union of digitised boundaries, produce a weighting and ranking of the highly intersected polygons, and finally colour code this ranking to reflect that the highly intersected areas. The higher the ranking, the more likely the area is as a location for the ebb channel and thus where the main drainage flow occurs.
Figure 5. Channel mobility funnel model.
So the degree of colour reflects the location of the ebb channel. The bright grey area is where the channel is most often found and the dark grey colour is where it intermittently migrates to.
The model robustly overlaid the main channel boundaries (in the form of polygons) and used the weighting system to find where the channel is most often routed. An example of the output of the model is shown in . It categorises the estuary into zones ranging from very highly stable, that is where the low flow channel is most frequently found (shown in green), through varying degrees of stability (by colour change) to the most unstable areas where the channel position is highly mobile.
Figure 6. Example of the channel mobility model result.
In reality, these highly unstable areas relate to the positions of the flood channels where the high velocities and power of the flood tide are able to force dramatic change but then the effect of subsequent ebb flows typically damps out these changes in morphology and the low flow channels are re-established.
The factors controlling channel mobility range from the high energy of incoming flow, the tide level and any tidal surges. The effect of fluvial discharges was not found to be significant in terms of major changes in morphology but may well contribute to the onset of change within the estuary. Considering all these factors, and based on the available data, it seems that the main channel is likely to be reasonably stable matching with most of the visual interpretation of the series of the oblique aerial photos. However, it is clear that the stability is not absolute; and areas of very high stability may be subject to some degree of change.
6. National grid example
It was felt important to attempt to produce a rectified example of the oblique aerial photos to the national grid system. This would clarify the difficulties in so doing but would also give some confidence to the results obtained using the arbitrary rectification methodology. shows the result of this example, where five images (i.e. five dates) were rectified to the National Grid using ERDAS Imagine software. The rectification process was based on topographic maps and the global SRTM digital elevation model data. The advantages of the rectified images are the complete coverage of the estuary together with quantifying the degree of errors relatively to the exact location of the bridge piers. However, although the mosaic of the individual images provided a complete coverage of the estuary, it shows some ambiguity. Radiometric correction was also a constraint to developing the mosaic of rectified images. No sophisticated radiometric algorithms were used. Reliance was placed on the simple radiometric match of the ERDAS imagine package using the average value in the intersected area of the images.
Figure 7. Example of mosaiced rectified oblique aerial photos showing the level of channel mobility.
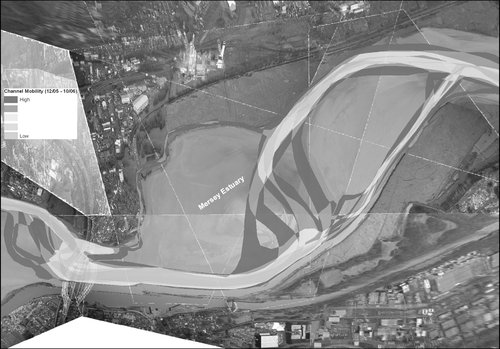
A simple comparison between the rectified images to the national grid and the arbitrary matched images for the location of the bridge piers showed that there was no significant discrepancy. It could be concluded from the model that:
-
Bright grey colour: areas where the main channel has very low mobility and tends to flow in this location most of the time. It occupies zones parallel to the northern and southern banks, particularly at the western end of the area and towards the extreme of the study area in the east.
-
Dark grey colour: areas where the main channel has high to very high mobility and tends to migrate, often quite rapidly over a few tides, to a new path. However, these new channel paths tend to be relatively short lived, hence the dark grey colour code.. This often occurs during the flooding period and mostly represents the secondary channels.
-
Areas between bright and dark grey colours represent variable degrees of channel mobility from low mobility (nearer the bright grey). For example, channel mobility is widespread in the estuary in the east of the study area where the channel moves across the full width of the estuary on a reasonably regular basis.
The model resulted in a range of areas of low to high stability of the geomorphological processes, which fairly agreed with this historical record. These results were then reviewed with results obtained from a hydrodynamic and morphological computer model of the estuary to consider the position and potential impacts of the proposed bridge piers.
The factors controlling the channel mobility range from the variable energy of the incoming tide (between high spring and moderate neap tides), the mass of water and sediment load that it carries, the tidal velocity and wind speed and its direction. In terms of the use of this methodology, it became apparent that the tidal level was also significant as this influenced the appearance and therefore the visual interpretation of the different morphological features i.e an extreme low tide could give greater definition to features that on another low water would be less obvious. Whilst this can be a difficulty, it can be managed through the training of staff who are undertaking the interpretation and digitising of the images. Despite these factors, based on the available data it seems that the main channel is likely to be reasonably stable in the positions shown, matching with the visual interpretation given in . However, it clearly appears that the stability is not absolute; and areas of very high stability may be subject to some degree of change.
7. Discussion and conclusion
Weather conditions, timing and resolution are key constraints limiting the potential use of optical remotely sensed data, particularly when it is needed for to provide a frequent temporal and spatial coverage of an area in response to strategic plans. Low altitude aerial photos have been found to be an efficient source of information, where the capturing of an oblique aerial image has been found to be both cost effective and sufficiently accurate for geomorphological interpretations. There are, however, some uncertainties including parallax errors, rectification and subjective digitising errors. In this case, the purpose was investigating the potential interaction of a proposed foundation with the estuary environment and in such a study these errors and uncertainties were managed and did not significantly detract from the results. Where the images are needed for the development of strategic plans and where relative, comparative studies are to be used, it is the author's opinion that this approach, using low-level oblique aerial photography and developing GIS driven analysis from the record, is an efficient and cost effective methodology worthy of further development.
The oblique aerial photographic record has provided a baseline and catalogue of observed change within the estuary that has been used to increase the confidence in the developing plans for the bridge structure and also to provide a framework for ongoing monitoring both during and post-construction of the bridge. It is recognised that the complex nature of the estuarine environment at this location cannot be fully defined and therefore the ability to measure and assess changes as they occur is a vital part of the stewardship of the estuary. The oblique aerial photographic record and supporting GIS database and analytical tools will contribute significantly in this process.
The paper presents two exercises of analysis of the oblique aerial photo record; one to an arbitrary system of rectification and another to national grid rectification. Both exercises resulted in a confidence level of accuracy in relation to the location of the bridge piers, the main purpose of the study. The assessment of the sinuosity of the channel reflects well the historical record of the discharge channels within the estuary and the location of normal flow of this part of the estuary. The mobility model gave an indication of where the channel flow might occur and the likelihood of this. Again, these results provided good agreement with the historical records of the navigation charts.
This paper presents the short-term changes of the geomorphology of the Mersey Estuary using contemporary oblique aerial photos. The methodology undertaken has provided an invaluable baseline of understanding of the morphological processes operating in the estuary. The method produced a significant amount of useful data which was used to develop a model to map the dynamicity and sinuosity of the main channel. This has contributed significantly to the understanding of the processes and, perhaps most importantly, what level of uncertainty still exists in this.
While there are advantages and disadvantages of using the oblique aerial photos, the speed with which the record can be obtained and the analysis that can be done with the record, either qualitatively or indeed semi-quantitatively, can provide a very valuable insight to environmental processes. The use of an arbitrary system of rectification has been shown to deliver useful and reliable results for such processes. Using the more logical rectification to the state National Grid can also provide the means to develop semi-quantitative analytical tools. However, it is a matter of choice whether the additional resource time needed and accuracy obtained is necessary for the particular environmental process under consideration.
In short, the use of low-level aerial oblique photo surveys with supporting GIS analysis is a very cost-effective and efficient source of information for qualitative measurements of short-term environmental change and for ongoing environmental monitoring of such changes. It is concluded that, in terms of offering a series of contemporary spatial information in areas experiencing bad weather, low altitude oblique aerial photography provided the answer. Improved models for digital image processing for improved quality of the results are required. Nevertheless, it is anticipated to use this series of oblique aerial photography in a research and development project to develop a model of digital image processing that will improve the analysis and results obtained from the oblique aerial photography.
Notes on contributors
Islam Abou El-Magd is an Assistant Professor for the National Authority for Remote Sensing and Space Sciences. Dr. Abou El-Magd research area of interest is remote sensing and GIS modelling in environmental related issues. He is currently leading a big joint project in the integration of remote sensing modelling and super computing for water resources management and its interrelation with the climatic changes. He is also teaching undergraduates and postgraduates courses in remote sensing and its environmental applications, within Egyptian universities and the region.
Paul Hillman is Environment Director for Gifford, the lead consultant for the Mersey Gateway bridge project. He heads a team of scientists and engineers who have been investigating the hydrodynamic and geomorphological characteristics of the Mersey Estuary in the Study Area. His particular interest is in the magnitude of natural changes that occur and how these may, or may not, be influenced by the construction of the bridge, or indeed other interventions by mankind in the estuary. He provides visiting lectures on environmental matters at the University of Southampton, UK and has supervised research and published papers on estuary management, runoff management and various aspects of pollution control.
Acknowledgements
The authors gratefully acknowledge the support and encouragement of Halton Borough Council in the development of this methodology as part of the Mersey Gateway scheme. The authors are also highly indebted to CCW for their help and support to publish this piece of work.
References
- ABPmer , 2001 . An investigation of the gross properties of UK estuaries . Report No. R. 900 .
- Chandler , J. , Ashmore , P. , Paola , C. , Gooch , M. and Varkaris , F. 2002 . Monitoring river-channel change using terrestrial oblique digital imagery and automated digital photogrammetry . Annals of the Association of American Geographers , 92 ( 4 ) : 631 – 644 .
- Church , M. 2006 . Bed material transport and the morphology of alluvial river channels . Annual Review of Earth and Planetary Sciences , 34 : 325 – 354 .
- Cobby , D.M. , Mason , D.C. and Davenport , I.J. 2001 . Image processing of airborne laser altimetry data for improved river flood modelling . Journal of Photogrammetry and Remote Sensing , 56 : 121 – 138 .
- DEFRA , 2006 , Shoreline Management Plan Guidance : Appendix E: Open Coast SMP Boundaries
- EMPHASYS Consortium , 2000 . A Guide to prediction of Morphological Change within Estuaries Systems , Research by the EMPHASYS Consortium for MAFF Project FD 1401 , December 2000 .
- Frueh , C. , Sammon , R. and Zakhor , A. 2004 . Automated texture mapping of 3D city models with oblique aerial imagery . 2nd International Symposium on 3D Data Processing. Visualization and Transmission , 6 ( 9 ) : 396 – 403 .
- Gilvear , D. and Bryant , R. 2003 . “ Aerial photography and other remotely sensed data ” . In Tools in Fluvial Geomorphology , Edited by: Kondolf , M. and Piegey , H. 211 – 247 . Chichester : Wiley .
- Gilvear , D. , Tyler , A. and Davies , C. 2004 . Detection of estuarine and tidal river hydromorphology using hyper-spectral and LiDAR data: Forth estuary, Scotland . Estuarine, Coastal and Shelf Sciences , 61 ( 3 ) : 379 – 392 .
- Gleitsmann , L. and Trabant , D. C. 2005 . Digital multi-image photogrametery combined with oblique aerial photography enables glacier monitoring survey flights below clouds in Alaska . In : S. Erasmi , B. Cyffka and M. Kappas Remote Sensing and GIS for Environment Studies . Gottinger Geographische Abhandkungen , 113 , Gottingen , 2005
- Gleitsmann , L. and Kappas , M. 2006 . Glacier monitoring survey flights below cloudes in Alaska: Oblique aerial photography utilising digital multi-image photogrammetry to cope with adverse weather . EARSel eProccedings , 5 : 42 – 50 .
- Henry , J.B. , Malet , J.P. , Maquaire , O. and Grussenmeyer , P. 2002 . The use of small-format and low-altitude aerial photos for the realization of high-resolution DEMs in mountainous areas: application to the Super-Sauze earthflow . Alpes-de-Haute-Provence, France, Earth Surface Processes and Landforms , 27 ( 12 ) : 1339 – 1350 .
- Jeuken , M.C.J.L. , Wang , Z.B. , Keiller , D. , Townend , I. and Like , G.A. , 2003 . Morphological response of estuaries to nodal tide variation . Proceedings of the International Conference on Estuaries and Coasts , 9–11 November 2003 , Hangzhou , China , 166 – 173 .
- Masselink , M. and Hughes , M. 2003 . An Introduction to Coastal Processes and Geomorphology , London : Arnold .
- Rainey , M.P. , Tyler , A.N. , Gilvear , D.J. , Bryant , R.G. and McDonald , P. 2003 . Mapping intertidal estuarine sediment grain size distributions through airborne remote sensing . Remote Sensing of Environment , 86 : 480 – 490 .
- Van der Wal , D. and Pye , K. 2000 . Long-term morphological change in the Mersey Estuary, northwest England . Surface Processes and Modern Environments Research Group, Royal Holloway, University of London, Internal Research Report CS5 , 21
- Van Rhijn , 2007 , Oblique aerial photos capture and techniques . Available from: http://www.vrap.co.uk [Accessed February 2007].
- Van Veen , J. 2001 . Ebb and flood Channel Systems in the Netherlands tidal waters, reprint of the original Dutch text with English translations and annotations . Originally published in Journal of the Royal Dutch Geographical Society , 67 : 303 – 325 .
- Witte , C.R. , Dowling , D. , Weller , R. , Denham , R. , and Rowland , T. 2001 . Quantifying riparian vegetation and stream bank form through the use of airborne laser scanning and digital video data . Proceedings of International Geoscience and Remote Sensing Symposium , 9–13 July 2001 , Sydney , Australia , 1545 – 1548 .