Abstract
The complex nature of coastal ecosystems and their protection require a deeper understanding of land cover change and dynamics. Although a number of ecological studies have been conducted to realise this important objective, little information is available regarding the quantification of this land cover change. The role of mangroves as living barriers was under appreciated prior to the 2004 tsunami event. In this paper, we investigate the buffering functions of mangroves in the 2004 tsunami by employing the methodology developed in our companion paper. We focus more on mangrove distribution patterns in different buffer zones before and after the 2004 tsunami. The presence of mangroves before and after the event was statistically significant for the North (χ 2 =154.08, p≤ 0.001) and Upper South (χ 2 =62.25, p≤ 0.001). We observed positive linear relationships suggesting a loss of mangrove resulted into a gain of barren and sand land cover as a result of a devastating impact from the 2004 tsunami event. There are pockets of inland tsunami inundations and penetrations in the North and Upper-South in part owing to the river mouth profiles and dense mangrove trees. Although the North and Upper South Regions of the study area with large mangrove forest areas suffered slight damages, these regions put up a strong buffer against the tsunami suggesting that mangrove forests play a significant role in shoreline protection.
1. Introduction
Mangroves are woody plants, found primarily in tropical and subtropical regions (Chapman Citation1976). Mangroves are one of the important tropical coastal ecosystems (Dahdouh-Guebas Citation2002). Mangroves are ecotones situated between the marine and the terrestrial environment (Dahdouh-Guebas Citation2001, Saravanan Citation2005), typically located in the muddy, anoxic soils of estuaries, lagoons and river deltas (Dahdouh-Guebas Citation2002). Well known for their exposed aerial roots, foliage salt-excretion, mangroves have important ecological and socio-economical values. Mangroves provide an important source for wood production, food resources, and land protection (Blasco Citation1975, Robertson and Alongi Citation1992, Pearce Citation1999, Rönnbäck Citation1999, Daudouh-Guebas et al. Citation2005, Barbier Citation2006). There is a growing body of empirical evidence on the protective role of mangrove forests (Danielson et al. Citation2005, Chatenoux and Peduzzi Citation2007, Bahuguna et al. Citation2008, Yanagisawa et al. Citation2009). Therefore, in this study we intend to add to this body of evidence by testing the hypothesis whether mangroves acted as strong buffers to tsunami 2004 effects and also determine whether regions with large mangrove forest areas experienced less damage than those with small areas. To gain fundamental insights into this hypothesis we determined whether a loss of mangrove resulted into a gain of barren and sand land cover categories from the devastating impact and inland penetration of the 2004 Indian Ocean tsunami by analysing areas that were in close proximity to the coastline before and after this event.
The buffering functions of mangroves were best illustrated by four recent studies (Massel et al. 1999, Hiraishi and Harada 2003, Danielson et al. Citation2005, Yanagisawa et al. Citation2009). In the first study, Massel et al. (1999) measured wave forces and conducted fluid dynamics modeling. From their report, we learned that tree vegetation has a strong potential to shield coastlines from tsunami damage by reducing wave amplitude and energy. In the second study, Hiraishi and Harada (2003) concluded that 30 trees per 100 m2 in a 100 m wide belt may reduce the maximum tsunami flow pressure by more than 90%. In the third study, Danielson et al. (Citation2005) observed that the force of tsunami impact completely destroyed parts of a village and removed a sand spit that formerly blocked the river in Cuddalore, District, India, but areas with mangroves and tree shelterbelts were significantly less damaged than other areas. In the fourth study, Yanagoisawa et al. (2009) reported that a mangrove forest of Rhizophora species with a density of 0.2 trees m−2 and a stem diameter of 15 cm in a 400 m wide area can reduce the tsunami inundation depth by 30% when the incident wave is assumed to have a 3.0 m inundation depth and a wave period of 30 min at the shoreline.
Mangrove ecosystem contributes to very complex ecological functions and provides dynamic interchanges between mangroves and their surroundings, basically interacting with aquatic, inshore, and terrestrial ecosystem habitats (Mazda et al. Citation1997, Duke et al. Citation1998, Hogarth Citation1999, Saravanan Citation2005, Giri et al. Citation2008). Globally, mangroves support the highest productivity of associated estuarine and coastal ocean waters and offer a logical contribution to coastline protection against strong wave action, sand erosion, and winds, estuary restoration and a healthy marine environment (Saenger et al. Citation1983, Sathiranthai and Barbier 2001, Dahdouh-Guebas et al. Citation2005, Ramachandran et al. Citation2005, Bahuguna et al. Citation2008). Mangrove forests have dual protective functions. Acting as a greenbelt, mangroves protect seaward habitats against influences from land, and protect the landward coastal area against influences from the ocean (Dahdouh-Guebas Citation2006).
Mangroves occupy less than 1% of the world's surface (Saenger Citation2002). The world mangroves have been roughly estimated 181,007 km2 (Spalding et al. Citation1997). Giri et al. (Citation2008) conducted a regional study covering coastal areas of seven countries in Asia over a 30 year study period. In that study, they noted that the remaining mangrove forest areas in 2005 are located in Burma (551 361 ha, 33%), Bangladesh (438 764 ha, 27%), India (337 727 ha, 21%), Thailand (168 910 ha, 10%), Malaysia (70 560 ha, 4%), Indonesia (68 194 ha 4%), and Sri Lanka (10 379 ha, 1%). According to their report, the largest expanse of mangrove forests is located in the Sundarbans (along the border between Bangladesh and India); the Ayeyarwady Delta, Rakhine, and Tahinthayi (Burma); Phang Nga and Krabi (Thailand); and Matang (Malaysia).
Thailand is one of many tropical countries with a large area of mangrove forests (Spalding et al. Citation1997) after Burma, Bangladesh, and India (Giri et al. Citation2008). Most of Thailand's mangroves have been destroyed and threatened during the period spanning from 1961 to 2008 by various forms of human activities (Charuppat and Charuppat Citation1997, Sremongkontip et al. Citation1997, Plathong and Sitthirach Citation1998, Barbier Citation2006, Giri et al. Citation2008). According to Giri et al. (Citation2008), Thailand had 50% (20 300 ha) of its mangrove forests converted to agriculture, 41% (16 815 ha) to aquaculture, and 2% (710 ha) to urban development. In Phang Nga (our study area), mangrove forests are found along the coast and are predominantly of Rhizophora species. The specialised root system of Rhizophora is highly adaptive to the coastal environment, it not only provides an important site of gas exchange for mangrove, but also binds marine and terrestrial sediments against the power of tropical storms and ocean waves as well (Ruitenbeek Citation1994, Janssen and Padilla Citation1999, Kathiresan and Bingham Citation2001, Kathiresan and Rajendran Citation2005).
Recent studies have focused on advancing our understanding about the role of natural resources, such as mangroves, in reducing the impacts of natural hazard (Dahdouh-Guebas Citation2005, UNEP Citation2005, Danielson et al. Citation2005, Chatenoux and Peduzzi Citation2007, Bahuguna et al. Citation2008, Yanagisawa et al. Citation2009). Remote sensing and geographic information system (GIS) have been used to study mangrove forests (e.g., Ramachandran et al. Citation1998, Green et al. Citation1998, Rönnbäck Citation1999, Nayak and Bahuguna Citation2001, Dahdouh-Guebas et al. Citation2002, Baumann Citation2005, Adams Citation2006, Giri et al. Citation2008). Blasco et al. (Citation1998) reviewed the suitability of various remote sensing technologies in different mangrove research fields and concluded that aerial photographs are best suited to investigate mangrove forests.
This report is an extension of a previous study that applied remote sensing and GIS techniques to assess the efficiency of mangrove forest on tsunami-impacted areas (Sirikulchayanon et al. Citation2008). Significant new information obtained from the present study plus previous findings does provide fundamental insights into the role of mangrove forests and further elucidates on its role in protecting the coastal ecosystem against tsunami or any other catas trophic events. In this study we specifically address the following three objectives:
| 1. | To evaluate land cover changes, specifically the geographical distribution and density of mangroves that are in close proximity to coastline before and after 2004 tsunami periods; | ||||
| 2. | To quantify mangrove density before and after tsunami periods and to use the outcomes to establish whether it can withstand powerful storms; | ||||
| 3. | To provide empirical data regarding the benefits of mangrove enriched coastal ecosystems as shoreline protectors against extreme events and critical habitats for coastal biodiversity. | ||||
2. Data and methods
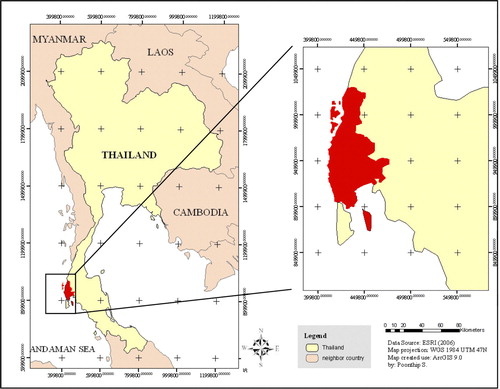
The study area, Phang Nga, is located in the southern coastal portion of Thailand (). It lies along the Andaman coastline within latitudes of 8.13°N and 9.32°N and longitudes of 98.39°E and 98.40°E, covering an estimated area of 2000 km2. The study area is featured by large portions of mixed vegetation, barren land, agricultural area, and beaches. Phang Nga is one of the many coastal provinces in Thailand enriched with mangrove forests, yet, recently mangrove areas have dramatically decreased during the last three decades (Plathong and Sitthirach Citation1998).
Figure 1. Study area located in the southern coastal portion of Thailand.
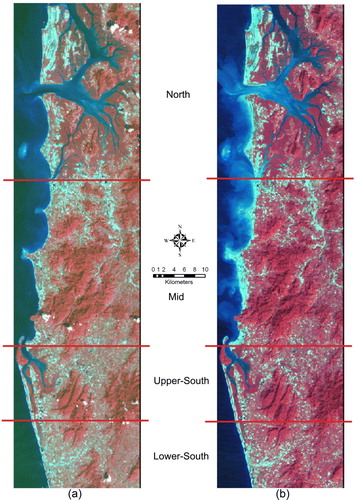
In this study, we used two satellite images obtained from the National Aeronautics and Space Administration (NASA) and University of Maryland data repository. The two satellite images shown in Figures (a) and 2(b), the Landsat TM acquired on 15 January 2002 and ETM+ on 30 December 2004 (path/row: 130/54), represent the pre- and post-tsunami periods, respectively.
Figure 2. Two Landsat images shown with a band 4, 3, 2 combination as RGB: (a) Landsat TM image of 2002 representing the pre-tsunami period, and (b) Landsat ETM+ of 2004 representing the post-tsunami period (Courtesy of NASA and University of Maryland Data Repository). (Available in colour online).
The two Landsat images were used to perform image classification and land cover change detection analyses. As the two images are about two weeks apart in terms of monthly tidal effect. Therefore, the tidal effects in the study area should be very similar and were considered to be negligible for the change detection analysis. Data analysis methods used in this study are similar to those reported in our previous study (Sirikulchayanon et al. Citation2008). Below is a brief summary of the methods used in this study.
2.1 Image pre-processing, classification, and accuracy assessment
Image pre-processing, including spatial registration and resampling, was first conducted on both the pre- and post-tsunami images. The two images were registered to the Universal Transverse Mercator (UTM) Zone 47 coordinate system and WGS 84 spheroid. The Landsat TM image of 2002 was resampled to 25 m to match the 2004 ETM+ image. Next, the two images were classified using a hybrid classification approach, which combined unsupervised ISODATA and supervised Maximum Likelihood algorithms (Sun Citation2004, Sirikulchayanon et al. Citation2008).
Third, an error/confusion matrix (Campbell Citation2002) was used quantitatively to evaluate the accuracy of classes identified with specific reference to mangrove cover. An equalised random sampling method (ERDAS Field Guide 2003) was used to select reference pixels. In this method, each class has an equal number of random reference pixels. The accuracy of land cover change was also assessed using a method that multiplies the individual class accuracy on pre-tsunami and post-tsunami classified maps.
2.2 GIS proximity analysis and change detection
In order to capture the spatial variations of mangrove distributions, the study area was first divided into four regions, that is, North, Mid, Upper-South, and Lower-South. Both the North and the Upper-South regions have large mangrove forest areas. In the North region, mangroves grow behind the beach along the coastline. In the Upper-South region, mangrove areas appear in the form of a thin line extending inland next to the beach and along the entire coast.
A proximity analysis (Chang Citation2008) was then conducted to delineate each region into six buffer zones in various distances from the coastline. A separate layer of coastline was digitised and used as a reference line for the proximity analysis. Specifically, the coastline was buffered with distances of 500, 1000, 1500, 2000, 2500 and 3000 m resulting in six buffer rings around the coastline. The delineation of these buffer distances was informed by the work of Ward and Asphaug (Citation2002) who analysed tsunami impact cavities in terms of distance from the ocean. As we are interested only in the tsunami damage to the land ecosystem, ocean side of the buffer zones were eliminated. As such, each buffer zone covers an area between two successive buffer rings spanning 500 m. For example, buffer zone 1 covers the area between 0 and 500 m from the coastline, buffer zone 2 covers the area between 500 and 1000 m, and so forth. Note that the terms buffer zone, buffer distance, and buffer ring are used interchangeably in the following text.
Land cover types in the pre-tsunami and post-tsunami classified maps were extracted for each buffer zone and used in the change detection analysis. Specifically, a cross-tabulation analysis was performed to compare the pre-tsunami and post-tsunami classified maps for each buffer zone in the four regions. These results were subsequently analysed to determine any significant changes in land cover classes with reference to mangroves.
2.3 Statistical analysis
Chi-square analyses were conducted spatially to compare the distributions of mangrove by proximity distance to coastline and also to determine its effects on the 2004 tsunami in the study region. The underlying assumption for conducting this type of statistical analysis rests on the thinking that spatial patterns within each buffer ring are similar, but also each is independent from one another. In addition, exploratory analysis of the data supported this assumption. In doing this analysis, we wished to determine whether there were any statistically significant differences in spatial relationships between the presence of mangrove or their absence and the impact of 2004 tsunami. Supporting literature and the rationale to conduct a GIS proximity analysis and the buffer distances used in combination with a chi-square analysis was presented in an earlier communication (Sirikulchayanon et al. Citation2008) so we will not repeat the details here.
3. Results
3.1 Accuracy assessment
The pre-tsunami classified map contains seven classes, that is, water body, vegetation, mangrove, urban, barren land, sand, and cloud. The post-tsunami classified map includes all the above classes but the cloud. Sixty reference pixels were chosen for each class to assess the classification accuracy. In this study, the newly formed sand and barren land areas are used to represent the damaged areas as a result of the tsunami event. As such, the barren land and sand classes are merged into one class, that is, barren and sand.
summarises the producer's accuracy, user's accuracy, and kappa statistic for the mangrove and the barren and sand land cover classes. Accuracy measures of these classes ranged from 75% to 87%. Relatively high kappa values, that is, greater than 0.8, are obtained. The accuracies of land cover change for the mangrove and the barren and sand classes are reported in . These accuracy measures are calculated using the user's accuracy for each class on the pre- and post-tsunami classified maps. The average accuracy measures for mangrove change and barren and sand change class were 75% and 72%, respectively.
Table 1. Accuracy of mangrove and barren and sand land cover classes on the pre- and post-tsunami classified maps.
Table 2. Accuracy of mangrove and barren and sand change classes before and after the 2004 tsunami event.
3.2 Analysis of impact on mangrove
3.2.1 Change detection analysis
The classification of the remote sensing images before and after the 2004 tsunami event shows dramatic changes in land cover in the study area. The pre-tsunami map had vegetation and water body as the most dominant land cover categories, while for the post-tsunami map, barren land and sand were the most dominant, especially in geographic locations which were in close proximity to the coastline. There was a complete destruction of large tracts of vegetation and urban land cover along the coastal region after the 2004 tsunami event.
presents the change detection data of mangrove and barren and sand, and shows significant spatial differences in the land cover classes before and after the 2004 tsunami event. Overall, the change detection data () revealed interesting spatial patterns of land cover change for the four regions. The quantitative comparisons of the six buffer zones showed a clear advantage for the North and Upper-South regions, which had a presence of mangrove vegetation, over the rest of the regions. There were general losses of mangrove vegetation, and consistent gains in barren and sand in the North, Mid, and Lower-South regions in all the buffer zones. Specifically, all locations within 500 m from the coastline experienced a major damage and change in land cover categories. In buffer zone 1, the Mid and Upper-South regions had the highest mangrove losses, suggesting a very strong landing and impact from the tsunami. Although tremendous barren and sand gains were observed for both regions in buffer zone 1, it was more apparent in the Mid region than in the Upper-South region.
Table 3. Change detection data of mangrove and barren and sand land cover classes showing significant spatial differences of land cover change before and after the 2004 tsunami event.
Significant mangrove losses and barren and sand gains also occurred within 1000 m from the coastline. However, the presence of patches of mangrove forest in the Upper-South region within this distance cushioned the region against the 2004 tsunami effects. Other types of vegetation adjacent to mangrove patches in the Upper-South region were only destroyed by 12%. Areas deficient of mangrove forests cover namely the Mid and Lower-South regions, regardless of which buffer zone, suffered severe loss accounting for 50% of vegetation and urban land cover categories. There were minimal changes in mangrove coverage within the buffer zones 5 and 6 located farther away from the coastline (i.e., more than 2000 m). In buffer zone 5, the barren and sand class reduced in size in the Upper-South region, meaning that this region may have experienced some replantation of vegetation or expansion of the built-up area. However, this finding requires further evaluation.
3.2.2 Comparison of land cover maps
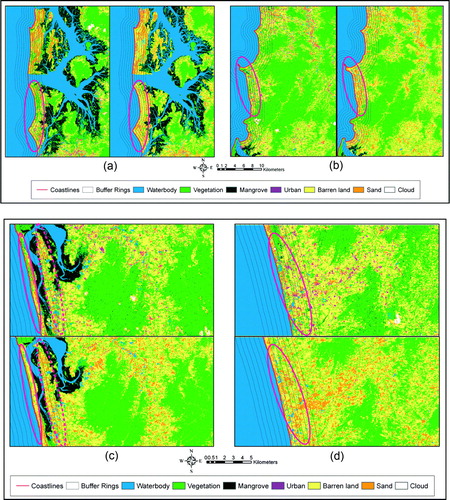
Figures (a) to 3(d) show six buffer zones that lie within 3000 m from the coastline. These buffer zones are created on the pre- and post- tsunami classified land cover maps for the four regions. Areas of interest are selected and marked with red circles in Figures (a) to 3(d). In (a), the pre-tsunami land cover in the North region shows the lower island with a good mix of vegetation and barren and sand in its surrounding areas. In the post-tsunami land cover, we observe remarkable differences in land cover types, especially the loss in vegetation along the coastline and the increase in barren and sand classes. However, there is a slight decrease in mangrove vegetation. In (b), the pre-tsunami land cover shows an even distribution of land cover types throughout the Mid Region, whereas the post-tsunami land cover presents an increase in barren and sand, destruction of urban built-up area, and a loss of mangrove vegetation. In Figures (c) and 3(d), similar patterns in the Upper-South and Lower-South Regions can be observed as those in Figures (a) and 3(b) in the pre-tsunami land cover maps. In the post-tsunami land cover maps, however, there are dramatic increases in barren and sand, and a loss of other vegetation and mangrove across these two regions.
Figure 3. Six buffer rings within 3000 m from the coastal line on the pre- and post-tsunami classified land cover maps in the four regions: (a) North, (b) Mid, (c) Upper-South, and (d) Lower-South. Note that the left panels in 3(a) and 3(b), and the upper panels in 3(c) and 3(d) represent a portion of the pre-tsunami land cover maps. The right panels in 3(a) and 3(b), and the lower panels in 3(c) and 3(d) represent a portion of the post-tsunami land cover maps.
3.2.3 Percent gains and losses in land cover classes
shows percentage gains in barren and sand and percent losses in mangrove within 3000 m from the coastal line in the four regions. The percent gains and losses are derived from the change detection data (), with pre-tsunami 2002 data being the base year. Based on this graph, there was a significant loss of mangrove within 500 m from the coastline in all the four regions. The total net gain of barren and sand was less in the North and Upper-South Regions than in the other regions with the exception of buffer zone 2. This can be explained by the presence of large tracts of mangrove vegetation in the North and Upper-South regions. These visual observations are in line with the change detection data shown in .
Figure 4. Percentage gains and losses in land cover within 3000 m from the coastal line in the four regions. Note that 1 in the graph represents the North, 2 Mid, 3 Upper-South, and 4 Lower-South in that order for the entire six buffer rings.
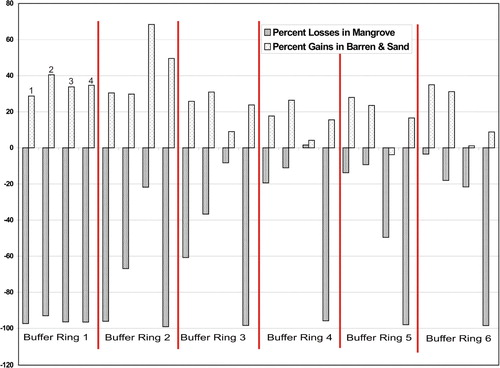
Overall, the percentage change of barren and sand land cover classes in the Mid (recorded more gains) and Lower-South Regions ranged from 9% to 50%, averaging at 28%. For the North and Upper-South (recorded smaller gains) regions, the range was from minus 4% to 68%, averaging at 23%, with the exception of one high value of 68%; all the other gains were lower than 35%. The severity of the damage is thus further confirmed in the Mid and Lower-South regions, which reportedly had lower mangrove coverage in pre-tsunami period.
3.3 Chi-square analysis of effects on mangrove
shows a chi-square distribution comparing the presence of mangroves before and after the 2004 tsunami event, the North and Upper South are statistically significant (χ2 test, d.f.=5, P<0.001). shows a chi-square distribution comparing the relative presence of mangroves to geographic proximity in areas close to the coastline and areas located farther away before and after the 2004 tsunami, again the North and Upper South are statistically significant (χ2 test, d.f.=9, P<0.001). The data shows that there were statistically significant spatial relationships between the presence of mangrove and 2004 tsunami. Geographic locations with large mangrove forest areas had a low impact from tsunamis and vice versa. This finding strongly suggests that there was less or no damage caused by the tsunami in areas with mangrove vegetation cover, and non-mangrove cover locations experienced a very serious impact from the tsunami.
Table 4. Chi-Square distribution comparing the presence of mangroves before and after the 2004 tsunami event.
Table 5. Chi-square distribution comparing the relative presence of mangroves to geographic proximity in areas close to the coastline and areas located farther away before and after the 2004 tsunami.
4. Discussion and conclusion
Findings from this study support the proposition that mangrove vegetation plays a key role in protecting coastal shorelines and ecosystem against extreme tsunami event. The results reported in this study are consistent with several studies (Daudouh-Guebas et al. Citation2005, Ramachandran et al. Citation2005, Danielson et al. Citation2005, Chang et al. Citation2006, Daudouh-Guebas et al. 2006, Chatenoux and Peduzzi Citation2007, Sirikulchayanon et al. Citation2008, Bahuguna et al. Citation2008, Yanagisawa et al. Citation2009), which confirm the usefulness of the mangrove vegetation.
In this study, we presented the evidence to show the effectiveness and buffering functions of mangrove forests for tsunami damage mitigation, through the analysis of pre- and post-tsunami satellite images, by focusing on land cover change owing to inland penetration of the 2004 Indian Ocean tsunami. GIS and remote sensing techniques in combination with the chi-square statistical analyses have provided critical data from land cover change to further confirm previous findings reported elsewhere. In comparing the presence of mangrove forests and barren and sand land cover categories before and after, there are positive linear relationships suggesting a loss of mangrove resulted in a gain of barren and sand land cover as a result of a devastating impact from the 2004 tsunami event. Simply put ‘there were significant change of mangrove forest (decrease) and barren and sand areas (increase) in our land cover classification analyses that imply the impact of tsunami on the coastal area in Thailand’. These findings do not only highlight the role of modern geographic technologies in assisting us to understand complex ecological systems and patterns along the coast, but also show that large mangrove forest areas led to lower damage from tsunami.
The data show how mangrove vegetation helped to diminish the 2004 tsunami effects. For example, geographic locations with large mangrove vegetation (areas behind mangrove patches) had less damage in comparison with those without it. We also observed notable spatial differences in locations with mangrove vegetation and those without it in relation to tsunami based on change detection. The data noticeably show highly increasing number of barren and sand land in the regions that were barely covered by mangrove. The damage radically reduced in areas with dense mangrove cover. We may conclude that the higher the mangrove forest area, the lower damage from the tsunami effect, but we can not completely rule out the role played by local geomorphological factors and coastal settings in the determination of incoming wave force.
The distribution of mangrove appears to minimise the damage from the 2004 tsunami starting from the distances farther than 500 m or buffer zone 2 from the coastline. The river mouth profiles and dense mangrove trees along the riverbank in the North and Upper-South may have influenced inland penetration of tsunami waves and inundations in some buffer zones. For instance, the reduction of percent gains of barren and sand land in buffer rings 4 to 6 in Upper-South may in part be owing to inland tsunami penetration through the river mouth as shown by a significant loss of mangrove in buffer ring 1. Also, the marked variations and differential tsunami inundations leading to percent gains or losses in the barren and sand land cover categories in the North and Upper-South could in part be owing to the extreme nature of hydrodynamic force of tsunami, human features, coastal geometry and geomorphological features, including the presence of coral reefs offshore and local topography (Yanagisawa et al. Citation2009). From their study, they observed that no mitigation effect of mangrove can be expected under the extreme strength of tsunami force.
In another study, Chang et al. (Citation2006) analysed remote sensing images of predisaster mangrove change and postdisaster structural damage and landscape changes using field data samples collected over five sites. In Yanagisawa et al. (Citation2009) study, the analysis of mangrove forest of Rhizophora species and stem diameter showed how they can reduce the tsunami inundation. Both studies reported similar patterns of damage and change with field data measurements. In fact, sample data revealed similar tsunami exposure suggesting that the presence of healthy mangroves did afford substantial protection. Overall, sample data collected from villages with mangrove vegetation indicated less damage, while areas without mangrove protection were literally damaged.
This study has further determined the significance of mangrove ecosystem as a shoreline protector. The findings in this study together with previous studies illustrate the key role played by coastal ecosystems, especially mangrove vegetation in protecting landscape changes during the 2004 tsunami event. We recommend further research in simulation studies using physical engineering approaches to determine the strength of hydrodynamics of mangrove ecosystems and tidal waves. Public awareness campaigns should be undertaken for communities residing along coastal areas to highlight the need to restore, replant and manage mangrove vegetation for the protection of their environment against future disasters. A good starting point for such efforts should be informed by the work of Bosire et al. on the benefits, restoration, and management of mangrove systems (Kairo et al. Citation2001, Vasconcelos et al. Citation2002, Bird et al. Citation2004, Bosire et al. Citation2004, Bosire et al. Citation2005, Bosire et al. Citation2006). An earlier study on management of mangrove exploitation in Indonesia could also be informative (Burbridge Citation1982) and may be relevant in showcasing the significance of mangroves. Bosire and many others observe that mangroves are among the most productive ecosystems, offering a wide range of resources and services that include habitat stabilisation and a breeding ground for many fish species, thus there is a need to pay critical attention to them.
Notes on contributors
Dr. Tonny Oyana is an Associate Professor and Graduate Program Director at the Southern Illinois University, Carbondale, where he teaches Geographic Information Systems (GIS), GIScience, Cartography and Geographic Visualization courses, among others. Dr. Oyana earned his Doctorate of Philosophy in Geography with a concentration in GIS at the State University of New York at Buffalo; Master of Science in GIS at the National University of Ireland; and Bachelor of Science with Education at the University of Dar-es-Salaam, Tanzania. Dr. Oyana is a perennial GIScience research scientist with a major focus on two central research interests. First, Dr. Oyana's research interests primarily focus on spatial and GIS analysis of diseases derived from different aspects of the environment. Second, Dr. Oyana has strong interests in advancing the field of GIScience with mathematical analysis through algorithm development for geographic pattern exploration, identification, and analysis using clustering algorithms.
Dr. Wanxiao Sun is an Assistant Professor in remote sensing and GIS in the Department of Geography and Planning, Grand Valley State University, Michigan, U.S.A. She received a Ph.D. degree in remote sensing and GIS from the University of Mainz, Germany, an M.S. degree in remote sensing and GIS from the Chinese Academy of Sciences, and a B.S. degree in computer assisted cartography from Nanjing University, China. She was a Postdoctoral Researcher in the Department of Environmental Science, Policy & Management, at University of California, Berkeley. Her current research interests include image classification and feature extraction algorithms, information fusion of multiresolution data, the integration of remote sensing and GIS techniques in environmental studies such as land use land cover change and mapping of plant functional types, and 3D visualization and simulation.
Ms. Poonthip Sirikulchayanon is a Research Fellow affiliated with the Advanced Geospatial Analysis Laboratory, Southern Illinois University, Carbondale. She earned her Master of Science in GIS at the Southern Illinois University and Bachelor of Science in Environmental Science at the Thammasat University, Bangkok, Thailand.
References
- Adams , B.J. , et al. , 2006 . Application of Landsat 5 & high-resolution optical satellite imagery to investigate urban tsunami damage in Thailand as a function of pre-tsunami environmental degradation [online]. University at Buffalo. Available from: http://mceer-nt2.mceer.buffalo.edu/Third_Workshop/papers/05Paper_Adams.pdf Accessed 18 September 2008 .
- Bahuguna , A. 2008 . Impact of the tsunami and earthquake of 26th December 2004 on the vital coastal ecosystems of the Andaman and Nicobar Islands assessed using RESOURCESAT AWiFS data . International Journal of Applied Earth Observation and Geoinformation , 10 : 229 – 237 .
- Baumann , P.R. 2005 . Post tsunami reconstruction: The Semen Andalas cement plant in Aceh, Indonesia . Geocarto International , 20 : 75 – 79 .
- Barbier , E.B. , 2006 . Mangrove dependency and the livelihoods of coastal communities in Thailand . In : C.T. Hoanh , T. P. Tuong , J.W. Gowing and B. Hardy Environment and Livelihoods in Tropical Coastal Zones: Managing Agriculture-Fishery-Aquaculture Conflicts . Wallingford, Oxford : CAB International , 126 – 139 .
- Bird , M. 2004 . Evolution of the Sungei Buloh–Kranji mangrove coast, Singapore . Applied Geography , 24 : 181 – 198 .
- Blasco , F. 1975 . The mangroves of India. Institut Français de Pondichéry, Pondicherry. Travail de la Section Scientifique et Technique . Pondicherry: All India Press , 14 : 1 – 175 .
- Blasco , F. 1984 . “ Climatic factors and the biology of mangrove plants ” . In The Mangrove ecosystem: research methods , Edited by: Snedaker , S.C. and Snedaker , J.G. 18 – 35 . Paris , , France : UNESCO .
- Blasco , F. 1998 . Recent advances in mangrove studies using remote sensing data . Marine and Freshwater Research , 49 ( 4 ) : 287 – 296 .
- Bosire , J.O. 2004 . Spatial variations in macrobenthic fauna recolonisation in a tropical mangrove bay . Biodiversity and Conservation , 13 : 1059 – 1074 .
- Bosire , J.O. 2005 . Predation on propagules regulates regeneration in a high-density reforested mangrove plantation . Marine Ecology Progress Series , 299 : 149 – 155 .
- Bosire , J.O. 2006 . Success rates of recruited tree species and their contribution to the structural development of reforested mangrove stands . Marine Ecology Progress Series , 325 : 85 – 91 .
- Burbridge , P.R. 1982 . Management of mangrove exploitation in Indonesia . Applied Geography , 2 ( 1 ) : 39 – 54 .
- Campbell , J. B. 2002 . Introduction to remote sensing , New York : The Guilford Press .
- Chang , K. 2008 . Introduction to geographic information systems , 4th ed , Boston : McGraw Hill Press .
- Chang , S. E. 2006 . Coastal ecosystems and tsunami protection after the December 2004 Indian ocean tsunami . Earthquake Spectra , 22 ( S3 ) : S863 – S887 .
- Chapman , V. J. 1976 . Mangrove vegetation , Vadaz : Cramer .
- Charuppat , T. and Charuppat , J. 1997 . Application of landsat-5 TM of monitoring the changes of mangrove forest area in Thailand , Bangkok , , Thailand : Forest technical division, Royal Forest Department .
- Chatenoux , B. and Peduzzi , P. 2007 . Impacts from the 2004 Indian Ocean Tsunami: analyzing the potential protecting role of environmental features . Natural Hazards , 40 : 289 – 304 .
- Danielson , F. 2005 . The Asian Tsunami: A Protective Role for Coastal Vegetation . Science , 310 : 643
- Daudouh-Guebas , F. , 2001 . Mangrove vegetation structure dynamics and regeneration . Thesis (PhD). Vrije Universiteit Brussel, Belgium .
- Daudouh-Guebas , F. , 2002 . The use of remote sensing and GIS in the sustainable management of tropical coastal ecosystems . In : F. Daudouh-Guebas Remote sensing and GIS in the sustainable management of tropical coastal ecosystems, Environment, Development and Sustainability . Dordrecht , , The Netherlands : Kluwer Academic Publishers , 4 , 93 – 112 .
- Daudouh-Guebas , F. et al. , 2002 . Recent changes in land-use in the Pambala –Chilaw lagoon complex (Sri Lanka) investigated using remote sensing and GIS: conservation of mangroves vs. development of shrimp farming . In : F. Daudouh-Guebas Remote sensing and GIS in the sustainable management of tropical coastal ecosystems, Environment, Development and Sustainability . Dordrecht , , The Netherlands : Kluwer Academic Publishers , 4 , 185 – 200 .
- Daudouh-Guebas , F. 2005 . How effective were mangroves as a defence against the recent tsunami? . Current Biology , 15 ( 12 ) : R443 – R447 .
- Daudouh-Guebas , F. 2006 . “ Mangrove forests and tsunami protection ” . In 2006 McGraw-Hill Yearbook of Science & Technology , 187 – 191 . New York , , USA : McGraw-Hill Professional .
- Duke , N. C. , Ball , M. C. and Ellison , J. C. 1998 . Factor influencing biodiversity and distributional gradients in mangroves . Global Ecology and Biogeography Letters , 7 : 27 – 47 .
- Giri , C. 2008 . Mangrove forest distributions and dynamics (1975–2005) of the tsunami-affected region of Asia . Journal of Biogeography , 35 : 519 – 528 .
- Green , E.P. 1998 . Remote sensing techniques for mangrove mapping . International Journal of Remote Sensing , 19 ( 5 ) : 935 – 956 .
- Hograth , P. J. 1999 . The biology of mangroves , New York : Oxford University Press .
- Janssen , R. and Padilla , J. 1999 . Preservation or conservation? Valuation and evaluation of a mangrove forest in the Philippines . Environmental and Resource Economics , 14 ( 3 ) : 297 – 331 .
- Kairo , J.G. 2001 . Restoration and management of mangrove systems—a lesson for and from the East African region . South African Journal of Botany , 67 : 383 – 389 .
- Kathiresan , K. and Bingham , B.L. 2001 . Biology of mangroves and mangrove ecosystems . Advances in Marine Biology , 40 : 81 – 251 .
- Kathiresan , K. and Rajendran , N. 2005 . Coastal mangrove forests mitigated tsunami . Estuarine, Coastal and Shelf Science , 65 : 601 – 606 .
- Khemnark , C. , 1995 . Ecology and management of mangrove restoration and regeneration in east and southeast Asia . In : Proceedings of the Ecotone IV , Surat thani, Thailand, 18–22 January 1995 . Bangkok : Amarin Co. Ltd .
- Leica Geosystems , GIS and Mapping , LLC . 2003 . ERDAS Field Guide , 7th ed , Atlanta , , Georgia : Leica Geosystems GIS & Mapping, LLC .
- Mazda , Y. 1997 . Mangroves as a coastal protection from waves in the Tong King Delta, Vietnam . Mangroves and Salt Marshes , 1 : 127 – 135 .
- Nayak , S. and Bahuguna , A. 2001 . Application of remote sensing data to monitor mangroves and other coastal vegetation of India . Indian Journal of Marine Sciences , 30 ( 4 ) : 195 – 213 .
- Pearce , F. 1999 . An unnatural disaster – clearing India's mangrove forests have left the coast defenseless . New Scientist , 164 : 12
- Plathong , J. and Sitthirach , N. 1998 . Status of mangrove forests in Peninsular Thailand , Thailand : Hat Yai Wetland International – Thailand Programme Publication No. 5 .
- Ramachandran , S. 1998 . ‘Application of remote sensing and GIS to coastal wetland ecology of Tamil Nadu and Andaman and Nicobar group of islands with special reference to mangroves’ . Current Science , 75 ( 3 ) : 236 – 244 .
- Ramachandran , S. 2005 . Ecological impact of tsuanami on Nicobar islands (Camorta, Katchal, Nancowry, and Trinkat) . Current Science , 89 ( 1 ) : 195 – 200 .
- Robertson , A. I. and Alongi , D. M. 1992 . “ Food chains and carbon fluxes ” . In Tropical mangrove ecosystems , Edited by: Robertson , A. I. and Alongi , D. M. Washington, DC , , USA : American Geophysical Union .
- Rönnbäck , P. 1999 . The ecological basis for economic value of seafood production supported by mangrove ecosystems . Ecological Economics , 29 : 235 – 252 .
- Ruitenbeek , H.J. 1994 . Modeling economy – ecology linkages in mangroves: economic evidence for promoting conservation in Bintuni Bay, Indonesia . Ecological Economics , 10 : 233 – 247 .
- Saenger , P. 2002 . Mangrove Ecology, Silviculture and Conservation , Dordrecht , , The Netherlands : Kluwer Academic Publishers .
- Saenger , P. , Hegeri , E. J. and Davis , J. D. 1983 . Global status of mangrove ecosystems . The Enviromentalist , 3 : 1 – 88 .
- Saravanan , K. R. 2005 . A study on the diversity and management of Pondicherry mangroves , Project Report, Pondicherry Central University. India .
- Sathirathai , S. and Barbier , E. B. 2001 . Valuing mangrove conservation in Southern Thailand . Contemporary Economic Policy , 19 ( 2 ) : 109 – 122 .
- Sirikulchayanon , P. , Sun , W. and Oyana , T. J. 2008 . Assessing the impacts of the 2004 tsunami on mangroves using remote sensing and GIS techniques . International Journal of Remote Sensing , 29 ( 12 ) : 3553 – 3576 .
- Spalding , M. , Blasco , F. and Field , C. 1997 . World Mangrove Atlas , International Society for Mangrove Ecosystems, Okinawa, Japan .
- Sremongkontip , S. , Hussain , Y. A. , and Groenindijk , L. , 1997 . Mangrove forest rehabilitation and management in Phang Nga Bay, southern Thailand using remotely sensed data and GIS [online]. GIS Development. Available from: http://www.gisdevelopment.net/aars/acrs/1997/ts7/ts7002pf.htm [Accessed 18 September 2008) .
- Sun , W. 2004 . Land-use classification using high resolution satellite imagery: a new information fusion method: an application in Landau, Germany , Mainz , , Germany : Johannes Gutenberg University Mainz Press .
- UNEP , 2005 . National rapid environmental assessment – Thailand [online]. The United Nations Environmental Program (UNEP). Available from: http://postconflict.unep.ch/publications/dmb_tsunami.pdf [Accessed 18 September 2008] .
- Vasconcelos , M.J.P. 2002 . Land cover change in two protected areas of Guinea-Bissau (1956–1998) . Applied Geography , 22 : 139 – 156 .
- Ward , S.N. and Asphaug , E. 2002 . Impact tsunami—Eltanin . Deep-Sea Research II , 49 : 1073 – 1079 .
- Yanagisawa , H. 2009 . The reduction effects of mangrove forest on a tsunami based on field surveys at Pakarang Cape, Thailand and numerical analysis . Estuarine, Coastal and Shelf Science , 81 : 27 – 37 .