Abstract
Crisis and disaster management has become an important research field in GIS during recent years. Risk assessment and situation picture-related work are particularly important areas of interest. There are distinct phases in different crises; these can be roughly divided into mitigation, preparedness, response, and recovery. In this paper a general classification of methods in each phase is given with examples on recent or ongoing research projects. The framework is based on literature and experiences from crisis and disaster-related exercises. Three case studies are based on those exercises. The goal is to clarify the role and usability of various GI-supported methods in the crisis management process by outlining a theoretical framework and presenting examples of the developed methods. Continuously increasing amount of spatially related geographic information is a huge potential to the GI analysis and modeling methods; the concept of digital earth is the underlying mainstream that gives lots of promise to the research and development work in this field.
Introduction
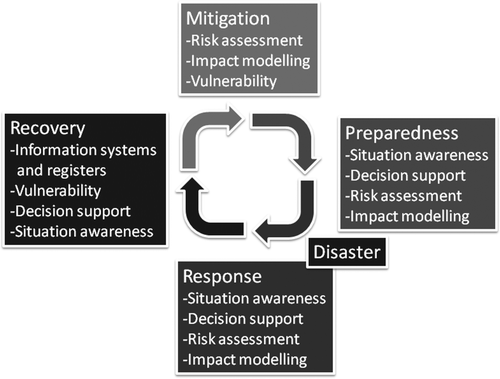
Crisis and disaster management can be outlined as a process in which mitigation, preparedness before the crisis, operational response activities during the crisis, and recovery of the society after the crisis are the main phases. (Godschalk Citation1991, Cova Citation1999) In all of these phases, Geographic Information, analysis, and modeling as well as geovisualization play a major role. However, it is not clear which methods can offer the best support for information processing in the various phases of crisis – crises also vary from one type to another and may have different requirements. In this paper, our goal is to give a theoretical framework of GI-supported methods that can be used for different tasks in various crisis and disaster management missions. Since the recovery phase differs greatly from the other phases, we only comment briefly on its potential characteristics and supporting methods. A classification of crisis management types has been proposed in our earlier work (Seppänen et al. Citation2007) and the work has now been accomplished using this framework of methods. Our focus is on risk and vulnerability assessment, on cooperation and communication by using situation picture applications, and on GI-supported decision-making tools. The information needs for different crisis management situations are gathered from three different types of crisis management exercises. The information needs have been analyzed by observing and by making process descriptions and analyses from response efforts. The experiences on the use of different analysis and visualization methods have been gathered from several recent research projects and in this paper we refer to several projects undertaken by the Research Group of Geoinformatics and Cartography at Helsinki University of Technology (GCG/TKK).
Overview of GI-supported methods
In the various phases of a crisis, certain types of support methods are more useful than others. Below are listed areas that are important, based on literature and experience from attended crisis exercises. Some examples are also provided on how a certain method is applied in a certain problem type. A table is then generated that combines the phases of a crisis with the different method types.
Probability-based risk assessment
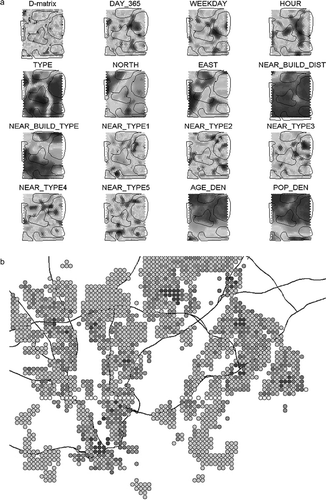
Risk can be evaluated by the product of the likelihood of occurrence and the impact severity of the occurrence of the event (Ayyub Citation2003). In this approach to risk assessment, it is assumed that the probability of the event can be estimated and the consequences are tangible (economical). Spatio-temporal data can be analyzed by various spatio-statistical and spatial data mining methods, and the so-called location prediction problem of the event in question can be solved. In location prediction the goal is to identify the independent variables, which can be used for predicting the place and time of the dependent variable (Shekhar and Chawla 2003). Spatio-statistical analyses reveal spatio-temporal correlations between variables (Špatenková and Stein Citation2010). Among spatial data mining, this problem can be solved by applying classification type methods, like linear and spatial regression models, extended by a simple Spatial Autoregression Model or a Bayes-based model, a Geographically Weighted Regression Model (GWR), Self Organizing Map (SOM), and Association Rules (Shekhar and Chawla Citation2003). Špatenková and Stein (Citation2010) have tested various statistical and mining methods in order to identify the best predicting variables for incident risk models. They analyzed among others GWR and SOM and found them to be the most useful methods. GWR reveals the spatially varying independent variables for the models and produces several local models instead of a global one. By using SOM the spatio-temporal relationships between variables can be analyzed and ideas about possible correlations can be created. illustrates GWR about incidents and social attributes in the Helsinki area and SOM analysis of incident and other spatio-temporal data. Geovisualization can be used as a helpful tool before and after using the previous methods; for example, clustering risk hotspots can be visualized in density maps (Kernel densities) and used in map overlaying (Špatenková and Krisp Citation2007). By using the previous methods the spatio-temporal relationships can be identified and even proved by statistical analyses. These results can then be applied in the risk models as such.
Figure 1. (a) Geographically weighted regression model about incidents and social attributes in Helsinki (modified from Špatenková Citation2009). (b) SOM analysis on incidents (Špatenková Citation2009).
Impact models
In addition to the likelihood of the events like incidents also their consequences must be analyzed. For consequences similar statistical methods as to the explanatory variables can be applied. However, in many cases statistics about the events – and especially the consequences – are not available. The incident may happen very seldom or hopefully never, and the approach to assessing this kind of risk cannot be based on probabilities but on analysis of the event in question, with special emphasis on the impacts and preparedness for the possible effects of the event. Effects can be developed in impact models: models of blast in case of bombs or explosions (Ahola et al. 2007), meteorological models of dispersion in case of a chemical incident combined with spatio-temporal population model (Zhang Citation2009), seismological models of earthquakes or DEM-based models of floods (Veijalainen Citation2008) or land erosion. Impact models can be detailed models developed by experts but most often the useful models are strongly simplified models that aim to define the geographical extent and possible magnitude zones of the effect. For example the blast model depicting the effects of bomb attacks in (a) is a very simplified model developed for rough estimates of the effects, for example the amount of injured people. The model calculates the effected area and the affected buildings, estimates the effects on the basis of the building material and then gives as a result an estimate of the effects on people. The amount of people is calculated by using a spatio-temporal population model that has been developed based on the municipal databases, interviews, and questionnaires (Ahola et al. Citation2007). Visualization of the geographical extent of the models is a simple but effective means for facilitating fast analysis of the scale of the consequences.
Figure 2. (a) Impact model of a blast wave (Ahola et al. 2007). (b) Spatio-temporal population model together with a dispersion model of a gas leak (Molarius et al. 2009, reprinted with permission from WIT press).
The example in (b) is from UHHA project (Molarius et al. Citation2009) in which a kind of alarming and warning system prototype was developed. The idea was to create a web-based service in which various institutes could offer their data and analysis services. The Finnish Meteorological Institute provided the dispersion model and the spatio-temporal model was developed into an improved version (Zhang et al. Citation2010). These models offer the possibility to estimate the amount of people in danger when the dangerous area depends on the weather conditions. By using this UHHA-application the potential consequences can be analyzed in advance. Models are in most cases created based on the expert knowledge and documentation. In developing these models spatio-temporal statistics and data mining are useful tools whenever proper statistics are available.
Vulnerability and the total consequences
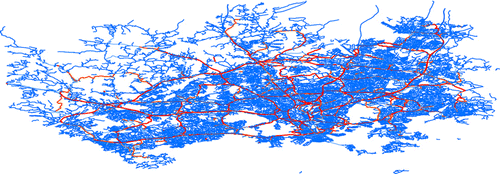
In addition to the probabilities of the threats as well as the impact models showing the consequences, vulnerability is an issue to be assessed. From the GI point of view, vulnerability analysis seems to be a potential and powerful tool in crisis management. Vulnerability can be defined as ‘a set of characteristics of the system/situation in question that creates the potential for harm’ (Sarewitz et al. Citation2003). Vulnerability affects both the probability of the event and the consequences but cannot be approached in a probabilistic way. Vulnerable parts of societies are: people; property; and environment. Assessment of the vulnerability requires analysis of these sub-systems and features; methods can be either analysis or modeling-based. Examples of these models are: spatio-temporal population models referred in the previous chapter (Ahola et al. 2007, Zhang 2009), graph-based analysis of robustness and resilience of a transportation network by using graph mining methods (Demsar et al. Citation2008), or a model of the shelter value of buildings (Ahola et al. 2007). For example graph vulnerability can be analyzed by applying graph theory and measures adopted from the analysis of social networks. Measures like betweenness, cut, and clustering coefficient describe the structure of the network and they can be utilized when the resilience of the network is important. According to the research made by Demsar et al. (Citation2008) betweenness seemed to be the strongest measure together with analysis of cut edges. The interpretation of betweenness in the case of transportation network is the major roads. Betweenness is calculated by summing up the amount of shortest paths passing by each edge in the network. In is an example of edges with high betweenness values matching with the main roads. If the network is then corrupted by attack or flood the new network can be created via replacing routes. Cut is an indicator for a potentially isolated part of the society; for example a bridge is a cut edge in a network. This kind of analysis work can be done in advance by using various models presented in the previous chapter. By combining impact models with analyses and models on vulnerability, the total consequences of the disaster can be simulated and estimated. For example, the number of people, buildings, and parts of the transportation network in the danger area can be calculated and the spatially varying need for evacuation or shelter in the area can be assessed (Veijalainen Citation2008, Zhang Citation2009).
Figure 3. Vulnerability analysis in the Helsinki area. Example of edges with high betweenness value matching with the main roads (Demsar et al. Citation2008, reprinted with permission from John Wiley & Sons Inc.).
Decision-making support
Rescue troop commanders need to make decisions: the immediate need for rescue of people (where, what kind, and how much?); the available evacuation routes (outside the dangerous area, alternative best routes); and the buildings’ capacity to offer shelter against attacks, fragments, fire, or gas. Optimization methods can be used when decisions have to be made on specific problems on limited resources or best transportation paths. Lots of information has been created during the mitigation and preparedness phases, and their results can also be used in the response phase. Dynamic population model together with simple map overlay visualizations in the situation picture about locations of resources, victims to be rescued, optimum routes (Janlöv et al. Citation2005), and for example, safe and dangerous areas can be used. Efficient visualizations of correct information are the major concerns in decision support (Krisp Citation2006).
For decision-making several methods can also be combined. For example graph analysis and decision-making tool can be combined in order to add attribute data to the traditional graph analysis, which is basically topology oriented. In the recent research of Zhang and Virrantaus (Citation2010) these models are combined and a new type of decision-making tool has been created. This tool makes it possible for the user to analyze the decision to be made from both graph analysis (for example betweenness analysis of the vulnerability) and decision-making tool that adds attribute data. Analysis results based on various weighting (the importance of attribute data types) and also various opinions of experts can be taken into account. This research is documented in a conference article (Zhang and Virrantaus Citation2010).
Presentation of information
Information sharing is a multi-tier problem. Communication between actors in the crisis management mission can be approached on technical, social, semantic, and cognitive levels (Virrantaus et al. Citation2009).
On a cognitive level the visualization, map symbology, used pictograms, and the relationships between visualization, cultural and educational background of the map user is important. The understanding of the map message should not be in relation to any domain or culture. Also the visual perception of the map must be possible in different circumstances and scales. Visualization of the situation picture is important because various actors have to understand the message correctly and quickly. The role of the situation picture as the core tool in development and dissemination of shared situational awareness is essential. The situation picture must be well designed so that the information can be captured efficiently and correctly – and by all. Map symbols must be value-free and understandable to people of various educational and cultural backgrounds. An example of such a map symbol set was created by Korpi in order to be used in a multinational civilian crisis management exercise (Korpi Citation2008).
The semantic level in communication refers to the terms that are used in different domains. Harmonization of concepts and development of various ontologies make the semantic understanding possible between various domains enabling the use of domain specific terms. One recent work made on the ontologies for crisis management is documented in Latikka (Citation2008).
On a social level the communication process can be viewed as human process of networking with people that have similar interests, sharing goals, means of action, and views of the world. The available GI methods should encourage actors to interaction and system intelligent thinking and behavior (Mäkelä and Virrantaus Citation2008). Systems intelligence is defined as intelligent behavior in the context of complex systems involving interaction and feedback (Hämäläinen and Saarinen Citation2010). Actors should understand the type and structure of the crisis process as well as their own role in this process. It is typical that most actors are well familiar with their own activities as well as processes but in most cases they are totally unfamiliar with the processes of other actors. Police, Fire and Rescue, Red Cross, Red Half Moon, Military, and Governmental actors are trained to act in their own organization but not in cooperation with others. This is the biggest challenge of the GIS-based situation picture application as well as the related communication and networking tools. The situation picture with communication capabilities can offer the separate parties an opportunity to realize the network of actors and enables them to behave as the parts of an integrated system. The message of the system intelligent approach to crisis management is, to support people's interactivity and system understanding during the response phase of the crisis (Mäkelä and Virrantaus Citation2008). This can also be called process awareness among the actors and it can be supported by documented process descriptions and related training (Valtonen and Seppänen Citation2008). Knowing the processes is the starting point of cooperation but it is also the starting point of the use of any information processing methods; process descriptions make the base for the framework of methods. Processes and user requirements are the basis in developing solutions for effective cooperation.
The last level in communication is the technical level and the development of different software tools for situation picture as well as the analysis of the data available. This area is well represented by the commercial and research software development field. To mention one example, SHIFT (Shared Information Framework and Technology; Vesterinen Citation2008) was an attempt to integrate various tools required in the communication in a multi-actor crisis management mission. The previously mentioned examples on map symbology and ontology were carried out as subparts of SHIFT-development. The attempts to utilize some analysis methods to support decision-making in this context were absolutely rejected because of the lack of trust against models and analysis methods that might include some value-dependent weights. The development of so-called white-box analysis methods, which are totally user controlled and as such may be trusted by all, is an important topic. For these kinds of methods special algorithms as well as various kinds of interactive visualizations are required (Nikander and Virrantaus Citation2009).
Framework of methods
In our framework, the emphasis is on the GI tools and methods that can be used during the phases of mitigation and response. The suggested methods are, as presented above: risk assessment by spatial data analysis and mining methods, impact assessment by models based on analyzed data, vulnerability assessment by using spatial models and spatial data analysis and mining methods, decision support based on risk assessment, and optimization and situation picture as the core tools in developing shared situational awareness. The introduced methods are different and it is important to know which kinds of problems they can solve. For example, spatio-statistical analysis can be straightforwardly applied and the process is clear: hypothesis; analysis; test; and interpretation of results. In spatial data mining the process is not that well defined; the method is data driven and the user is advised to apply the methods to ‘extract’ knowledge. When there is no hypothesis to test, the user needs to have an understanding of the problem and the related system. He/she needs to know what kind of problem he/she is going to solve and what kind of knowledge he/she needs in this problem solving. This can be called system awareness or the ‘big picture.’ The framework, which we present in this paper, is a part of this system awareness.
For developing the framework of methods, we use in which the presented methods have been organized together with the crisis phases. This Table is applied in three cases, which we have analyzed as a part of our recent research (Seppänen et al. Citation2007, Valtonen and Seppänen Citation2008).
Table 1. Different phases of crisis with the classification of methods.
Cases – the materials from crisis-related exercises
In order to apply the right methods and analyses, the domain in which they are applied needs to be studied thoroughly. This includes participating in several crisis management exercises and describing the possible operative response processes so that essential information and cooperation needs are met. Materials in this research were collected from three experimentations and exercises in which we have participated as observers or analysts. The cases are: SAR 07 & Barents Recue 07; MNE5; and EK08. Each case has a different scenario with unique characteristics. The cases represent different types of crisis and thus, most likely, also have different requirements for information processing methods.
SAR 07 & Barents Rescue 07
SAR 07 was a Search And Rescue exercise in Helsinki-Vantaa Airport. Its focus was on improving the rescue response and inter-agency cooperation. In the scenario, a passenger plane taking off collided with another passenger plane. In Barents Rescue 07 exercise the scenario involved a passenger plane making a crash landing in remote area in northern Finland. The combination of the remote location, limited rescue resources, and hundreds of passengers made this scenario unique and challenging. Plane accidents are rare but when they occur the consequences are major. Despite the rareness of these kinds of accidents they do happen eventually. The problem is that the means to prevent them from happening are not known or they are limited. From the exercise point of view, actions that would prevent the accident from happening are taken already elsewhere, such as legislations and technological quality control. The recovery phase on the other hand is not time critical in the sense of saving lives compared to the response phase. Hence the SAR exercise focuses on the preparedness phase so that the response would be as effective as possible. The SAR organization consists of Fire and Rescue, Police, Health care, and other agencies and organizations. Efficient response requires fluent inter-agency cooperation. In order to find supporting GI methods, critical information and so-called hot spots in cooperation need to be recognized. We described the operation processes in this exercise in order to specify the information needs in such a case (Valtonen and Seppänen Citation2008). Based on critical information study it can be further studied how different information types should be communicated among actors.
Based on the exercises we found out that no inter-agency operational level situation picture was used. Each actor used their own systems with no or minimal integration with others. Only experience and training of such situations supported the comprehension of how this type of situation progresses, who is involved in different phases of action, who to contact and what is the status of the operation. Even with careful planning the operations had activities that had been done already by some other actor previously ().
Table 2. The focus of the SAR exercise was on decision support and situation awareness.
In order to coordinate activities and share information efficiently an operational level situation picture is essential. Methods needed range from planning the rescue efforts into managing the resources and presenting the needed information. Visualization of critical targets, such as gas stations, chemical tanks, and groundwater areas, as well as infrastructure networks, such as major telecommunications cables, power, and water distribution network, help in perceiving what are the needed additional actions. Pre-processed analyses on cross-country mobility and dynamic population models help in planning the rescue efforts. Season specific cross-country mobility analysis helps in planning how vehicles can reach a site that is in difficult terrain with a poor road network. Dynamic population models offer assistance in case of casualty estimation and evacuation planning. Dispersion analysis on the other hand serves the needs of oil leakage or chemical release spread estimation. Even though rescue units are not managed in an operational level, planning and presentation of route optimization, reach analysis and patient logistics between the accident site, triage site and hospitals can be illustrated.
MNE 5
MNE5 stands for Multinational Experiment 5 led by the United States Joint Forces Command. The MNE5 community consists of several members and observing countries. MNE is an experimentation that creates scenario-related proof of concepts and studies different action patterns, from which some might evolve into further development for field use. The scenario was set in sub-Saharan Africa and involved a natural and human crisis that required aid and response from the international community. The probability of a large-scale crisis can be considered low but when happening it has vast consequences. Since the cause–effect relations are complex, the crisis is hard to predict, and furthermore, the possibilities of affecting these relations are limited or even unknown. The timescale of the crisis ranges from months to years and it often involves actors from various organizations and cultures.
The stress on these kinds of crises should be on the mitigation phase, since once it escalates the right means for the response is very limited. In the mitigation and preparedness phase, early warning systems, predictive models, trend models, critical changes and such needs to be followed. For the response phase, Finland developed a proof-of-concept called SHIFT that enables information sharing among government, non-government, private and local crisis response actors (Vesterinen Citation2008). The situation picture is in an essential role again but the information presented needs to be culture-free and fact-based to avoid misinterpretations. Successful cooperation, good means of communication, as well as sharing safety and security information play an important role ().
Table 3. The MNE5 experiment focused on comprehensive use of different means.
Risk assessment involves early warning data mining with different use of statistics and spatial data mining tools for predicting potential locations of crises and risk areas. These methods include for example spatial autoregression, geographically weighted regression, SOM, and detecting anomalies. Data mining can be done for example with socioeconomical data to find relationships with previous crisis or incidents as well as reveal non-regular behavior and detect abnormal situations already in the early stage. Impact modeling and vulnerability analysis may include the assessment of migration and the impacts as well as the vulnerabilities caused by the mass movement. Network analysis and population models can also assist the planning of the aid efforts. The technical details of the situation picture include user defined filters to find the relevant actor specific information, network building tools, value-free information presentation and other details that foster the information sharing among different actors involved.
EK 08
EK08 exercises scenario challenged involved agencies to respond to an emergency caused by a fierce snowstorm in South Eastern Finland. Such weather phenomena have become more frequent but they can be predicted for at least a few days at a time. The consequences depend on the area and the time of day or week it strikes. The difficult feature in weather phenomena is that the possibilities of affecting it are minimal.
The area that the exercise scenario covered has long distances and the population density is fairly low, except for some population centers. The most effective way to minimize the consequences is to identify the vulnerability of the people and the infrastructure network. This involves mainly roads, power lines and water supply and sewerage. If a great number of vulnerable people – old people, children, the sick, or handicapped – happen to be located in difficult places to reach and roads are blocked, there has to be some maintenance support performance so that a possible break in food or power delivery won't lead to evacuations. Similar situations happen, for example, in a chemical accident when people are inside a danger area affected by a gas leak. It is important to know where the most help and evacuation are required. Impact models related to weather and accidents play a core role. During the response phase, joint efforts are needed because of, for example, limited resources in snow plowing vehicles and power network repairing units. Decision support and situation awareness are emphasized in the response phase. Examples of decision support and situation awareness needs are resource optimization and timely situation picture ().
Table 4. The focus of the EK08 exercise was on minimizing the system vulnerability.
Examples on vulnerability analysis are network analysis for logistics as well as for power network. Location prediction of incidents based on weather and incident data may help in identifying risk hot spots. Dynamic population models with density visualization can help in possible case of evacuation planning in order to size up the stress areas.
Results
The mitigation phase is focused around risk assessment, impact modeling, and vulnerability analysis. Geographical locations of increased risk can be predicted by applying spatial data analysis and mining methods, as well as map visualizations. Impact models can model the effects of disasters like floods or earthquakes, hazardous materials hazards or terrorist bomb attacks on people, property and environment. The vulnerability of the society against which the threat is potentially focused can be analyzed; for example, the robustness and resilience of critical infrastructure can be revealed by graph mining methods; and dynamic distribution of the population can be modeled.
Preparedness includes exercising the response efforts if possible. The overall understanding of the response process and interdependencies between the main actors help them to be more agile and responsive in the course of action. Situation picture and communication between actors are in a crucial role here as well as decision-making tools. Risk assessment and impact modeling are also in an important role of planning the response efforts as well as their alternative plans.
During the operative response phase of a crisis, situation pictures and tools that support shared situation awareness among various actors and actor groups are of key importance. Operations can utilize many kinds of problem solving and decision support tools, such as route and resource allocation optimizing.
After the crisis, the recovery of the society can be supported with several technologies from GPS-positioning to cadastre and digital map databases. In this phase the main focus is in development of the regular information systems of the society and supporting the everyday life of people. In this research the recovery phase was not in focus and we did not have practical experiences of that ().
Figure 4. Different approaches in different phases (adapted from Cova 1999).
In a sudden event like a plane crash, efficient response is needed to minimize the consequences. This is achieved, for example, by activity process development, exercises, and training actors to act in a system intelligent way. The response phase requires a situation picture that uses symbols and information that all will understand in the same way. The analyses and visualizations should help in resources and logistics planning and management. The focus in this type of crisis is on preparedness phase because once it happens the only way to minimize losses is to respond effectively and in a coordinated manner.
The crisis can also develop slowly and be a combination of several causes like drought, epidemic, and inadequate first response that could lead to a refugee problem. The mitigation of the crisis is essential, as always. Useful methods for analyzing risk and vulnerabilities include trend analysis, mapping of risk hotspots, and such. When the response phase begins it often involves actors from different countries, organizations, and cultures. The situation picture could be used for sharing general information like safety and security but it would have to be presented in a culture-free fashion. The system used should allow a system intelligent approach so that different actors from different domain areas would be able to find cooperation and collaboration possibilities. The focus in this type of crisis is in the mitigation phase because since the crisis escalates there are very limited possibilities to affect it.
Preparing for extreme weather phenomena, like a very heavy snowstorm, includes mapping the risk areas from the maintenance support performance point of view, and identifying network vulnerabilities and possible needs for evacuation. During the response phase, a situation picture is used, for example, for resource allocation, response prioritization and as a communication tool between isolated areas. The main focus is on the preparedness phase since the phenomena cannot be prevented and only via effective preparedness negative outcomes can be minimized.
Conclusions
The development of digital world (Goodchild Citation2008) creates masses of data. That data should be managed and processed into information and knowledge in order to be used in the real processes. Crisis management is one example in which the use of all kinds of data from all over the world in all possible scales might be necessary. In the future not only GPS and other trackers and identifying technologies like RFID but also a kind of ‘digital skin’ on the Earth's surface created by a wireless sensor network (Luimula Citation2010) offers continuous and real-time data flow with global coverage. All this data is geographical. Thus the development of GI-supported methods is a core thing in utilizing these masses. In this paper some examples of recent research works have been presented and based on them a generic framework of their use in various steps in crisis management has been outlined. The work is continuing and new methods especially in spatial data mining and visual analytics are developed. All this makes our digital earth not only a sensor-based data storage but an intelligent information environment in which data is used and developed into geographical knowledge.
Notes on contributors
Hannes Seppa¨nen is a researcher in Geoinformatics and Cartography at Aalto University School of Science and Technology. He has an M.Sc in Engineering (Surveying) and he is currently undertaking his postgraduate studies. His main Field is geoinformatics and his research interests are situation awareness, situation picture, inter-agency cooperation, crisis management and decision-making.
Kirsi Virrantaus is a Professor in Geoinformatics and Cartogaphy at Aalto University School of Science and Technology. Sha has an M.Sc in Architecture and D.Sc in Engineering (Surveying). She is leading a Research Group on Geoinformatics and Cartography at Aalto University. The main research interests are spatial analysis, spatial data mining and knowledge discovery, spatial algorithms, computational methods, uncertainity and quality; main application field in research is situational awareness and supporting GIS technologies.
Acknowledgements
The Authors acknowledges the related work done by other research group members, especially Urska Demsar, Jari Korpi, Jaakko Latikka, Jaana Mäkelä Olga Špatenková, Antti Veijalainen, and Zhe Zhang.
Related Research Data
References
- Ahola , T. , et al. ., 2007 . A spatio-temporal population model to support risk assessment and damage analysis for decision-making . International Journal of Geographical Information Science (IJGIS) , 21 8 , 935 953 .
- Ayyub , B. 2003 . Risk analysis in engineering and economics , Boca Raton, FL : Chapman & Hall .
- Cova , T.J. 1999 . “ GIS in emergency management ” . In Geographical information systems , Edited by: Longley , P.A. , Goodchild , M.F. , Maguire , D.J. and Rhind , D.W. 845 – 858 . New York : John Wiley .
- Demsar , U. , Špatenková , O. and Virrantaus , K. 2008 . Identifying critical locations in a spatial network with graph theory . Transactions in GIS , 12 ( 1 ) : 61 – 82 .
- Godschalk , D. 1991 . “ Disaster mitigation and hazard management ” . In Emergency management: principles and practice for local government , Edited by: Drabek , T.E. and Hoetmer , G.J. 131 – 160 . Washington, DC : International City Management Association .
- Goodchild , M. 2008 . “ Geographic information science: The grand challenges ” . In The handbook of geographic information science , Edited by: Wilson , J.P. and Fotheringham , S. 596 – 608 . Malden, MA : Blackwell .
- Hämäläinen , R.P. and Saarinen , E. 2010 . Essays on systems intelligence , Espoo : Systems Analysis Laboratory, Aalto University, School of Sciences .
- Janlöv , M. , et al. ., 2005 . Developing military situation picture by spatial analysis and visualizations H. Hauska H. Tveite ScanGIS – the 10th Scandinavian research conference on geographical information science , 13–15 June 2005, Stockholm , Stockholm : Universitets-Service AB , 195 209
- Korpi , J. , 2008 . Designing pictorial symbols for situation pictures of international crisis management In : Cartography and art – symposiums , 1–2 February 2008, Vienna, CD
- Krisp , J. , 2006 . Geovisualization and knowledge discovery for decision-making in ecological network planning . Thesis (PhD). Helsinki University of Technology
- Latikka , J. , 2008 . Ontology for crisis management . Thesis (MSc). Aalto University School of Science and Technology
- Luimula , M. 2010 . Development and evaluation of the location-aware platform. Main characteristics in adaptable location-aware systems . Thesis (PhD). University of Oulu
- Mäkelä , J. Virrantaus , K. , 2008 . Shared situational awareness in civilian crisis management . In : Geographic information science, 5th international conference , 23–26 September 2008, Park City . New York : Springer , 275 278
- Molarius , R. , et al. ., 2009 . Assuring the information flow from accident sites to decision makers – a Finnish case study . In : K. Duncan and C.A. Brebbia Disaster management and human health risk-reducing risk, improving outcomes . Southampton : WIT Press , 416
- Nikander , J. Virrantaus , K. , 2009 . A new exploratory white-box method for spatial data analysis Cartography and geoinformatics for early warning and emergency management, joint symposium of ICA and JBGIS on cartography and geoinformatics for early warning and emergency management , 19–22 January 2009 , Masaryk University Prague , Prague , 458 465
- Sarewitz , D. , Pielke , R. and Keykhah , M. 2003 . Vulnerability and risk: some thoughts from a political and policy perspective . Risk Analysis , 23 ( 4 ) : 805 – 811 .
- Seppänen , H. , Krisp , J. , Virrantaus , K. , 2007 . Expanding the situation picture for the decision-maker with geographic information . XXIII international cartographic conference ICC , 4–10 August 2007, Moscow, CD
- Shekhar , S. and Chawla , S. 2003 . Spatial databases: a tour , Upper Saddle River, NJ : Prentice-Hall .
- Špatenková , O. Krisp , J. , 2007 . The use of contingency tables to value variables for special models . The 5th international symposium on spatial data quality , 13–15 June, Enschede. Available online at: http://www.itc.nl/ijjdq2007/proceedinoj/postersession/spatenkovakrisp%5B1%SD.pdf
- Špatenková , O. , 2009 . Discovering spatio-temporal relationships: a case study of risk modelling of domestic fires . Thesis (PhD), Helsinki University of Technology .
- Špatenková , O. and Stein , A. 2010 . Identifying factors of influence in the spatial distribution of domestic fires . International Journal of Geographical Information Science , 24 ( 6 ) : 841 – 858 .
- Valtonen , V. Seppänen , H. , 2008 . SAR-Prosessit (SAR processes) Helsinki : Maanpuolustuskorkeakoulu
- Veijalainen , A. , 2008 . Spatial approaches in responding to climate change emergencies – case study: Helsinki flooding . Thesis (MSc). Helsinki University of Technology
- Vesterinen , S. 2008 . SHIFT – Shared information framework and technology. Concept DRAFT version 0.5 , Helsinki : Finnish Defence University .
- Virrantaus , K. , Mäkelä , J. and Demsar , U. 2009 . “ Supporting the development of shared situational awareness for civilian crisis management with geographic information science – research plan ” . In Urban and regional data management , Edited by: Krek , A. , Rumor , M. , Zlatanova , S. and Fendel , E.M. 217 – 230 . London : Taylor & Francis .
- Zhang , Z. , 2009 . A spatio-temporal population model for alarming situation picture and warning system . Thesis (MSc). Helsinki University of Technology
- Zhang , Z. , Sunila , R. , Virrantaus , K. , 2010 . A spatio-temporal population model for alarming, situation picture and warning system . In : Joint international conference on theory, data handling and modelling in geoSpatial information science , 26–28th May 2010, Hong Kong
- Zhang , Z. Virrantaus , K. , 2010 . Analysis of vulnerability of road networks on the basis of graph topology and related attribute information . In : the 2nd international symposium on intelligent decision technologies , Baltimore , USA , 28–30 July 2010