Abstract
This paper presents the results of the application of mathematical morphology for the automatic quantification of the number of tents and the detection of changes in the Menik Farm IDP camp in Sri Lanka. The tents were retrieved using an area-constraint top-hat opening applied to WorldView-1 data. The counting of tents was based on the centroids of the automatically detected structures indicating an overall number of 25,150 tents on the 26 June 2009. The comparison with a visual interpretation produced an R 2 of 0.97 with an error of 1.25%. In addition, an automated detection of changes inside a camp area was conducted. The comparison of the satellite image of 26 June 2009 (WorldView-1) and an image of 28 February 2010 (GeoEye-1) is based on mutual (mixed) information metric, after using morphological image processing techniques and previously specified criterion. Changes are observed on a terrain of around 15.2% of the total camp area and 3813 of previously detected structures disappeared in a period of 8 months.
Introduction
Satellite-based image analysis is one of the few unbiased information sources in conflicts, in particular in civil wars. With the availability of commercial very high-resolution satellites, this source is also used by the humanitarian community. It is used in particular for the monitoring of refugees and Internally Displaced Persons (IDPs; Bjorgo Citation2000, Giada et al. Citation2003, Ehrlich et al. Citation2009, Kranz et al. Citation2009, Kemper et al. Citation2010). IDPs correspond to people forced to flee their homes but who, unlike refugees, remain within their country's borders. One of the weakest points in these crisis situations is typically the absence of reliable field information for calibration of the methodology and validation of the results. This is the case for most camps that are set up during or after violent conflicts, when the access to the areas is impossible due to security restrictions. When Kemper et al. (Citation2010), for example, estimated the number of IDP dwellings in several camps in Darfur, they were not able to conduct field surveys despite close cooperation with the World Food Program office in Al Geneina (Sudan) responsible for those camps. This paper discusses, based on a case study, the problems linked to the provision of information despite of the lack of ancillary information for calibration and validation. We will demonstrate how the careful application of state-of-the-art satellite data and methods may compensate this lack of field data.
In May 2009 ended one of the world's longest running civil wars, as Sri Lankan Government forces defeated the Liberation Tigers of Tamil Eelam (LTTE), which fought to create an independent Tamil state. With the intensification of the fighting towards the end of the conflict, several hundred thousand civilians became caught in the fighting and were forced to leave their homes. By late May 2009, approximately 300,000 people were detained in a large camp complex called Menik Farm, near the northern town of Vavuniya. Access to the camp was limited by the Sri Lankan Government, even for aid agencies. Consequently, the only figures on the number of IDPs available were provided by the government. In this situation, satellite-based assessments provided an independent view of the situation by first locating the IDP camps, secondly by estimating the number of tents. Since November 2009, increasing numbers of displaced people have been allowed to return home from the camps. UN figures indicate that until 6 May 2010, approximately 216,000 people have returned to their home areas or are staying with host families, and that there are now fewer than 73,000 people remaining in the camps in Vavuniya, Jaffna and Mannar (United Nations Office for the Coordination of Humanitarian Affairs [UNOCHA] Citation2010a). By monitoring the changes in the camp between June 2009 and February 2010, these figures could be verified again.
The following section of this paper will first describe the study area and the different data sets used before describing the methodology. After the presentation of the results, these will be discussed with a specific focus on the absence of ancillary information.
Study area and data sets
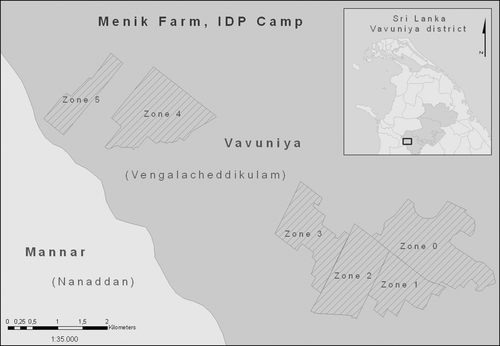
The case study is located in the South-west of the Vavuniya district, which is part of the Northern Province of Sri Lanka. In this district, the Sri Lankan Government had set up six camps in April to June 2009 to detain approximately 200,000 IDPs that fled the fighting zones ().
Figure 1. Location of the Menik Farm IDP camp in Vavuniya district, Sri Lanka.
For the identification of single dwellings, an appropriate spatial resolution is crucial. Therefore, very high-resolution satellite data were acquired with the WorldView-1 and GeoEye-1 satellites. The sensor and acquisition details are given in and . The GeoEye-1 image was acquired as a stereo-image, thus allowing the analysis of height information.
Table 1. List for very high-resolution satellites used in the analysis.
Table 2. Acquisition details for WorldView-1 and GeoEye-1 data.
Methodology
Following the pre-processing, the methodology relies on an initial qualitative characterisation of the tents. This characterisation is used for a visual interpretation of a representative sample and it is translated in terms of image processing transformations enabling the automatic extraction of these dwellings. After the acquisition of the stereo data, an automated change detection is performed to identify new and removed tents.
Pre-processing
The pre-processing took place in two steps. The first orthorectification of the images was based on Rational Functional Coefficients and the SRTM digital elevation model (DEM), whose height and positional accuracy are detailed in Rodríguez et al. (Citation2006a, Citationb). Approximately 8 months later, a stereo-acquisition with the GeoEye-1 satellite was successful. The same orthorectification procedure was applied to the GeoEye-1 data. However, the subsequent orthoimage comparison revealed a significant shift between both images, which would have limited the automated change detection. Consequently, the GeoEye-1 stereo-images were used to derive a surface/elevation model at 1 m spacing (hereafter called GeoEye DSM), which could substitute the coarse SRTM DEM in the orthorectification phase. In addition, the WorldView-1 scene was oriented using ground control points (GCPs) measured in the GeoEye-1 stereopair. The planimetric and height ground coordinates were calculated from the GeoEye RPC model. The advantage of this approach was to reference all the scenes used in this work to a common reference system in order to guarantee a relative orientation between them. Finally two orthoimages were produced using the GeoEye DSM, one from WorldView-1 scene and one from the GeoEye-1 scene acquired at 5:14 GMT, because its near-nadir acquisition angle was more suitable for orthoimage generation. The two orthoimages did not show any significant relative misalignment and could be used for the next operations.
Tents characterization
The WorldView-1 image used in the analysis consists of a panchromatic band at a spatial resolution of 0.5 m. Similarly to initial experiments performed on the Lukole refugee camp in Tanzania (Giada et al., Citation2003), the IDP tents in the Menik Farm IDP camp appear all as bright objects over a darker background. The following observations can be made:
| • | most tents appear as bright objects over a darker background; | ||||
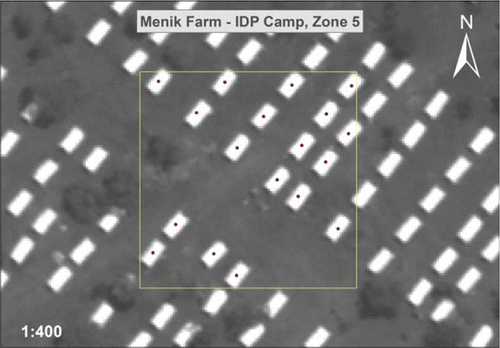
| • | in general, there are two groups of tents: elongated tents with a length to width ratio greater than 3/2 (), which are common for parts of Zones 0 and 1 of the camp and single family tents common in Zones 2–5 (); | ||||
| • | it is reasonable to consider that the footprint of a tent must be compact enough to contain a square of 2 m×2 m, i.e. 4×4 pixels. In addition, it is expected that its area does not exceed that of a square of side 15 m, i.e. 900 pixels; and | ||||
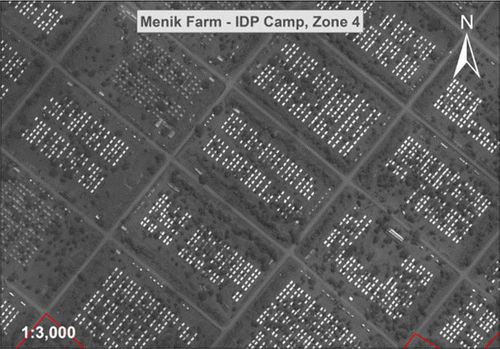
| • | tents are clustered within a series of compounds outlined by a regular net of roads and paths constructed inside each camp's zones (see ). The camp zones denominate separate fenced parts of the camp. | ||||
Figure 2. A sample of elongated camp structures. WorldView-1 imagery © Digitalglobe 2009, distributed by e-GEOS.
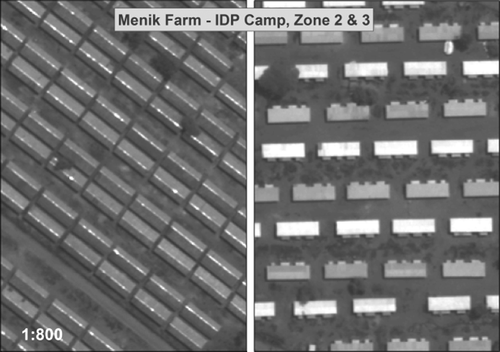
Figure 3. A sample of tents located inside Menik Farm IDP camp. WorldView-1 imagery © Digitalglobe 2009, distributed by e-GEOS.
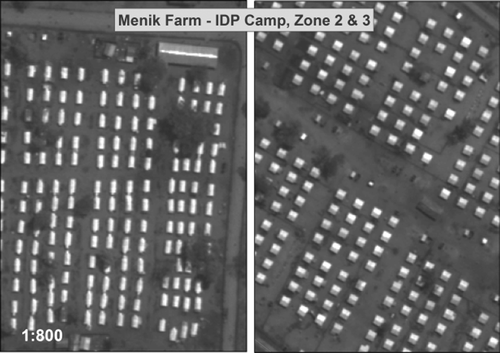
Figure 4. Presentation of the path's net constructed inside a Menik Farm IDP camp. WorldView-1 imagery © Digitalglobe 2009, distributed by e-GEOS.
Automatic identification of tents
For the automated retrieval of tents, an image processing chain has been set up. This extraction relies on the characterization of tents described in the previous section.
Morphological area opening (Soille Citation2003) is used to suppress all bright objects whose area is below a threshold value matching the area of the largest tents (maximum size criterion). These objects can then be revealed by computing the difference between the original and the transformed images. For the sake of simplicity and clarity, we limit our discussion here to the following essential processing steps:
| 1. | The operations start with an eight-connected area opening with an area of 900 pixels. This operation suppresses all bright objects with an extent less than 900 pixels, which includes all types of tents. | ||||
| 2. | The top-hat by eight-connected area opening with an area of 900 pixels, which is the arithmetic difference between input image and area opening of the input image, highlights all the bright structures in the image. | ||||
| 3. | This output is converted into a binary image with the values in a range 5–12 set to 1. This threshold was set interactively to maximize the contrast. | ||||
| 4. | Finally, the binary image was filtered using a size minimum criterion: each structure must contain at least 16 pixels. | ||||
Random sampling and visual interpretation
Visual interpretation was used for the verification of the results. Despite the lack of geo-referenced ground and aerial photographs, visual interpretation could be achieved without difficulty due to the uniform type of tents having the same size, reflectance and high contrast with surrounding in the camp. The process of visual analysis was performed on randomly selected samples spread over the camp area. For efficiency of the interpretation the camp's borders were identified using camp maps provided by UNOCHA (2010b). The camp area was overlaid with a grid of 50 m×50 m in order to select randomly representative group of data. illustrates the location of randomly selected cells. The visual counting of tents was based on the tents characterization described previously. As a final step, each individual tent was represented by a single central point and counted with the aid of GIS software ().
Figure 5. Presentation of the random selected samples within Menik Farm IDP Camp. WorldView-1 imagery © Digitalglobe 2009, distributed by e-GEOS.
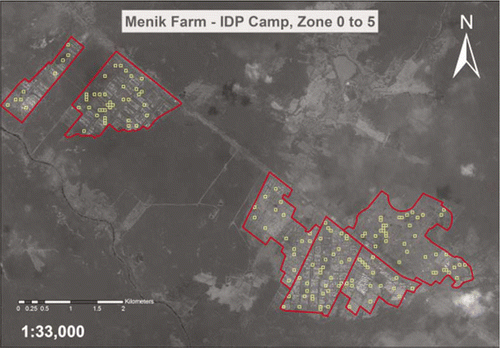
Figure 6. A randomly selected cell with tents marked as points in a visual interpretation process. WorldView-1 imagery © Digitalglobe 2009, distributed by e-GEOS.
Change detection
Following the acquisition of the GeoEye-1 data, it was feasible to analyse changes in the camps referring to either removal or construction of new structures. Change detection is one of the key techniques in satellite data analysis. Consequently many change indicators have been proposed in literature (Inglada and Mercier, Citation2007), most of them being based on the Change Vector Analysis paradigm. However, such indicators are unlikely to work when images are coming from different sources or were acquired in different illumination or atmospheric conditions.
Therefore, we applied the following approach combining geometrical features extraction with spatial context modelling using mutual information-based change indicators (Gueguen and Datcu, Citation2009). In a first step, the geometrical features are extracted in both images using top-hat area opening (Soille Citation2003). Then, the spatial context is modelled with a Gaussian distribution of unknown mean. As intermediate outputs, images of means are obtained through a low-pass filtering of the top-hat images. Then, a mutual information-based change indicator is computed at each location between the two mean images. Finally, the change image is derived using an automatically or interactively set threshold.
Results
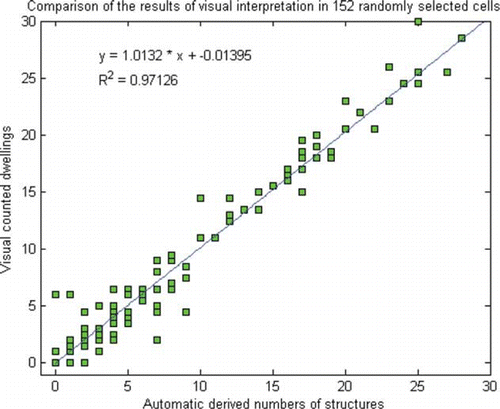
As mentioned in the introduction, there was no access to the IDP camp. Consequently, visual interpretation was the only available source of validation. It was supported by the analysis of pictures taken by relief organisations (e.g. UNHCR, UNOCHA) and press articles. These helped in describing properly the tents in the camps. For the random selection of cells, approximately 5% of the cells were selected leading to a total of 152 cells. Given the total number of 3047 cells, the error to be expected due to the sampling is ±1 tent at a confidence level of 95%. Due to the strong contrast of the bright tents, the visual interpretation was very simple compared to more complex situations as described by Kemper et al. (Citation2010) in IDP camps in Darfur/Sudan (). The total number of tent structures marked in the visual interpretation process of the randomly selected cells for all IDP camps was 1119 as indicated in the second column of . Likewise it was not necessary to combine an area opening and closing for the automated retrieval of structures. The top-hat area-opening identified the outline of the tent-structures sufficiently well (), which is in line with the observations made by Giada et al. (Citation2003) for the Lukole camp in Tanzania. In total 25,150 tents were counted; provides the numbers for each of the zones of the camp.
Figure 7. Randomly selected cell with tents extracted automatically and converted into the centroids.
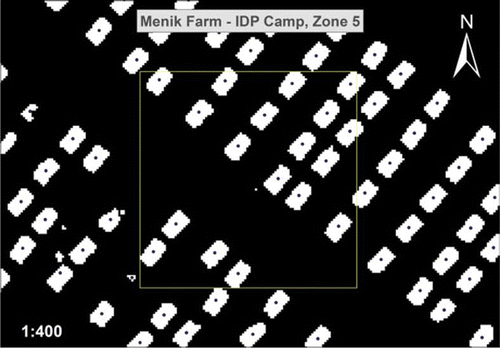
Table 3. Comparison of the number of tents derived from automatic analysis and from visual interpretation. Assessment based on satellite image acquired on 26 June 2009.
Table 4. Number of tents automatically extracted per each camp's zone. Analysis based on satellite image acquired on 26 June 2009 (WorldView-1).
The comparison of the number of tents from the visual interpretation and the automatically retrieved tents in the randomly selected cells is with 1119 and 1105, respectively, in very good agreement (). This corresponds to an underestimation of 1.25% in total in the automatically derived number compared to the visual interpretation. Also the scatterplot confirms this with an R 2 of 0.97 (). In addition, the spatial correspondence between automatically and visually detected tents is high. The analysis of the number of automatically detected tent centroids falling within less than 2 m from the visually defined tent centroids is 85%; up to 5 m it is 93%. There is some variation between the different zones ranging from an error of less than 1% in Zone 4 to more than 8% in Zone 1 (). This variation is caused by the different structure of the zones. Zone 0 is a very heterogeneous area with partly semi-permanent structures and partly scarcely built-up areas. Zone 1 is characterized by mainly large elongated tents, while the other Zones 2–5 consist predominantly of small single family tents with some community structures.
Figure 8. Comparison of results from visual interpretation and automated enumeration based on 152 randomly selected cells.
The purpose of the change detection between June 2009 and February 2010 was twofold. On the one hand, it was focusing on the identification of new structures or tents ( and ), on the other hand, and more important, was the identification of tents being removed ( and ), because until February 2010 the Government of Sri Lanka had claimed that a large number of IDP's had been released. This was confirmed by the change detection. In only 1.7% of the area new structures were set up, while in 4.9% of the area the tents had been removed ( and ). The latter corresponds to the removal of 3813 tents, 15.5% of the tents counted in June 2009.
Figure 9. Menik Farm – Zone 2. Example of the structures’ appearance detected correctly: pre-image (left) and post-image (right). WorldView-1 imagery © Digitalglobe 2009 and GeoEye-1 imagery © GeoEye 2010, both distributed by e-GEOS.
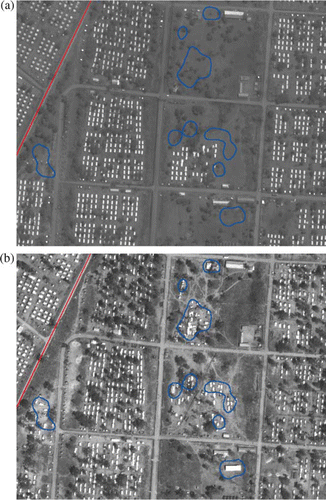
Figure 10. Menik Farm – Zone 4. Example of the structures’ appearance detected correctly: pre-image (left) and post-image (right). WorldView-1 imagery © Digitalglobe 2009 and GeoEye-1 imagery © GeoEye 2010, both distributed by e-GEOS.
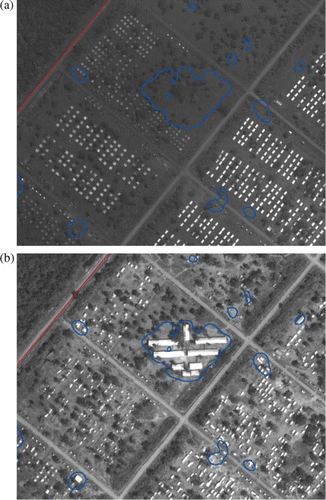
Figure 11. Menik Farm – Zone 4. Example of the disappearance of the structures detected correctly: pre-image (left) and post-image (right). WorldView-1 imagery © Digitalglobe 2009 and GeoEye-1 imagery © GeoEye 2010, both distributed by e-GEOS.
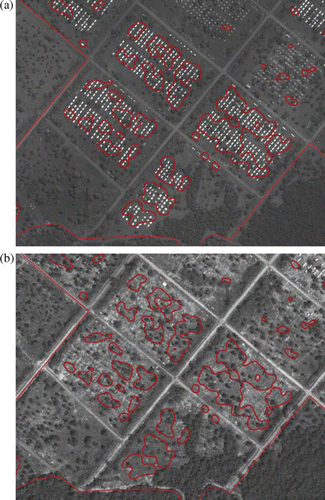
Figure 12. Menik Farm – Zone 3. Example of the disappearance of the structures detected correctly: pre-image (left) and post-image (right). WorldView-1 imagery © Digitalglobe 2009 and GeoEye-1 imagery © GeoEye 2010, both distributed by e-GEOS.
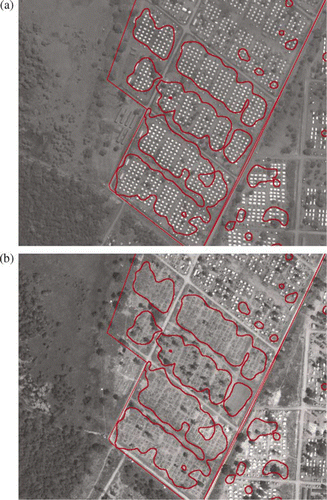
Table 5. Results’ summary for change detection analysis. The area with new structures detected on a satellite image acquired on 28 February 2010 (GeoEye-1) and not visible on a satellite image acquired on 26 June 2006 (WorldView-1).
Table 6. Results’ summary for change detection analysis. The area with structures and number of structures detected on a satellite image acquired on 26 June 2009 (WorldView-1) and not visible on a satellite image acquired on 28 February 2010 (GeoEye-1).
Discussion and conclusion
The structure of the Menik Farm camp is very regular and the variety of tents is limited. This facilitated strongly both the visual interpretation and the automated identification of the tents. In more complex situations with a larger variety of dwellings, the identification is much more difficult. In Darfur, for example, the IDP camps are mostly semi-permanent dwellings that resemble the same structure of the dwellings of the host communities. Kranz et al. (Citation2010) report considerable variation even in the results of visual interpretation of three independent interpreters for three camps in Darfur. Nevertheless, if the dwellings have distinct spatial/spectral features, these can be translated in robust image processing chains based on mathematical morphology. This was demonstrated for various refugee/IDP camps in different environmental and conflict settings ranging from semi-desert (Kemper et al. Citation2010) to tropical conditions (Giada et al. Citation2003, Jenerowicz et al. Citation2010). Other examples for the identification of specific (conflict related) structures using mathematical morphology are reported, for example, by Gueguen et al. (Citation2009) and Sulik and Edwards (Citation2010). Key for the automated extraction in all these studies was the careful qualitative characterization of structures of interest for the set-up of the morphological filters; this includes the form and size of the structuring element and the selection of the morphological procedure (e.g. opening or closing). The advantage of the proposed method is the limited number of parameters that have to be taken into account and the straightforward model development based on a verbal characterization of the tent structure.
In a situation as described in this case study it is often impossible to obtain adequate validation information due to limited access to the area. In the Menik Farm camp, the government restricted the access fearing that former LTTE insurgents could exchange information in the camp. In other situations like in Darfur, field validation is difficult due to a high risk of conflict-related kidnapping of relief workers. In addition, the questioned population fears cut in food rations and reacted repeatedly violent. These are the main reasons for relief agencies to also use Earth Observation (EO). This is in particular in early phases of conflict relevant, when no other independent and synoptic information is available. However, it is crucial to use the best data and methods available and to have full control of the methodology, thus avoiding misinterpretation of the results and being able to quantify the errors. In this regards it is also important to point out that visual interpretation, which often replaces field validation, may provide as well rather imprecise information.
As important as the technical side is the use of the results in the proper context. The EO data allow only the identification of the single dwellings. However, this is only a proxy for the total population in the camp, which is the information eventually needed. But without sufficient field information these figures cannot be modelled sufficiently well. The potential for misinterpretation of results will be exemplified with the Menik Farm camp, where population information was made available by the Government of Sri Lanka to the UNOCHA (Citation2009, 2010a). According to these numbers on the 22 June 2009, 227,432 people were detained in the camp. On the 25 February 2010, at the time of the second acquisition, 93,926 remained in the camp, i.e. a reduction of 58.7%. This decrease is much stronger than the reduction of 15.5% detected in the satellite data. The difference can, however, be attributed to the slow decommissioning of the camps.
When taking all the discussed considerations into account, information derived from satellite data may provide important added value supporting relief efforts even in difficult situations.
Notes on contributors
Thomas Kemper holds a Diploma in Applied Physical Geography from the University of Trier, Germany (1997). He worked as a PhD grant holder at the JRC and obtained a PhD (2003) for the University of Trier for his work on mapping soil contaminants using reflectance spectroscopy. He continued to work for the JRC in the field of soil contamination and desertification. From 2004 to 2007 he was working for the German Aerospace Center (DLR), where he helped developing the Center for satellite-based crisis information (ZKI) providing rapid mapping information after natural disasters. Since 2007, he is permanent staff of the EC JRC IPSC, Global Security and Crisis Management Unit being responsible the analysis of settlements, in particular informal settlements and the coordination of crisis mapping activities.
Malgorzata Jenerowicz received in 2007 an engineering degree from the Military University of Technology in Warsaw, Poland. Since 2008, she is working at the Space Research Centre of Polish Academy of Sciences in Warsaw, Poland, on a PhD thesis related to the analysis of refugee/IDP camps using very high-resolution satellite data. From May 2009 to May 2010 she joint the JRC to work on the automated detection of refugee/IDP dwellings in Darfur and Sri Lanka.
Lionel Gueguen received the engineering degree in telecommunications and the MS degree in signal and image processing from the Ecole Nationale Superieure des Telecommunications de Bretagne, Brest, France, in 2004. He received a PhD degree in signal and image processing from Ecole Nationale Superieure des Telecommunications Paris, in 2007. He worked on “Joint Information Extraction and Compression of Satellite Image Time Series” under the supervision of Mihai Datcu, and was a member of the Center of Competence on Information Extraction and Image Understanding for Earth Observation. From 2007 to 2009, he worked as a post-doc at Orange Labs, France, on radio measurements processing for cognitive radio applications. In July 2009, he joined IPSC, Support to External Security Unit, ISFEREA Action, to work on automatic image information extraction.
Daniela Poli got her degree in Environmental Engineering at Politecnico di Milano, Italy, in 1997. In 2005 she gained a doctorate degree in Photogrammetry and Remote Sensing in the Institute of Geodesy and Photogrammetry at the Swiss Federal Institute of Technology (ETH) in Zurich, Switzerland. Her research was focused on rigorous geometric modelling of spaceborne and airborne pushbroom sensors. From 2005 to 2007, she worked at CyberCity AG, an ETH spin-off company specialised in the generation and visualisation of reality-based 3D city models, then returned to ETH for a post-doc position. Since February 2009, she is research fellow on 3D object extraction and modelling from optical images in the Institute for the Protection and Security of the Citizen at the European Joint Research Center in Ispra, Italy.
Pierre Soille received the engineering degree in 1988 from the Université Catholique de Louvain, Belgium. Research on mathematical morphology for the processing of digital elevation models and satellite images provided the material for the doctorate degree he gained in 1992 at the same university and in collaboration with the Centre de Morphologie Mathématique of the Ecole des Mines de Paris. He then pursued research on image analysis and mathematical morphology at the CSIRO Mathematical and Information Sciences, Sydney; the Centre de Morphologie Mathématique, Fontainebleau, France; and the Pattern Recognition Department of the Fraunhofer-Institut IPK, Berlin. During the period 1995–1998, he has been an assistant professor at the Ecole des Mines d'Alès and EERIE, Nîmes, France. He received the ‘Habilitation à Diriger des Recherches’ degree in 1997 from the Université Montpellier-II, France. In 1999, he was senior research scientist with the Biotechnology and Biological Sciences Research Council, UK. Since December 1999, he has been with the Joint Research Centre of the European Commission, Ispra, Italy. With the Institute for Environment and Sustainability, he contributed to the development of numerous advanced methodologies and algorithms for the generation of enhanced pan-European geospatial data sets. Since January 2009, he joined the Institute for the Protection and Security of the Citizen, Global Security and Crisis Management Unit, ISFEREA Action, to lead the research on automatic information retrieval from satellite image data.
Acknowledgements
Malgorzata Jenerowicz contributed to this work while she was visiting the Institute for the Protection and Security of the Citizen of the Joint Research Centre of the European Commission, Ispra (Italy), from May 2009 to May 2010.
Related Research Data
References
- Bjorgo , E. 2000 . Using very high spatial resolution multispectral satellite sensor imagery to monitor refugee camps . International Journal of Remote Sensing , 21 ( 3 ) : 611 – 616 .
- Ehrlich , D. 2009 . “ Can earth observation help to improve information on population? ” . In Remote sensing from space – supporting international peace & security , Edited by: Jasani , B. , Pesaresi , M. , Schneiderbauer , S. and Zeug , G. 211 – 238 . Berlin and Heidelberg : Springer .
- Giada , S. 2003 . Information extraction from very high resolution satellite images over Lukole refugee camp, Tanzania . International Journal of Remote Sensing , 24 ( 22 ) : 4251 – 4266 .
- Gueguen , L. and Datcu , M. , 2009 . Mixed information measure: application to change detection in earth observation . In: Proceedings of MultiTemp conference , 28–30 July 2009, Connecticut, USA. Available from: http://www.clear.uconn.edu/multitemp09/multitemp2009_proceedings.pdf [Accessed 13 August 2010], 66–72.
- Gueguen , L. , et al. , 2009 . Morphological descriptors and spatial aggregations for characterizing damaged buildings in very high resolution images . Proceedings of the 6th conference on image, information mining , 3–4 November, Torrejon, Spain. http://earth.eo.esa.int/rtd/Events/ESA-EUSC-JRC_2009/Papers/Pap_Gueguen.pdf [Accessed 15 July 2010] .
- Inglada , J. and Mercier , G. 2007 . A new statistical similarity measure for change detection in multitemporal sar images and its extension to multiscale change analysis . IEEE Transactions on Geoscience andRemote Sensing , 45 ( 5 ) : 1432 – 1445 .
- Jenerowicz , M. , et al. , 2010 . Post-event damage assessment using morphological methodology on 0.5m resolution satellite data . Proceedings of the Gi4DM conference , 2–4 February, Torino, Italy (in press)
- Kemper , T. , et al. , 2010 . Enumeration of dwellings in Darfur camps from GeoEye-1 satellite images using mathematical morphology . IEEE Journal of Selected Topics in Earth Observations and Remote Sensing (accepted for publication)
- Kranz , O. , et al. , 2010 . Different approaches for IDP camp analyses in West Darfur (Sudan) – a status report . Proceedings of the Gi4DM conference 2–4 February , Torino, , Italy (in press)
- Kranz , O. 2009 . “ GMES services for conflict prevention and mitigation: supporting mission planning of DG RELEX ” . In Cartography and geoinfomatics for early warning and emergency management , Edited by: Konecny , M. 171 – 188 . Berlin and Heidelberg : Springer .
- Rodríguez , E. , Morris , C. and Belz , J. 2006a . A global assessment of the SRTM performance . Photogrammetric Engineering and Remote Sensing , 72 ( 3 ) : 249 – 260 .
- Rodríguez , E. , et al. , 2006b . An assessment of the SRTM topographic products . NASA-Jet Propulsion Laboratory, Tech. Rep. JPL D-31639 [Online]. Available from: http://www2.jpl.nasa.gov/srtm/SRTM_D31639.pdf [Accessed 13 August 2010] .
- Soille , P. 2003 . Morphological image analysis: principles and applications , 2nd ed , Berlin, Heidelberg and New York : Springer-Verlag .
- Sulik , J. and Edwards , S. 2010 . Feature extraction for Darfur: geospatial applications in the documentation of human rights abuses . International Journal of Remote Sensing , 31 ( 9–10 ) : 2513 – 2520 .
- United Nations Office for the Coordination of Humanitarian Affairs (UNOCHA) , 2009 . Joint humanitarian update, North-east Sri Lanka . Report No. 9, 15–30 June 2009. Available from: http://www.humanitarianinfo.org/srilanka_hpsl/Catalogues.aspx?catID=74 [Accessed 14 June 2010] .
- United Nations Office for the Coordination of Humanitarian Affairs (OCHA) , 2010a . Joint humanitarian update, North-east Sri Lanka . Report No. 20, 13–26 February 2010. Available from: http://www.humanitarianinfo.org/srilanka_hpsl/Catalogues.aspx?catID=74 [Accessed 14 June 2010] .
- United Nations Office for the Coordination of Humanitarian Affairs (OCHA) , 2010b . Displacement in the North of Sri Lanka since October 2008 , updated 12 February 2010. Google Earth Application. Available from: http://www.humanitarianinfo.org/srilanka_hpsl/idp_google.aspx [Accessed 14 June 2010].