Abstract
The creation of a quality Digital Terrain Model (DTM) is essential for representing and analyzing the Earth in a digital form. The continuous improvements in the acquisition and the potential of airborne Light Detection and Ranging (LiDAR) data are increasing the range of applications of this technique to the study of the Earth surface. The aim of this study was to determine the optimal parameters for calculating a DTM by using an iterative algorithm to select minimum elevations from LiDAR data in a steep mountain area with shrub vegetation. The parameters were: input data type, analysis window size, and height thresholds. The effects of slope, point density, and vegetation on DTM accuracy were also analyzed. The results showed that the lowest root mean square error (RMSE) was obtained with an analysis window size of 10 m, 5 m, and 2.5 m, rasterized data as input data, and height thresholds equal to or greater than 1.5 m. These parameters showed a RMSE of 0.19 m. When terrain slope varied from 0–10% to 50–60%, the RMSE increased by 0.11 m. The RMSE decreased by 0.06 m when point density was increased from 4 to 8 points/m2, and increased by 0.05 m in dense vegetation areas.
Introduction
Airborne Light Detection and Ranging (LiDAR) is an active remote sensing system which has been widely used in the last decade to measure information in two and three dimensions. It works by measuring the time delay from when a pulse is emitted by an airborne sensor to when it bounces back from the terrestrial surface. LiDAR systems can register the return signal of an emitted pulse in different echoes, and can be used in conjunction with a differential GPS and an inertial system to calculate the coordinates of the point where the reflection takes place. This information can then be used to determine ground elevations, the elevation of objects above the terrestrial surface level, and the height of vegetation canopy. The three categories of information obtained are known as Digital Terrain Model (DTM), Digital Surface Model (DSM), and Canopy Height Model (CHM), respectively. The data have been widely applied in different fields: river flood modeling (Cobby et al. Citation2001); changes in beach sand (Shrestha et al. Citation2005); building extraction (Sohn and Dowman Citation2007); and mainly in forest science (Lefsky et al. Citation1999, Næsset Citation2002, Maltamo et al. Citation2004, Popescu Citation2007). Although good results were obtained in the detection of forest cover when only satellite images were used (Zhang and Guindon Citation2009), an improvement was found when LiDAR data and spectral information were combined (Mutlu et al. Citation2008). Since digital earth studies are based on the integration of multiple sources of geographical data with different resolutions (Goodchild Citation2008), LiDAR data is becoming key to the analysis of the terrain surface due to the speed of acquisition and processing, which is continually improving. In this sense, LiDAR data can play a relevant role in obtaining DTMs which represent terrain relief with high accuracy. Furthermore, the DSM allows us to obtain several layers of geographic data which can be added to a digital representation of the Earth.
DTM accuracy depends on several factors: both vertical and horizontal errors related to the system (GPS, INS, and laser scanner); methodology and algorithms; complexity of the target; and data characteristics (Hyyppä et al. Citation2008). Data characteristics such as flight height, point density, number of echoes, and scan angle are related to the accuracy of a DTM. The greater the flight height and scan angle, the greater the error (Ahokas et al. Citation2003). Point density and distribution of the points also play an important role in the accuracy of a DTM (Baltsavias Citation1999). Hyyppä et al. (2005) analyzed the variation of flight height and point density in the accuracy of a DTM. When the flight height and the point density varied from 400 m and 8 points/m2 to 1500 m and 1–2 points/m2, error increased 6 cm. Another factor related to the data characteristics affecting the accuracy of a DTM is the scan angle. In dense vegetation areas a relationship between the pulses reaching the ground and the scan angle has been found (Davenport et al. Citation2000). The likelihood of obtaining laser pulse returns from the ground can increase with narrow scan angles (Hopkinson et al. Citation2005). Finally, factors such as the presence of dense vegetation and high slopes that characterize the complexity of the target produced a decrease in the accuracy of a DTM (Kraus and Pfeifer Citation1998, Raber et al. 2002, Clark et al. Citation2004, Hollaus et al. Citation2006).
Filtering algorithms are applied to identify points that do not belong to the ground. A review of methods can be found in Sithole and Vosselman (Citation2004). An important group of algorithms uses morphological filters. This involves selecting minimum and maximum values for a specific location (Zhang et al. Citation2003). The algorithm which uses the iterative process to select minimum elevations can be included in this group. This methodology was applied by Popescu et al. (Citation2002), Wack and Wimmer (Citation2002), and Clark et al. (Citation2004). They selected points of minimum elevation in a series of progressively smaller windows. First, they calculated an initial DTM using the points selected. Then, they selected new minimum elevations by using smaller windows. They then compared these points to the initial DTM. When they introduced a height threshold, it was possible to remove points corresponding to vegetation, and so increase the accuracy of the DTM. Thus, when this filtering methodology is applied, DTM accuracy is influenced by window size, number of iterations, and height thresholds (Patenaude et al. Citation2004, Yu et al. Citation2004, Suárez et al. Citation2005).
Little research has been conducted on computing a DTM in areas with presence of shrub vegetation. Rango et al. (Citation2000) combined a progressive detrending of a DTM derived from LiDAR data and optical multispectral image to study morphological characteristics of shrub coppice dunes. Riaño et al. (Citation2007) also used a color infrared orthoimage to reject the pulses coming from the shrub canopy and improve the accuracy of a DTM computed by LiDAR data. Su and Bork (Citation2006) interpolated the discontinuous last return ground LiDAR to compute a DTM and found that the accuracy decreased in shrub areas. An improvement in accuracy was achieved when the shrub vegetation was grouped into two classes. It was also found that the root mean square error (RMSE) increased when slope varied over 10 degrees. Wang et al. (2009) selected the lowest LiDAR data determining the optimal filter window size in salt-marsh environments.
In spite of the above research, there is still a need to explore parameters, such as window size and height threshold, that minimize the DTM error in steep mountain areas with a predominance of shrub vegetation, such as Mediterranean ecosystems. Forest stand characteristics can be estimated from statistics derived from LiDAR data (Næsset 2004, Popescu Citation2007). In order to obtain the relative height of the forest stand, each LiDAR point must be referred to the terrain surface. Accuracy of DTM is more relevant in shrub areas due to the small difference in height between the vegetation and the terrain. Previous research has pointed out the importance of an accurate DTM in the height and volume estimation (Estornell et al. in press, Velázquez-Martí et al. Citation2010). The small difference in height between the vegetation and the terrain requires the selection of appropriate parameters to obtain an accurate DTM and to minimize errors. These errors affect the accuracy of the shrub height estimation, which is normally underestimated when LiDAR data are employed (Streutker and Glenn Citation2006, Riaño et al. 2007).
The aim of our study was to determine the optimal range of the parameters analysis window size and height thresholds to calculate accurate DTMs when using iterative algorithms. Some other parameters affecting the accuracy of the DTMs were also analyzed, such as the input data type and the effect of point density, slope of the terrain, and presence of shrub vegetation.
Materials and methods
Study area
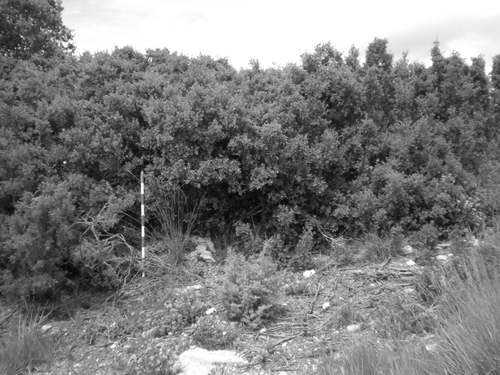
The study area chosen was a 10 km2 area, located in Chiva (Valencia, Spain). The UTM coordinates X maximum, Y maximum, X minimum, and Y minimum, for the zone are 689800, 4376028, 683800, and 4373000, respectively (). The zone number is 30, and the reference system, European Datum 1950. The area is mountainous with a predominance of Quercus coccifera (), with an average height of 1.25 m, and a percent cover of around 55%. The altitude varies from 442 to 1000 m, with an average slope of 45% and standard deviation of 25%.
Figure 1. Location of study area in Chiva (Spain). Black polygon represents area surveyed with LiDAR data.
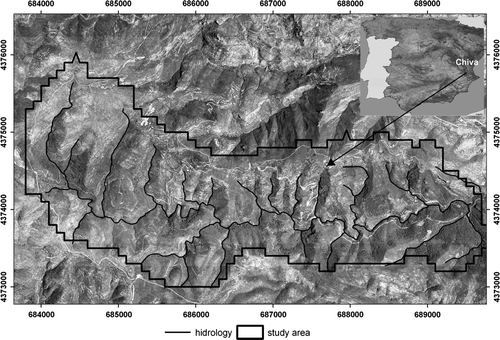
Figure 2. Study area photograph with dense presence of kermes oak (Quercus coccifera).
Light Detection and Ranging (LiDAR) data
The LiDAR data were acquired during a flight in December 2007, using an Optech ALTM 2050 system. The technical parameters were: flight height, 700 m above ground; pulse frequency, 50 kHz; scan frequency, 47 Hz; scan angle, ±18°; speed flight, 70 m/s; swath width, 400 m; distance between a scanning trajectory flight, 300 m; number of strips, 10; total points obtained for the test area, 78,919,301; nominal pulse density, 4 points/m2; number of echoes, 2. However, given that 10 overlapping flight lines were registered, some areas had a higher point density. For this reason, the average point density of the study area, considering both returns, was 8 points/m2. More than 99% of the LiDAR values belonged to the first pulse. This could be caused by the small difference in height between the canopy of vegetation and the ground.
To evaluate the validity of the DTMs, 1397 ground-surveyed checkpoints were distributed across the study area and randomly measured with an RTK-GPS system (Leica System 1200); thus making these independent validation data appropriate for assessing any global elevation bias in the DTM. Horizontal and vertical accuracy of the RTK-GPS system in terms of RMSE value was 1 cm and 2 cm, respectively, according to the technical specifications of the instrument. Average horizontal and vertical errors for the measured points were 1 and 1.5 cm, respectively. The RTK-GPS system did not register any point whose error was greater than 5 cm.
To assess the altimetry accuracy of LiDAR data, 60 checkpoints were selected in flat areas without vegetation (Streutker and Glenn Citation2006). Elevations measured using the RTK-GPS were compared with the average elevation of LiDAR points in a buffer radius of 0.5 m around the point measured. This radius was selected because the horizontal accuracy of LiDAR points was 0.5 m according to the specifications of the technical report of the vendor company. The RMSE of the two sets of measurements was 6 cm. Similar results were obtained for some additional 23 points distributed in areas with an average slope of 40% without vegetation or any objects above the ground.
Digital Terrain Model (DTM) calculation
Computing a DTM from LiDAR data involves using algorithms to eliminate points belonging to any object above ground surface such as vegetation or buildings. To do this, we generated a program based on iterative processes () written in Interactive Data Language (IDL, ITT Visual Systems).
Figure 3. Algorithm used for calculating DTM (adapted from Clark et al. Citation2004).
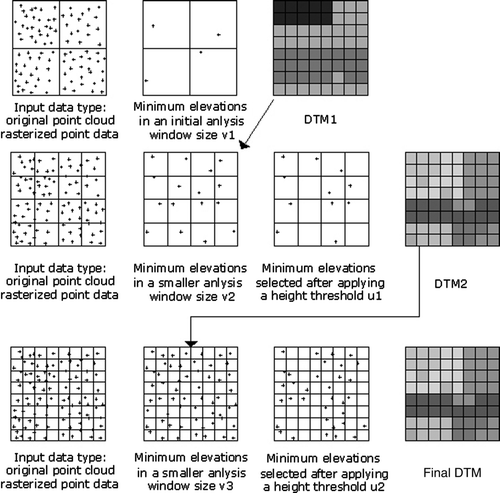
The DTM iterative algorithm involved five steps:
Step 1. The study area was divided into windows, with an initial window size (v1). In each window, we selected the minimum elevation point. We used these points to calculate an initial DTM (DTM1) using the Delaunay triangulation method.
Step 2. A smaller window size (v2) was then used to find new minimum heights from the input data.
Step 3. We compared the points selected in Step 2 with the DTM1 calculated in the Step 1, and computed their differences. We then selected the points with height difference values lower than the defined height threshold (u1), rejecting points with difference values above this threshold. A new DTM (DTM2) was calculated using the remaining minimum points (i.e. which had not been rejected).
Step 4. We created window size (v3), which was smaller than v2. Again, the minimum points in each window were selected.
Step 5. As with Step 3, minimum points were compared to DTM2. Points with height difference values greater than the second height threshold (u2) were eliminated. The final DTM was calculated with the remaining points ().
Parameters analyzed
We analyzed the convenience of simplifying the data for processing purposes, comparing the effect of using different data types on the accuracy of the DTM. Two different input data types were considered: raw LiDAR data containing all points, and LiDAR rasterized data, obtained using a cell size of 1×1 m. The value for each cell corresponded to the lowest LiDAR point contained in it. The DTM iterative algorithm was applied to both raw LiDAR and rasterized data.
In addition, we evaluated the accuracy of the final DTM for six groups of window sizes, defined by the vectors w (v1, v2, and v3) shown in . This table shows the window sizes applied to both raw LiDAR data and rasterized data in the filtering process (Steps 1–5). Only six series of window sizes were tested: w0 (5, 2.5, 1); w1 (8, 4, 2); w2 (10, 5, 2.5); w3 (12, 6, 3); w4 (15, 10, 5); and w5 (20, 10, 5). Each vector wi shows a sequence of window sizes applied in meters for selecting the lowest LiDAR data. Thus, the window size applied in Step 1 is defined by the first component (v1); the window size applied in Step 2 is defined by the second component (v2); and the window size applied in Step 4 is defined by the third component (v3). In addition, 25 height thresholds (), defined by the vectors t ab (u1 and u2), were used. Consequently, window sizes from 2.5 to 20 m were used with height threshold ranging from 0.5 to 2.5 m resulting in 125 DTM, which were computed and analyzed. Only the raw LiDAR data was used as the input data type.
Table 1. Vectors of analysis window size applied to find minimum elevations.
Table 2. Vectors t ab of height threshold applied to eliminate points not belonging to the ground.
We assessed each DTM by using the checkpoints measured with the RTK-GPS system. The RMSE (1) was computed to evaluate the effect of the analysis window size and height threshold parameters on the accuracy of a DTM.
Next, we analyzed input data type, terrain slope, point density, and shrub vegetation as factors affecting the accuracy of a DTM. A total of 10 DTMs were calculated with the following parameters:
| • | Five DTMs calculated with the vectors w1, w2, w3, w4, and w5; raw LiDAR data as input data type; height thresholds u1 and u2 with the optimal value obtained from the above analysis (i.e. the results of the RMSE for the 125 DTM). | ||||
| • | Five DTMs calculated with the vectors w1, w2, w3, w4, and w5; input data type in rasterized data; height thresholds u1 and u2, with the optimal value obtained from the RMSE analysis (as above). | ||||
We analyzed the input data type factor by calculating the RMSE of the checkpoints for each of the 10 DTMs. To detect the overestimation or underestimation of each DTM the mean signed error (MSE) was also calculated.
To analyze the effect of terrain slope on the accuracy, we used the following intervals to classify the slope of the 1397 checkpoints: 0–10% (n=169); 10–20% (n=255); 20–30% (n=353); 30–40% (n=249); 40–50% (n=189); 50–60% (n=97); >60% (n=67); where n is the number of checkpoints in each interval. For the 10 DTMs, we calculated the RMSE of the points included in each interval.
In order to study the density factor, the number of LiDAR points per m2 was determined, with the GPS-RTK point at the center. These GPS points were classified according to the number of LiDAR points included in a buffer of 0.5 m radius (area 1 m2). We found 84 GPS-RTK points with 1–2 points/m2 within their buffers; 134 GPS-RTK points with 3–4 points/m2; 174 GPS-RTK points with 5–6 points/m2; 230 GPS-RTK points with 7–8 points/m2; 250 GPS-RTK points with 9–10 points/m2; 180 GPS-RTK points with 11–12 points/m2; 327 GPS-RTK points with the number of points greater than 12 points/m2. For the 10 DTMs, we calculated the RMSE of each group.
Finally, we studied the effect of the vegetation factor on the accuracy of the DTM by measuring 77 GPS-RTK checkpoints where the shrub vegetation occupied the entire ground surface of a circle with a 2 m radius and with the checkpoint at the center. This meant areas 100% covered with a dominant vegetation height of 1.27 m. This analysis was performed by computing the RMSE and MSE for the 10 DTMs. We also analyzed this factor for analysis window size w0 (5, 2.5, 1).
Results and discussion
Effect of analysis window size and height threshold on Digital Terrain Model (DTM) accuracy
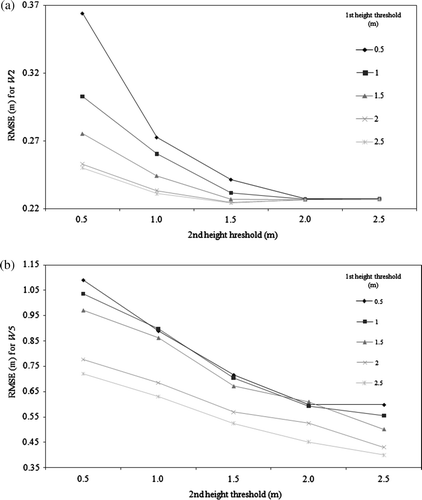
The RMSE showed a decreasing trend, when both height thresholds were increased up to a specific height threshold value, where the RMSE became minimum and constant (). Moreover, for every vector w, the second height threshold produced lower RMSE values for vectors t ab if a<b. For example, for vector w5 (20, 10, 5), the RMSE obtained was 0.72 m when the height threshold was u1=2.5 m and u2=0.5 m. In contrast, for height threshold values of u1=0.5 m and u2=2.5 m, the RMSE was 0.6 m. These results were different to those reported in studies where height thresholds were lower than 1 m and the vegetation was composed of trees (Clark et al. Citation2004, Yu et al. 2004, Estornell and Ruiz Citation2007). However, since our study area was characterized by irregular slopes, the use of low height threshold values would increase the probability of eliminating ground points, thus giving inaccurate DTMs. In addition, we found that when window size w0 (5, 2.5, 1) was used for calculating a DTM, a lower RMSE was obtained with threshold values 2.5 and 0.5 m for thresholds u1 and u2, respectively. This could be because the distance between the v2 (2.5 m) and v3 (1 m) window size is 1.5 m; for this distance the height difference to the ground is lower than for the rest of the windows, assuming an average slope of 40%. The selection of higher threshold values entails the incorrect selection of points belonging to vegetation.
Figure 4. RMSE of DTMs calculated for analysis window size vectors w2 (a), and w5 (b), and varying the 1st and the 2nd height threshold.
The analysis of the data in areas with local terrain irregularities and steep slopes revealed that the height thresholds with minimum RMSE were equal to or greater than the height difference in the horizontal window. These values of height threshold should be considered when the study area is characterized by local terrain irregularities and steep slopes. These features can be observed in a shaded relief image of a DTM in .
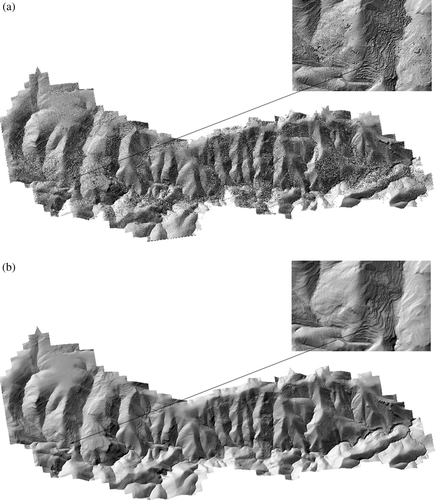
Figure 5. A shaded relief image of DSM (a) and shaded relief image of a DTM calculated with analysis window size vector 10, 5, and 2.5 m; thresholds 2.5 m; and rasterized data as entry data (b). In the detail it can be appreciated that the shrub vegetation areas have been removed in the height filtering in the DTM.
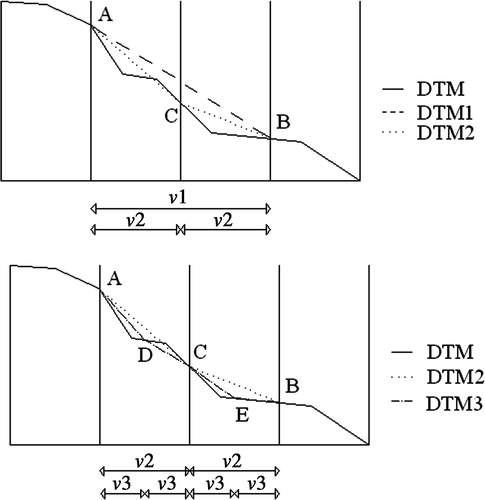
To illustrate the height threshold values which gives minimum RMSE, a profile of the study area is shown in . Initially, the v1 analysis window is large, and the minimum elevation of point B is at the edge. Point A is the lowest point of the adjoining analysis window. From these data, DTM1 is obtained. As the slope between points A and B is not uniform, DTM1 is above actual ground level (DTM). After applying a smaller analysis window, v2, points A and B are selected again, and a new point, C, appears. This point may correspond either to the terrestrial surface or vegetation. If a threshold is used which takes into account the height difference in the horizontal window, C is selected if it does not exceed u1, in which case it is highly probable that it belongs to the ground and not vegetation. If low thresholds are used, C will not be selected and the RMSE of DTM2 will be the same as DTM1. When the next window (v3) is applied, the same procedure is followed. In this case, points C and D will be selected.
Figure 6. Selection of minimum height points in a typical terrain profile of the study area.
Regarding analysis window size, the RMSE showed a decreasing trend for small windows (a). The minimum RMSE was 0.23 m using vector w0 and u1 height threshold, 2.5 m, and u2 0.5 m and using vectors w1 and w2, and height threshold u1 and u2 equal to or greater than 1.5 m. For w3, RMSE was also 0.23 m, with thresholds equal to or higher than 2 m. For w4 and w5 (b), the minimum RMSE were 0.28 m and 0.40 m, respectively. In these cases, height thresholds u1 and u2 were equal to or higher than 2.5 m. These results showed that small analysis windows produced lower RMSE. In contrast, the RMSE increased when large analysis windows were used, revealing that large windows do not accurately define the micro relief of an area (Popescu et al. Citation2002). Large windows are only justified in areas where there are few gaps which allow pulses to reach the ground. For this reason, Clark et al. (Citation2004) used an analysis window vector with components 20, 15, and 10 m in a dense forest. Therefore, analysis window size should be small enough to preserve topographic details and large enough to eliminate any object above the ground (Wang et al. Citation2009).
Effect of input data type on the accuracy of a Digital Terrain Model (DTM)
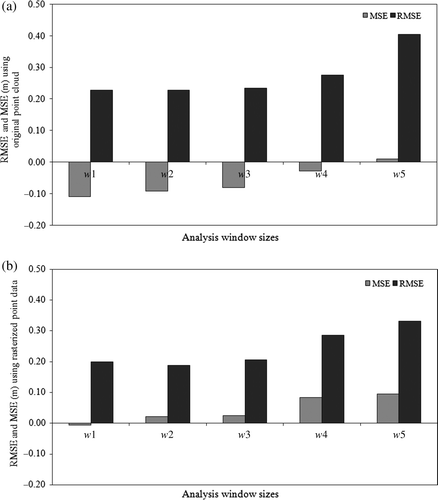
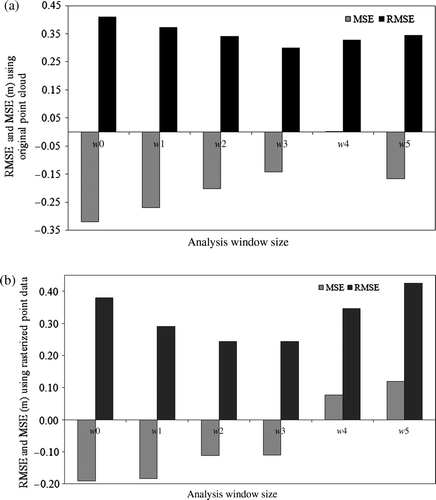
DTMs obtained using rasterized data as input data had lower RMSE values than those computed using raw LiDAR data format (). Moreover, the RMSE decreased when smaller windows were used, confirming the results discussed above. The lowest RMSE was 0.19 m when vector w2, and rasterized data were used. The highest RMSE was obtained using vectors w4–w5 and raw LiDAR data, which gave values of 0.28 and 0.40 m, respectively. Furthermore, in our study the MSE increased in line with an increase in window size: the error sign changed from negative when raw LiDAR data were used, to positive for rasterized data format. This trend shows that raw LiDAR data type tends to overestimate the DTM for small windows, while rasterized data type underestimates the DTM for large windows. The lowest MSE values were for rasterized data format and vectors w1 and w2: –0.01 m and 0.02 m, respectively. The standard deviation was 0.20 m in both cases. The MSE results were in line with those obtained by Wang et al. (2009) in environments of low vegetation. However, the higher standard deviation found in our study was because that vegetation occupied larger areas in our study, which made it more difficult to select ground points. In addition, the vegetation was closer and higher and the slopes were steeper.
Figure 7. RMSE and MSE for 10 DTMs calculated with analysis window size vectors: w1, w2, w3, w4, and w5; height threshold, 2.5 m; input data type raw LiDAR data (a); and rasterized data type (b).
Clark et al. (Citation2004) showed a higher RMSE value (2.29 m) than that obtained in this study (0.19 m) using the same methodology and analysis window sizes of 20, 15, and 10 m. These differences could be due to the vegetation type present in each study area. Unlike our study area, the area in Clark et al. (Citation2004) was characterized by the presence of a dense layer of old growth trees, which made it difficult for the laser pulses to reach the ground. Therefore, they had to use large analysis windows in order to increase the likelihood of ground point selection. However, our findings suggest that large windows produce higher RMSE, as reported in Suárez et al. (2005) – they obtained an RMSE lower than 0.25 m. The terrain in their study was flat, thus allowing more accurate DTMs.
Effect of terrain slope on the accuracy of a Digital Terrain Model (DTM)
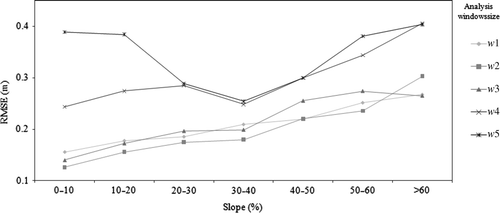
As expected, there was a linear increase in RMSE as the slope increased, using DTMs calculated with vectors w1, w2, w3, and w4, and rasterized data as input data type (). The variations in RMSE values were: 0.16 to 0.27 m (w1); 0.13 to 0.30 m (w2); 0.14 to 0.26 m (w3); and 0.24 to 0.41 m (w4). When large windows were used (vector w5), there was no relation between RMSE and terrain slope. For large windows, a significant amount of micro relief may be omitted, thus producing an increase in the RMSE. A similar trend with higher RMSE values was observed when the input data type was raw LiDAR data. These errors were lower than the errors found in Hyyppä et al. (2000) where there was a variation in the RMSE from 0.15 to 0.40 m, while in Hollaus et al. (2006) the RMSE varied from 0.1 to 0.31 m for slopes from 0–10% to 40–50%. Although the methodology and characteristics of the study areas were different, the results seem to indicate that the parameters selected would be suitable for steep terrain.
Figure 8. Analyses of terrain slope effect in the RMSE with analysis window size vectors: w1, w2, w3, w4, and w5; height thresholds, 2.5 m; and entry data, rasterized data.
Horizontal accuracy of the LiDAR system can lead to vertical errors. Multiplying the nominal horizontal accuracy (0.5 m) and the average slope of the terrain (40%), a mean vertical error of 0.2 m was expected in the area. However, according to the assessment of the vertical accuracy of LiDAR data based on in-field measurements and described in Section 2.2, a value of RMSE of only 0.06 m was obtained in steep slopes. This result could explain part of the RMSE values obtained in the analysis of the slope factor.
Effect of point density on the accuracy of a Digital Terrain Model (DTM)
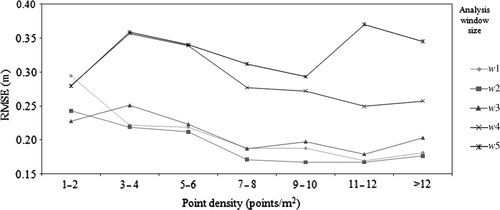
The results of our study showed that RMSE continued to decrease until point density reached 8 points/m2 (). From this density upwards, the RMSE value remained constant. There was no relation between the RMSE and the point density for analysis window size w5, as this size of window masked the influence of other factors. The lowest RMSE was obtained with analysis window sizes w1 and w2, and rasterized data as input data type (). For these parameters, RMSE values decreased from 0.29 to 0.18 m for w1, and from 0.24 to 0.18 m for w2, when density varied from 1–2 to 12 points/m2. These results are in line with those presented in Hyyppä et al. (2005), where the RMSE increased from 0.12 to 0.18 m when point density varied from 8 to 1–2 points/m2, respectively.
Figure 9. Analyses of point density in the RMSE of DTMs calculated with analysis window size vectors w1, w2, w3, w4, and w5; thresholds, 2.5 m; and entry data, rasterized data.
Effect of shrub vegetation on Digital Terrain Model (DTM) accuracy
We analyzed the influence of vegetation by using 77 ground-surveyed checkpoints measured with RTK-GPS equipment in areas with dense shrub. The lowest RMSE (0.24 m) was found for vectors w2 and w3, and rasterized data as input data type (). This value was 0.05 m higher than the lowest RMSE calculated from the 1379 checkpoints. Su and Bork (Citation2006) obtained a higher RMSE (0.5 m) in the computation of a DTM in areas with presence of silverberry whose structure was similar to the vegetation found in our study. These results suggest that this algorithm could be used in shrub vegetation areas with steep slopes, as illustrated in , although accuracy decreases in zones occupied by dense vegetation (Cobby et al. Citation2001, Raber et al. 2002, Hodgson et al. Citation2005, Riaño et al. 2007).
Figure 10. RMSE and MSE for the 10 DTMs calculated using 77 points measured in shrub vegetation areas. The parameters for calculating the DTMs were: analysis window size vectors w0, w1, w2, w3, w4, and w5; thresholds, 2.5 m; and entry data, raw LiDAR data (a) and rasterized data (b).
The MSE for the smallest window vectors w0 (5, 2.5, and 1 m) and w1 (8, 4, and 2 m) was negative, and the absolute value was high, especially when the raw LiDAR data were used. This result indicated that points belonging to vegetation were selected as ground points, thus producing a DTM overestimation.
Conclusions
The influence of some parameters and factors in the accuracy of DTM calculation in shrub areas were analyzed. An algorithm based on iterative processes to select minimum elevations was applied for DTM computation in a steep mountain area with local terrain irregularities. Our results showed that the lowest RMSE was found for a medium analysis window size (w2 and w3), rasterized data as input data, and height thresholds equal or greater than 1.5 m. The results also showed that small or large windows were inappropriate for the type of terrain studied. In terms of input data type, DTMs calculated from rasterized data produced better results, although the DTM tended to be underestimated. These results were confirmed when the effect of slope, point density, and presence of shrub vegetation on the accuracy of a DTM were analyzed. For other scenarios, however, different values of parameters might be needed to obtain accurate DTM.
Previous research has pointed out the importance of accurate DTM in the height and volume estimation (Estornell et al. in press, Velázquez-Martí et al. 2010), particularly in shrub areas, where there are small differences in height between the vegetation and the terrain, and there is height underestimation of shrub vegetation (Streutker and Glenn Citation2006, Riaño et al. 2007). To minimize these errors, it is critical to select the parameters involved in DTM calculation correctly.
Given that a highly accurate DTM is required to analyze shrub vegetation, the results obtained in this research could be applied to study the volume and height of this vegetation, as well as to obtain an accurate digital representation of the Earth. The appropriate processing and use of these data will contribute to improve our knowledge of Mediterranean forests, which have a main proportion of dense and low shrub.
Notes on contributors
Javier Estornell received the B.S. degree in Geodesy and Cartography Engineering and the M.Phil. in Geodesy, Cartography and Geographic Information Systems at Universidad Politécnica de Valencia (Spain) in 2003 and 2007, respectively, where he teaches and researches. Since 2003, he has been lecturing remote sensing and geographic information systems. His main research interests include processing of LiDAR data to estimate forest variables, especially of shrub vegetation, and analysis of urban growth using satellite images. He is currently pursuing the Ph.D. at the Universidad Politécnica de Valencia.
Luis A. Ruiz received the degree in Agricultural Engineering from the Universidad Politécnica de Madrid, he spent two years (1991/1992) in the Biological and Agricultural Engineering Department at Louisiana State University working in image processing applications in agriculture, and completed his Ph.D. degree in 1999 at the Universidad Politécnica de Valencia. Since 1993 he has been lecturing remote sensing and, from 2000, he is a tenure professor in this university, where he researches in the Geo-Environmental Cartography and Remote Sensing Group, being his main research topics of interest LiDAR applications in forestry, and high-resolution aerial and satellite image analysis for updating land use/land cover databases.
Borja Velázquez-Marti is Ph.D., specialized in mechanization and agrarian technology. His teaching is focused on studies of Agricultural and Forest Engineering at the Universidad Politécnica de Valencia. The main research lines developed by him are focused on agricultural and forest energy biomass assessment, transformation and logistics, agricultural and forest mechanization, and evaluation of the sustainability in biological systems.
Txomin Hermosilla got his B.S. in Geodesy and Cartography Engineering at Universidad Politécnica de Valencia (Spain) and his M.Sc. in Geographical Information Management at Cranfield University (UK) in 2005. Nowadays he is a researcher at the Geo-Environmental Cartography and Remote Sensing Research Group, and Ph.D. candidate at the Universidad Politécnica de Valencia. His research interests include feature extraction and definition from high-resolution imagery and LiDAR data for object-based classification of agricultural, forest, and urban areas for land use/land cover geospatial database updating.
Acknowledgements
This research has been supported by Vice-Rectorate for Research of Universidad Politécnica de Valencia (Grant PAID-06-08-3297).
Related Research Data
References
- Ahokas , E. , Kaartinen , H. , and Hyyppä , J. , 2003 . A quality assessment of airborne laser scanner data . International Archives of Photogrammetry, Remote Sensing and Spatial Information Sciences , 34 3/W13 , 6 .
- Baltsavias , E.P. 1999 . Airborne laser scanning: existing systems and firms and other resources . ISPRS Journal of Photogrammetry and Remote Sensing , 54 : 164 – 198 .
- Clark , M.L. , Clark , D.B. and Roberts , D.A. 2004 . Small-footprint LiDAR estimation of sub-canopy elevation and tree height in a tropical rain forest landscape . Remote Sensing of Environment , 91 : 68 – 89 .
- Cobby , D.M. , Mason , D.C. and Davenport , I.J. 2001 . Image processing of airborne scanning laser altimetry data for improved river flood modeling . ISPRS Journal of Photogrammetry and Remote Sensing , 56 : 121 – 138 .
- Davenport , I.J. 2000 . Improving bird population models using airborne remote sensing . International Journal of Remote Sensing , 21 : 2705 – 2717 .
- Estornell , J. and Ruiz , L.A. , 2007 . Generation of a DTM and DSM combining LiDAR data and a QuickBird image in a forest evironment , 7a Semana Geomática Barcelona .
- Estornell , J. , Ruiz , L.A. , and Velazquez-Marti , B. , 2010 . Study of shrub cover and height using Lidar data in a mediterranean area . Forest Science (in press) .
- Goodchild , M.F. 2008 . The use cases of digital earth . International Journal of Digital Earth , 1 ( 1 ) : 31 – 42 .
- Hodgson , M.E. 2005 . An evaluation of LiDAR-derived elevation and terrain slope in leaf-off conditions . Photogrammetric Engineering and Remote Sensing , 71 ( 7 ) : 817 – 823 .
- Hollaus , M. 2006 . Accuracy of large-scale canopy heights derived from LiDAR data under operational constraints in a complex alpine environment . ISPRS Journal of Photogrammetry and Remote Sensing , 60 : 323 – 338 .
- Hopkinson , C. 2005 . Vegetation class dependent errors in LiDAR ground elevation and canopy height estimates in a boreal wetland environment . Canadian Journal of Remote Sensing , 31 : 191 – 206 .
- Hyyppä , H. , et al. , 2005 . Factors affecting the quality of DTM generation in forested areas . International Archives of Photogrammetry, Remote Sensing and Spatial Information Sciences , 36 , 3/W19 , 85 – 90 .
- Hyyppä , J. 2008 . Review of methods of small-footprint airborne laser scanning for extracting forest inventory data in boreal forests . International Journal of Remote Sensing , 29 : 1339 – 1366 .
- Hyyppä , J. , et al. , 2000 . Elevation accuracy of laser scanning-derived digital terrain and target models in forest environment . In: Proceedings of 20th EARSeL symposium and workshops , 14–17 June 2000, Dresden, Germany , 139 – 147 .
- Kraus , K. and Pfeifer , N. 1998 . Determination of terrain models in wooded areas with airborne laser scanner data . ISPRS Journal of Photogrammetry and Remote Sensing , 53 : 193 – 203 .
- Lefsky , M. 1999 . LiDAR remote sensing of the canopy structure and biophysical properties of Douglas-fir western hemlock forests . Remote Sensing of Environment , 70 : 339 – 361 .
- Maltamo , M. 2004 . Estimation of timber volume and stem density based on scanning laser altimetry and expected tree size distribution functions . Remote Sensing of Environment , 90 : 319 – 330 .
- Mutlu , M. 2008 . Mapping surface fuel models using LiDAR and multispectral data fusion for fire behavior . Remote Sensing of Environment , 112 : 274 – 285 .
- Næsset , E. 2002 . Predicting forest stand characteristics with airborne scanning laser using a practical two-stage procedure and field data . Remote Sensing of Environment , 80 : 88 – 99 .
- Næsset , E. 2004 . Accuracy of forest inventory using airborne laser scanning: evaluating the first nordic full–scale operational project . Scandinavian Journal of Forest Research , 19 : 554 – 557 .
- Patenaude , G. 2004 . Quantifying forest above ground carbon content using LiDAR remote sensing . Remote Sensing of Environment , 93 : 368 – 380 .
- Popescu , S.C. 2007 . Estimating biomass of individual pine trees using airborne LiDAR . Biomass & Bioenergy , 31 : 646 – 655 .
- Popescu , S.C. , Wynne , R.H. and Nelson , R.F. 2002 . Estimating plot-level tree heights with LiDAR: local filtering with a canopy-height based variable window size . Computers and Electronics in Agriculture , 37 : 71 – 95 .
- Raber , G.T. 2002 . Creation of digital terrain models using an adaptive lidar vegetation point removal process . Photogrammetric Engineering and Remote Sensing , 68 : 1307 – 1315 .
- Rango , A. 2000 . Morphological characteristics of shrub coppice dunes in desert grasslands of southern New Mexico derived from scanning LIDAR . Remote Sensing of Environment , 74 : 26 – 44 .
- Riaño , D. 2007 . Estimation of shrub height for fuel-type mapping combining airborne lidar and simultaneous color infrared ortho imaging . International Journal of Wildland Fire , 16 : 341 – 348 .
- Shrestha , R. 2005 . Airborne laser swath mapping: quantifying changes in sandy beaches over time scales of weeks to years . ISPRS Journal of Photogrammetry and Remote Sensing , 59 : 222 – 232 .
- Sithole , G. and Vosselman , G. 2004 . Experimental comparison of filter algorithms for bare-Earth extraction from airborne laser scanning point clouds . ISPRS Journal of Photogrammetry and Remote Sensing , 59 : 85 – 101 .
- Sohn , G. and Dowman , I. 2007 . Data fusion of high-resolution satellite imagery and LiDAR data for automatic building extraction . ISPRS Journal of Photogrammetry and Remote Sensing , 62 : 43 – 63 .
- Streutker , D.R. and Glenn , N.F. 2006 . Lidar measurement of sagebrush steppe vegetation heights . Remote Sensing of Environment , 102 : 135 – 145 .
- Su , J. and Bork , E. 2006 . Influence of vegetation, slope, and Lidar sampling angle on DEM accuracy . Photogrammetric Engineering & Remote Sensing , 72 : 1265 – 1274 .
- Suárez , J.C. 2005 . Use of airborne LiDAR and aerial photography in the estimation of individual tree heights in forestry . Computers & Geosciences , 31 ( 2 ) : 253 – 262 .
- Velázquez-Martí , B. 2010 . Dendrometric and dasometric analysis of the bushy biomass in Mediterranean forests . Forest Ecology and Management , 259 : 875 – 882 .
- Wack , R. and Wimmer , A. 2002 . Digital terrain models from airborne laser scanner data – a grid based approach . International Archives of Photogrammetry and Remote Sensing , 35 ( 3B ) : 293 – 296 .
- Wang , C. 2009 . Separation of ground and low vegetation signatures in LiDAR measurements of salt-marsh environments . IEEE Transactions on Geoscience and Remote Sensing , 47 : 2014 – 2023 .
- Yu , X. 2004 . Automatic detection of harvested trees and determination of forest growth using airborne laser scanning . Remote Sensing of Environment , 90 : 451 – 462 .
- Zhang , K. 2003 . A progressive morphological filter for removing nonground measurements from airborne LiDAR data . IEEE Transactions on Geoscience and Remote Sensing , 41 : 872 – 882 .
- Zhang , Y. and Guindon , B. 2009 . Multi-resolution integration of land cover for sub-pixel estimation of urban impervious surface and forest cover . International Journal of Digital Earth , 2 ( 2 ) : 89 – 108 .