Abstract
Remote sensing technology is the important tool of digital earth, it can facilitate nutrient management in sustainable cropping systems. In the study, two types of radial basis function (RBF) neural network approaches, the standard radial basis function (SRBF) neural networks and the modified type of RBF, generalized regression neural networks (GRNN), were investigated in estimating the nitrogen concentrations of oilseed rape canopy using vegetation indices (VIs) and hyperspectral reflectance. Comparison analyses were performed to the spectral variables and the approaches. The Root Mean Square Error (RMSE) and determination coefficients (R2) were used to assess their predictability of nitrogen concentrations. For all spectral variables (VIs and hyperspectral reflectance), the GRNN method produced more accurate estimates of nitrogen concentrations than did the SRBF method at all ranges of nitrogen concentrations, and the better agreements between the measured and the predicted nitrogen concentration were obtained with the GRNN method. This indicated that the GRNN method is prior to the SRBF method in estimation of nitrogen concentrations. Among the VIs, the Modified Chlorophyll Absorption in Reflectance Index (MCARI), MCARI1510, and Transformed Chlorophyll Absorption in Reflectance Index are better than the others in estimating oilseed rape canopy nitrogen concentrations. Compared to the results from VIs, the hyperspectral reflectance data also gave an acceptable estimation. The study showed that nitrogen concentrations of oilseed rape canopy could be monitored using remotely sensed data and the RBF method, especially the GRNN method, is a useful explorative tool for oilseed rape nitrogen concentration monitoring when applied on hyperspectral data.
Introduction
Digital agriculture and precision agriculture will be an inevitable trend of agricultural development in the twenty-first century in the world, they are also important components of digital earth. Nitrogen, an essential element for plant growth and a key element of agricultural input, is an important monitoring object in precision agriculture. Increased use of nitrogen fertilizers has also led to increased nitrogen loss from agro ecosystems, especially since the 1950s (Eickhout et al. Citation2006). In some areas, excessive nitrogen application has led to nitrogen pollution, causing hazards to humans and ecology systems. Therefore, efficient monitoring of plant nitrogen status is essential to reach a balance among increasing cost of nitrogen fertilizer, the demand by the crop, and the need to minimize environmental perturbations, especially water pollution. However, traditional methods of measuring crop nitrogen status depend on plants sampled from fields and chemical assays in laboratories, which could not meet the need for rapid, real-time and nondestructive monitoring, and effective diagnosis of plant nitrogen concentration. Remote sensing is a key tool for assessing agriculture condition over large areas, offering the possibility to analyze plant biochemical conditions at a wide range of spatial scales. Due to high efficiency and large-area coverage, remote sensing methods have been used for the estimation of plant nitrogen concentration (Pinter et al. Citation2003, Abdel-Rahman et al. Citation2010).
Empirical regression models are an often used popular method for crop biochemical estimation with hyperspectral data. They fit a relationship between reflectance and some biochemical variables, mainly by the use of vegetation indices (VIs) (Broge and Mortensen Citation2002, Serrano et al. Citation2002, Xavier and Vettorazzi Citation2004). Several studies have been reported for the estimation of biochemical parameters with canopy spectra using traditional statistical regression methods (Martin and Aber Citation1997, Huang et al. Citation2004, Schmidtlein and Sassin Citation2004, Tang et al. Citation2004, Cho and Skidmore Citation2009). A recurring problem that inhibits the use of traditional regression methods for crop biochemical estimation is the difficulty in achieving stable results of prediction. The regression models often need to be optimized for a particular geographic location or a vegetation type (Walthall et al. Citation2004). Recently, the artificial neural network (ANN) has been widely introduced to estimate the biochemical variables with remotely sensed observations. With this method, ANN is considered as a ‘black box’ that fits a relationship between reflectance values and canopy biochemical variables (Monteiro et al. Citation2007, Liu et al. Citation2010). This technique starts with an inherently parallel processing, an adaptive learning, and nonlinear technique. The back propagation neural network (BPNN) is the most widely used ANN for crop biochemical estimation. However it has the limitation of being over-fitting and unstable (Tay and Cao Citation2001). As one of ANN, the radial basis function (RBF) neural network was introduced for our study due to the advantages of its simple architecture, stabilization, and processing efficiency.
In the past three decades, the broad band VIs such as Normalized Difference Vegetation Index (NDVI) (Rouse Citation1974), Ratio Vegetation Index (RVI) (Pearson and Miller Citation1972), and Perpendicular Vegetation Index (PVI) (Richardson and Wiegand Citation1977) were widely used to quantify crop variables, including wet biomass, leaf area index, plant height, and grain yield (Thenkabail et al. Citation2000, Huang et al. Citation2004, Tang et al. Citation2004, Wang et al. Citation2008). Recent literatures of related studies suggested that the narrow bands may be crucial for providing additional information with significant improvements over broad bands in quantifying biophysical and biochemical characteristics of agriculture crops (Haboudane et al. Citation2002, Wang et al. Citation2004, Karimi et al. Citation2006, Yang et al. Citation2006, Thoren and Schmidhalter Citation2009), although few studies showed that there is no significant difference between narrow and wide bands. Some narrow spectral bands were identified to quantify crop nitrogen status (Graeff and Claupein Citation2003, Behrens et al. Citation2006). Furthermore, a number of narrowband VIs were also developed for detecting nitrogen/chlorophyll concentrations in cotton (Tarpley et al. Citation2002), in corn (Graeff and Claupein Citation2003), in wheat (Broge and Mortensen Citation2002, Feng Citation2008), in potato (Herrmann et al. Citation2010), and other vegetations (Haboudane et al. Citation2002, Perry and Davenport Citation2007). However, few studies have reported on the use of narrowband vegetation index in nitrogen concentration estimation of oilseed rape canopy (Behrens et al. Citation2006, Wang et al. Citation2009).
In this study, nitrogen concentration of oilseed rape canopy was estimated from an experiment designed to control oilseed rape species and nitrogen fertilization. Two types of the RBF neural network, the standard RBF and the modified type of RBF, generalized regression neural networks (GRNN) are investigated in this study. The objectives of this research are to: (1) evaluate the potential of VIs and the reflectance (R) of discrete bands to estimate nitrogen concentration of oilseed rape canopy and (2) to compare the performances of the two types of RBF approaches for estimating nitrogen concentration using VIs and the reflectance of discrete bands.
Materials and methods
Experiment site
The experiment site is located at the Zhejiang University Experiment Farm, Hangzhou, Zhejiang province, China, 30°14 3″ N, 120°10 5″E, and the ground of plot is horizontal surface. The experiment area has a monsoon climate with a hot summer, a cool winter, and marked seasonal variations in precipitation. From 1961 to 1990, the average annual rainfall was 1374.7 mm. The soil is sandy loam paddy type with 5.7 of pH, 16.5 g/kg in organic matter content and 1.02 g/kg for total N.
Rape species Zheshuang No. 72, Youcai No. 92-58, Huyou No. 15, Gaoyou No. 605, Zhongshuang No. 9, and Huaza No. 4 were selected for the investigation. Three nitrogen treatments were set, with the concentrations of 0, 150, and 300 kg/hm2 (denoted as N1, N2, and N3), respectively, using urea as the nitrogen fertilizer. The three treatment levels represented no nitrogen fertilizer, a normal application and a superabundant dose, and each having two repeats. A completely randomized design consisting of 36 experiment plots of 10.3 m×1.39 m was used, with six plots for each variety.
Data acquisition
A spectroradiometer with wavelength ranging from 350 to 2500 nm, manufactured by Analytical Spectral Devices™, was used to acquire spectral data of oilseed rape canopy. The reflectance is the ratio of energy reflected off the rape canopy to energy incident on the rape canopy (measured using a BaSO4 white reference). The measurements of oilseed rape spectra were performed eight times between 11:00 and 14:00 local time on 55, 75, 89, 133, 165, 189, 208, and 220 days after seeding in 2003–2004 growing season (the seeding occurred on 29 September 2003). Ten reflectance measurements were taken consistently within each plot at randomly selected locations, with a nadir view from a height of 1.0 m above oilseed rape canopy, using a 25° of field of view (FOV). By averaging these 10 measurements, a single reflectance measurement was obtained for each measurement location, thereby, minimizing measurement noise. Instrument optimization and white reference measurements were performed prior to each measurement. Due to severe noise in the water absorption spectrum from 1290 nm to 1480 nm, from 1780 nm to 2000 nm, and from 2350 nm to 2500 nm, the study used only the data from 350 nm through 1290 nm, 1480 nm through 1780 nm, and 2000 nm through 2350 nm were used.
For the nitrogen concentration measurements, four plants of oilseed rape were sampled for each plot after the spectral measurement and the location of the sampling is the same as the location of spectral measurements. The fresh weight of the four plants was measured after excision of their roots, the above-ground plants were then put into an oven to dry at 105°C for half an hour and then 70°C until a constant weight was acquired. After that the dry plant parts were ground up for nitrogen concentration measurement. Nitrogen concentration (N) was determined by Kjeldahl (Citation1883) after acid digest and the results were expressed in milligram nitrogen per gram dry weight.
Vegetation indices and discrete bands used
To enhance the sensitivities to vegetation spectral signals and to reduce external effects such as noise related to soil and atmospheric influences, many VIs were developed in the past four decades. Ten VIs were selected for monitoring nitrogen concentration of oilseed rape at canopy level in this study. They are commonly used VIs in the remote sensing community, or are highly correlated with nitrogen and chlorophyll concentrations (Daughtry et al. Citation2000, Haboudane et al. Citation2002, Martin et al. Citation2005, Suárez et al. Citation2008). These VIs are listed in . In addition, five discrete bands identified in our previous study (Wang et al. Citation2009), 730, 808, 1106, 1632, 2011, and one special band, 850 nm, introduced by Behrens et al. (Citation2006) for oilseed rape were used as independent variables in this study.
Table 1. Vegetation indices (VIs) used in this study.
Radial basis function neural network
The study considered two different types of RBF neural network, including standard RBF neural network, which is the most basic and widely used and more recent GRNN. The RBF neural network programs were written in MATLAB 7.0.
Standard radial basis function
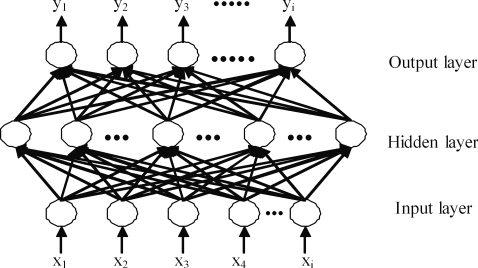
The RBF is a feed forward network, which has only one hidden layer and involves an unsupervised training component in it (). The input to each RBF neuron is treated as a measure of the difference between data and a ‘center’, which is a parameter of its transfer function. The transfer function of the neuron indicates that the influence of data points is at the center of the data distribution curve. Generally this function follows Gaussian distribution and its centers can be chosen in two ways: randomly from the training data, iteratively trained or derived using techniques like K-means, Max-min algorithms, and Kohonen self organizing maps. After this unsupervised learning and cluster formations the weights between the hidden and output layer neurons are determined by multiple regressions in a supervised manner. The concept of such a fragmented learning is borrowed from certain biological neurons, which function on the basis of ‘locally tuned response’ to sensing. The RBF does not involve iterative training, which saves much of the training time. The standard radial basis function (SRBF) has been found to be more useful than the widely used BPNN (Sudheer and Jain Citation2004, Singh and Deo Citation2007). In this study, the most common RBF function, that is, the Gaussian, was employed. The values of spread constants were determined based on empirical tuning.
Generalized regression neural networks
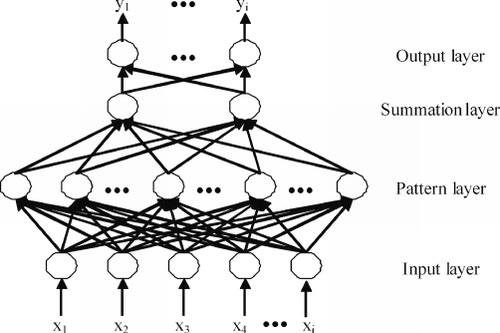
As a modified type of RBF, GRNN does not require an iterative training procedure as with the back propagation method. The GRNN consists of four layers: input layer, pattern layer, summation layer, and output layer (Firat et al. Citation2010). A schematic of the GRNN is shown in .The first layer is fully connected to the second, pattern layer, where each unit represents a training pattern and its output is a measure of the distance of the input from the stored patterns. Each pattern layer unit is connected to the two neurons in the summation layer: the S-summation and D-summation neuron. The S-summation neuron computes the sum of the weighted outputs of the pattern layer while the D-summation neuron calculates the unweighted outputs of the pattern neurons. The connection weight between a neuron in the pattern layer and an S-summation neuron is the target output value corresponding to the given input pattern. For the D-summation neuron, the connection weight is unity. The output layer merely divides the output of each S-summation neuron by that of each D-summation neuron (Kim et al. Citation2004).
The validation analysis
The performances of the RBF were compared using the Root Mean Square Error (RMSE) and determination coefficients (R2). The best result was chosen on the basis of the lowest RMSE and the highest R2 (trend to 1):
In this study, the total 241 canopy spectra were associated with nitrogen measurements. The total set of data was divided into two subsets by random assignment, one for calibration (162 samples) and the other for validation (79 samples). The dependent variable in the regression analysis is nitrogen concentration of oilseed rape canopy and independent variables are the VIs and reflectance at discrete narrow bands.
Results and analysis
RBF-based N estimation from vegetation indices
As described previously, each layer consists of ‘neurons.’ The input layer has the same number of ‘neurons’ as the input parameters, and the output layer has the same number of ‘neurons’ as the output parameters. There is no theoretical background about the number of hidden layer(s) as well as ‘neurons.’ Thus, we must determine the proper network structure. Each vegetation index is the input vector and the nitrogen concentration is the output vector. In order to accelerate the train process, all vectors were normalized to the value between 0 and 1. In this work, the proper parameters of RBF model were obtained based on empirical tuning. The proper number of hidden nodes and other network control parameters of the RBF models used in this study are given as follows. The spread constant in the range of 0.001–0.1 and 25 neurons with the SRBF, and the spread constant in the range 0.005–0.1 for different VIs for the GRNN, were determined to give the best results, respectively.
For the results of model performance analysis by calibration dataset, both the SRBF and GRNN method reached a significant level of 0.01. In terms of RMSE and R2, the GRNN methods were superior to the SRBF methods for all the VIs, indicated by lower RMSE and R2 obtained by the GRNN methods. Among the VIs used in the present study, the Modified Chlorophyll Absorption in Reflectance Index (MCARI), MCARI1510, and Transformed Chlorophyll Absorption in Reflectance Index (TCARI) appeared to be better than the others in estimating nitrogen concentrations of oilseed rape at canopy level. For the SRBF method, there is a tend that the estimated nitrogen concentration reaches a plateau (around 3) after the measured value of nitrogen concentration is greater than 3.5. This indicates that nitrogen concentration could be underestimated at nitrogen concentration greater than 3.5. However, for the GRNN method, the saturation plateau is not clearly observed, this indicates that the underestimates for nitrogen concentration at this range (3.5–5) was relieved with this method.
RBF-based N estimation from R
In the study, reflectance at the five discrete bands, 730, 808, 1106, 1632, and 2011 nm, selected based on stepwise regression method employed in our previous study (Wang et al. Citation2009), and reflectance at the one special band, 850 nm, were used to estimate nitrogen concentration of oilseed rape. In the same way as the RBF-based N estimation with VIs, after performing a very large number of trials (greater than 1,000,000 trials), a proper number of hidden nodes and other network control parameters were selected for the RBF-based N estimation using hyperspectral bands as independent variables. When reflectance at the five discrete bands were used to be independent variables in the RBF models, the spread constant with 0.04 and 25 neurons for the SRBF method, and the spread constant with 0.001 for the GRNN method, were determined to give the best results, respectively. Similarly, when reflectance at the 850 nm was used to be independent variable, the best RBF models were established using the spread constant with 0.01 and 25 neurons for the SRBF method, and the spread constant with 0.02 for the GRNN method, respectively. For the calibration dataset, this result using reflectance at discrete narrow bands as independent variables is acceptable. The RBF models with the five discrete bands as independent variables yielded an R2 of 0.64 with a RMSE of 0.68 for SRBF method, R2 of 0.82 with a RMSE of 0.49 for GRNN method, the RBF models with the one special band as independent variables yielded an R2 of 0.56 with a RMSE of 0.75 for SRBF method, and R2 of 0.67 with a RMSE of 0.66 for GRNN method.
Evaluation of the predictions made by the RBF methods
The models trained from the calibration data were applied to the validation dataset in order to evaluate the SRBF and GRNN models in estimating nitrogen concentration of oilseed rape at the canopy level. The RMSE and R2 values were calculated for all models.
The RMSE and R2 are summarized in . Compared to the results from the calibration dataset, the results from the validation dataset seem to be a little worse, which is common for statistical models. show that the GRNN method yielded the smallest RMSE of 0.53 and the largest R2 value of 0.68 for the validation dataset using MCARI as the independent variable. Performance comparisons showed that the prediction ability of models obtained by the GRNN method was greater than that of models obtained by the SRBF method. Compared to the SRBF models, the corresponding GRNN models improved the estimation of nitrogen concentration by increasing R2 from 12.29% to 30.61% and by lowering RMSE from 20.23% to 30.84% among the different indices for validation dataset. Comparison between the results by using the SRBF and GRNN methods, respectively, revealed that the GRNN method is prior to the SRBF method in estimating nitrogen concentration of oilseed rape in this study.
Table 2. Results of model performance analysis for validation datasets.
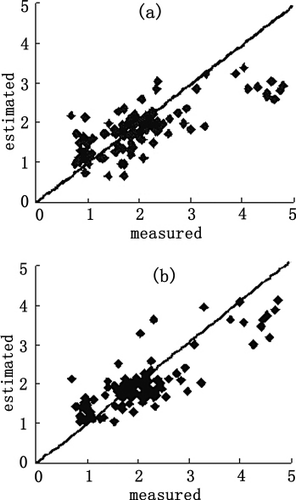
In order to make the comparison of results more convincing and visual, the measured nitrogen concentration against the estimated nitrogen concentration obtained using as MCARI independent variable was plotted in . It is clearly obvious from the figure, the GRNN model (b) makes the points more convergent to the line 1:1 than does the SRBF model (a). It can be seen that the relationships between spectral variables and nitrogen concentration have been improved by the GRNN model.
Discussion and conclusion
Quantification of the nitrogen concentration of oilseed rape at canopy level using its hyperspectral data provides an avenue to improve the interpretation of remotely sensed data over vegetated areas, and valuable information to aid the development of approaches for ecosystem functioning and ecosystem productivity. Due to the complexity of the relationship between hyperspectral data and nitrogen concentration, this study used the RBF neural networks to estimate nitrogen concentration of oilseed rape canopy using VIs and reflectance at discrete narrow bands. It allowed us to compare, on a consistent basis, the performance of a set of VIs, and the discrete hyperspectral bands. As a result of thorough analyses for both calibration and validation datasets, the following conclusions are drawn.
By systematically evaluating the SRBF method and the GRNN method, the GRNN method yielded a higher R2 and lower RMSE as compared with the SRBF method for both the calibration and the validation dataset. It is concluded that the GRNN method is superior to the SRBF method in estimating nitrogen concentration of oilseed rape at canopy level. Among the VIs, the MCARI, MCARI1510, and TCARI appeared to be better than the other VIs in quantifying oilseed rape canopy nitrogen concentrations. As for the discrete hyperspectral bands, the predictions made by using the five discrete bands generally were acceptable as compared to most VIs used in the study. In contrast to the result from Behrens et al. (Citation2006), the predictions made from the band, 850 nm, were not really perfect in the study. Hence, more data are needed for further analysis.
Overall, the applications of the RBF neural networks, especially the GRNN can be used for the real time estimation of nitrogen concentration of oilseed rape at canopy level successfully. Such an approach holds a strong potential for operational quantification of nitrogen concentration. Hence, this work demonstrates that the RBF method provides a useful explorative tool for monitoring nitrogen concentration, especially with the GRNN method. This is important for precision agriculture, and potentially, for other vegetation environments.
Notes on contributors
Fumin Wang is an associate professor at Zhejiang University. He got his bachelor degree from Nanjing Institute of Meteorology, Nanjing, China, and his doctor degree in agricultural remote sensing and GIS application from Zhejiang University, Hangzhou, China. His primary research areas include the retrieval of crop physical and biophysical properties using hyperspectral reflectance, and the applications of remote sensing technologies to estimating the planting area of crop, monitoring their growth, and predicting grain yields at variable spatial and temporal scales. Recently, he pays more attention to ecohydrological models.
Jingfeng Huang is a professor at Zhejiang University. He got his bachelor and master degrees from Nanjing Institute of Meteorology, and his doctor degree in agricultural remote sensing and GIS application from Zhejiang University. His primary research areas cover theoretical development and applications of remote sensing technologies to estimating the planting area of crop, monitoring their growth, and predicting grain yields at variable spatial and temporal scales, and theoretical development of algorithms to detect crop stresses, including disease and nutrient deficiencies with remote and in-situ measurements, field radiometry, corrections of atmospheric effects of satellite imagery, vegetation indices, data fusion, and assimilation techniques to quantitatively derive crop physical and biophysical properties.
Yuan Wang is a Ph.D. student at Zhejiang University. He got his bachelor and master degrees from Zhejiang University. His primary research area is hyperspectral retrieval of biochemical parameters of crop.
Zhuanyu Liu is a research assistant at the Institute of Remote Sensing and Earth Sciences, Hangzhou Normal University. He got his doctor degree from Zhejiang University. His primary research area is the application of hyperspectral remote sensing technology in crop disease monitoring.
Dailiang Peng is an assistant research fellow at Center for Earth Observation and Digital Earth, Chinese Academy of Sciences. He got his doctor degree from Zhejiang University. His primary research areas include the applications of remote sensing technologies to estimating the planting area of crop, monitoring their growth, and predicting grain yields at variable spatial and temporal scales, and the vegetation-climate interactions.
Feifeng Cao is an engineer at Bureau of Water Resources and Hydropower Engineering of Zhejiang Provinces. She got her bachelor degree from Harbin Engineering University, and master and doctor degrees from Zhejiang University. His primary research area is the application of remote sensing into hydrology modeling and water resource management.
Acknowledgements
We would like to thank La Chen, Qiuxiang Yi, and Xiaohua Yang for collecting the remote sensing and oilseed rape biochemical data, and Wei Ji for English editing. This work was supported by Zhejiang Provincial Natural Science Foundation of China (Y5100021) and the Natural Science Foundation of China (41171276, 51109183).
References
- Abdel-Rahman, E.M., Ahmed, F.B., and van den, B.M., 2010. Estimation of sugarcane leaf nitrogen concentration using in situ spectroscopy. International Journal of Applied Earth Observation and Geoinformation, 12 (1), 52–57.
- Behrens, T., et al., 2006. Utilization of canopy reflectance to predict properties of oilseed rape (Brassica Napus L.) and barley (Hordeum Vulgare L.) during ontogenesis. European Journal of Agronomy, 25, 345–355.
- Broge, N.H. and Mortensen, J.V., 2002. Deriving green crop area index and canopy chlorophyll density of winter wheat from spectral reflectance data. Remote Sensing of Environment, 81, 45–57.
- Cho, M.A., & Skidmore, A.K., 2009. Hyperspectral predictors for monitoring biomass production in Mediterranean mountain grasslands: Majella National Park, Italy. International Journal of Remote Sensing, 30 (2), 499–515.
- Daughtry, C.S.T., Walthall, C.L., and Kim, M.S., 2000. Estimating corn leaf chlorophyll concentration from leaf and canopy reflectance. International Journal of Remote Sensing, 74, 229–239.
- Eickhout, B., Bouwman, A.F., and van Zeijts, H., 2006. The role of nitrogen in world food production and environmental sustainability.. Agriculture, Ecosystems and Environment, 116, 4–14.
- Feng, W., 2008. Monitoring leaf nitrogen accumulation in wheat with hyper-spectral remote sensing. Acta Ecologica Sinica, 28 (1), 23–32.
- Firat, M., Turan, M.E., and Yurdusev, M.A., 2010. Comparative analysis of neural network techniques for predicting water consumption time series. Journal of Hydrology, 384, 46–51.
- Gitelson, A.A. and Merzlyak, M.N., 1996. Signature analysis of leaf reflectance spectra: algorithm development for remote sensing. Journal of Plant Physiology, 148, 493–500.
- Graeff, S. and Claupein, W., 2003. Quantifying nitrogen status of corn (Zea mays L.) in the field by reflectance measurements. European Journal of Agronomy, 19, 611–618.
- Haboudane, D. et al., 2002. Integrated narrow-band vegetation indices for prediction of crop chlorophyll content for application to precision agriculture. International Journal of Remote Sensing, 81, 416–426.
- Herrmann, I., Miller, J.R., and Tremblay, N., 2010. Swir-Based Spectral indices for assessing nitrogen content in potato fields. International Journal of Remote Sensing, 31, 5127–5143.
- Huang, J.F., Wang, F.M., and Wang, X.Z., 2004. Relationship between narrow band normalized deference vegetation index and rice agronomic variables. Communications in Soil Science and Plant Analysis, 20, 2689–2708.
- Huete, A.R., 1988. A soil adjusted vegetation index SAVI. Remote Sensing of Environment, 25, 295–309.
- Karimi, Y., Prasher, S.O., and Patel, R.M., 2006. Application of support vector machine technology for weed and nitrogen stress detection in corn. Computers and Electronics in Agriculture, 51, 99–109.
- Kim, M.S., 1994. The use of high spectral resolution bands for estimating absorbed photosynthetically active radiation APAR. In: Proceedings of the 6th symposium on physical measurements and signatures in remote sensing, 17–21 January, Val D'Isere, France, 299–306.
- Kim, B., et al., 2004. Prediction of plasma etching using a randomized generalized regression neural network. Vacuum, 76, 37–43.
- Kjeldahl, J.Z., 1883. A new method for the determination of nitrogen in organic bodies. Analytical Chemistry, 22, 366–382.
- Liu, M., Liu, X., and Li, M., 2010. Neural-network model for estimating leaf chlorophyll concentration in rice under stress from heavy metals using four spectral indices. Biosystems Engineering, 106 (3), 223–233.
- Martin, M.E. and Aber, J.D., 1997. High spectral resolution remote sensing of forest canopy lignin, and ecosystem process. Ecological Applications, 7, 431–443.
- Martin, S., Atzberger, C., and Hill, J., 2005. Remote sensing of forest biophysical variables using HyMap imaging spectrometer data. Remote Sensing of Environments, 95, 177–194.
- Monteiro, S.T., Minekawa, Y., and Kosugi, Y., 2007. Prediction of sweetness and amino acid content in soybean crops from hyperspectral imagery. ISPRS Journal of Photogrammetry and Remote Sensing, 62 (1), 2–12.
- Pearson, R.L. and Miller, L.D., 1972. Remote mapping of standing crop biomass for estimation of the productivity of the short-grass prairie, Pawnee National Grasslands, Colorado. Ann Arbor, MI: ERIM, 1357–1381.
- Perry, E.M. and Davenport, J.R., 2007. Spectral and spatial differences in response of vegetation indices to nitrogen treatments on apple. Computers and Electronics in Agriculture, 59, 56–65.
- Pinter, P.J. Jr., Hatfield, J.L., and Schepers, J.S., 2003. Remote sensing for crop management. Photogrammetric Engineering & Remote Sensing, 69, 647–664.
- Qi, J., Chehbouni, A., and Huete, A.R., 1994. A modified soil adjusted vegetation index MSAVI. Remote Sensing of Environment, 48, 119–126.
- Richardson, A.J. and Wiegand, C.L., 1977. Distinguishing vegetation from soil background information. Photogrammetry Engineering & Remote Sensing, 43 (12), 1541–1552.
- Rondeaux, G., Steven, M., and Baret, F., 1996. Optimisation of soil-adjusted vegetation indices. International Journal of Remote Sensing, 55, 95–107.
- Roujean, J.L. and Breon, F.M., 1995. Estimating PAR absorbed by vegetation from bidirectional reflectance measurements. International Journal of Remote Sensing, 51, 375–384.
- Rouse, J.W., 1974. Monitoring the vernal advancements and retrogradation of natural vegetation. In: NASA/GSFC, Final Report. Greenbelt, MD. 1–137.
- Schmidtlein, S. and Sassin, J., 2004. Mapping of continuous floristic gradients in grasslands using hyperspectral imagery. Remote Sensing of Environment, 92, 126–138.
- Serrano, L., Penuelas, J., and Ustin, S.L., 2002. Remote sensing of nitrogen and lignin in Mediterranean vegetation from AVIRIS data: decomposing biochemical from structural signals. Remote Sensing of Environment, 81 (3), 355–364.
- Singh, P. and Deo, M.C., 2007. Suitability of different neural networks in daily flow forecasting. Applied Soft Computing, 7, 968–978.
- Suárez, L., Zarco-Tejada, P.J., and Sepulcre-Canto, G., 2008. Assessing canopy PRI for water stress detection with diurnal airborne imagery. Remote Sensing of Environment, 112, 560–575.
- Sudheer, K.P. and Jain, S.K., 2004. Radial basis function neural network for modeling rating curves. Journal of Hydrologic Engineering, 8, 161–164.
- Tang, Y.L., Wang, R.C., and Huang, J.F., 2004. Relations between red edge characteristics and agronomic parameters of crops. Pedosphere, 14, 467–474.
- Tarpley, L., Reddy, K.R., and Sassenrath-Cole, G.F., 2002. Reflectance indices with precision and accuracy in predicting cotton leaf N concentration. Crop Science, 40, 1814–1819.
- Tay, F., and Cao, L.J., 2001. Application of support vector machines in financial time series forecasting. Omega, 29, 309–317.
- Thenkabail, P.S., Smith, R.B., and De Pauw, E., 2000. Hyperspectral vegetation indices and their relationships with agricultural crop characteristics. Remote Sensing of Environment, 71, 158–182.
- Thoren, D. and Schmidhalter, U., 2009. Nitrogen status and biomass determination of oilseed rape by laser-induced chlorophyll fluorescence. European Journal of Agronomy, 30, 238–242.
- Walthall, C., Dulaney, W., and Anderson, M., 2004. A comparison of empirical and neural network approaches for estimating corn and soybean leaf area index from Landsat ETM+ imagery. International Journal of Remote Sensing, 92, 465–474.
- Wang, Y., Wang, F., and Huang, J., 2009. Validation of artificial neural network techniques in the estimation of nitrogen concentration in rape using canopy hyperspectral reflectance data. International Journal of Remote Sensing, 30 (17), 4493–4505.
- Wang, Z.J., Wang, J.H., and Liu, L.Y., 2004. Prediction of grain protein content in winter wheat Triticum aestivum L. using plant pigment ratio PPR. Field Crops Research, 90, 311–321.
- Wang, F., Huang, J., and Zhou, Q., 2008. Optimal waveband identification for estimation of leaf area index of paddy rice. Journal of Zhejiang University Science B, 9, 953–963.
- Xavier, A.C. and Vettorazzi, C.A., 2004. Mapping leaf area index through spectral vegetation indices in a subtropical watershed. International Journal of Remote Sensing, 25, 1661–1672.
- Yang, X.H., Huang, J.F., and Wang, F.M., 2006. A modified chlorophyll absorption continuum index for chlorophyll estimation. Journal of Zhejiang University Science A, 7, 2002–2006.