Abstract
The importance of accurately mapping and monitoring land cover changes over time is increasing, especially in rapidly growing coastal cities. In this study, three pairs of Landsat images of Yantai, a representative coastal city in China, from 1989, 1999, and 2009 were selected to monitor land cover changes and urban sprawl dynamics. To improve the classification accuracy, three classification methods together with the minimum noise fraction (MNF) and pixel purity index (PPI) calculations were performed on the images. The classification results showed that the overall five-class classification accuracies averaged 91.38% for the 20-year period, which produced an accuracy of 83.78% for change maps. The analysis of change maps indicated that from 1989 to 2009, the percentage of urban area increased from 31.41% to 50.28% of the total area, and the newly urbanized area was mainly located in residential areas and the reclaimed harbor region. Analysis of the relationships between urban area and its driving forces obtained from statistical data found that the urban sprawl of Yantai before 2000 was relatively extensive, which is consistent with the conclusion drawn by using remote sensing techniques. The research results could be used as inputs for sustainable urban management and establishing Digital Earth database.
1. Introduction
Digital Earth (DE) is an information-based expression of the real Earth and a new way of understanding the Earth in the twenty-first century (Guo et al. Citation2009). It could be used to solve technical problems (i.e. remote sensing technology) and offer immediate access to enormous quantities of data and information (Elmes et al. Citation2009), which would be helpful and significant in the studies of land cover change in urban environments. Urban expansion, which is commonly referred to as urban sprawl, has long been considered one of the most important signs of regional economic vitality. Although urban areas currently cover only about 3% of the Earth's land surface, they have already had remarkable effects on environmental conditions at local and global scales (Herold et al. Citation2003, Liu et al. Citation2002). Rapid urban expansion has had serious ramifications for the environment and sustainable socioeconomic development, such as degradation of air and water quality, loss of farmland and forests, and the effects of socioeconomic disparities (Squires Citation2002). These repercussions should attract more attention from decision makers to make informed decisions that could balance the positive and negative aspects of urban sprawl to ensure sustainable development.
To monitor land cover change in urban areas, studies have been done on the potential of remotely sensed imagery, which can provide an efficient means for understanding, modeling, and projecting land cover changes in urban areas (Elvidge et al. Citation2004). Recent work, for example, in the area of urban modeling and planning (Jensen and Im Citation2007, Jat et al. Citation2008, Yuan Citation2008) and urban heat island (Weng Citation2001, Kato and Yamaguchi Citation2005), has shown that remotely sensed imagery has the potential to provide accurate and timely information to describe land cover changes in urban areas, especially for developing countries (Dong et al. Citation1997), and that these techniques have become viable alternatives to conventional ways.
There are various change detection methods using remotely sensed images for determining land cover changes in urban environments. Among these techniques, the pre- and post-classification comparison methods have been extensively used (Coppin et al. Citation2004). The pre-classification comparison methods apply various algorithms directly to remote sensing imagery to generate change and no-change maps. They are effective for locating changes but could not provide information on the nature of change (Ridd and Liu Citation1998); post-classification comparison techniques, conversely, use separate classifications of images acquired at different times to produce difference maps from which ‘from–to’ change information can be generated (Jensen et al. Citation2004). It could be employed using data acquired from satellite sensors with different spatial, temporal, and spectral resolutions (Alphan Citation2003, Coppin et al. Citation2004).
As one of the most representative developing countries, China has experienced rapid socioeconomic development over the last three decades. Together with economic development, the changes of land cover and the impacts on the environment due to urbanization are significant (Carlson and Arthur Citation2000, Liu et al. Citation2002). Until now, research has been done on the urbanization and consequential land cover changes of some large cities, such as Beijing (Zhao Citation2010, He et al. Citation2011), Shanghai (Li et al. Citation2010), Guangzhou (Weng Citation2002), and the new economic star city of Shenzhen (Shi et al. Citation2000, Sui and Zeng Citation2001). However, less attention has been paid to coastal cities located in East China that could vividly depict the general characteristics of coastal urbanization in this country over the past decades. Yantai is one of the most representative mid-sized coastal cities in China with 150 years of history since it opened the harbor for international business in May 1861. Now it is the largest fishing seaport and the second largest industrial city in Shandong province. As reported by the Chinese Academy of Social Sciences in August 2008, Yantai ranks third globally in the top 20 cities, with the most rapid economic growing cities in the past 5 years. Its developmental characteristics and land cover changes provide good representation of eastern coastal cities, since most of them have experienced the same political, economic, and technical revolutions.
This study describes the methods and results of land cover classifications and post-classification change detection by multi-temporal Landsat images of Yantai for the years of 1989, 1999, and 2009. The objectives were to: (1) map and monitor land cover changes by post-classification change detection methods; (2) assess the accuracies of multi-temporal Landsat classifications and change detections; and (3) analyze the main factors governing urbanization and land cover changes. The diversity of land covers, combined with the urban growth of Yantai, makes it an ideal area for monitoring land cover change dynamics in urban area.
2. Study area
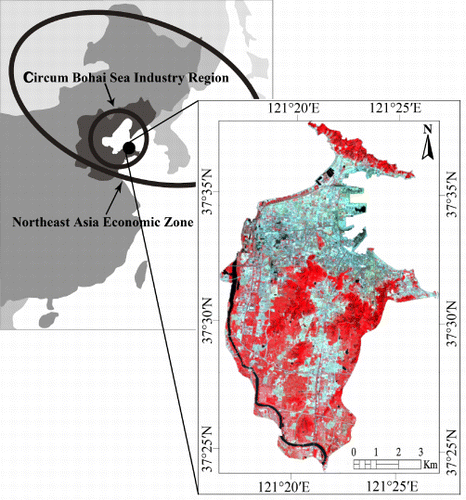
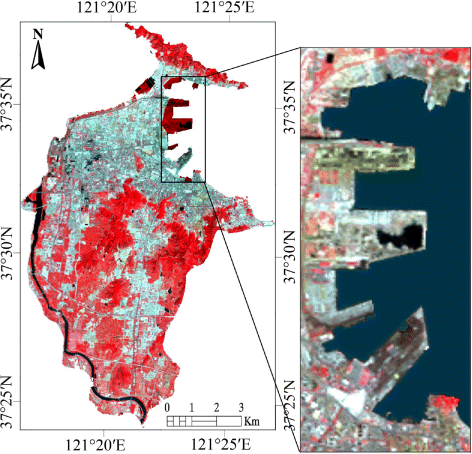
The study area of this research is Yantai, a mid-sized coastal city with an area of approximately 175 km2. It is the subcenter of politics, economics, culture, education, and transportation in the Shandong Peninsula, which is one of the most important parts of the Circum-Bohai-Sea industry region and the Northeast Asian Economic Zone (). It includes a diversity of land cover classes. Both high- and low-density urban development can be found in the north-central portion at the coastal zone while several rural land cover types (agricultural croplands, water bodies, and vegetation) characterize the landscape in the south. The 2010 statistical yearbook of Yantai reported that the city had a population of 692,348, an increase of 36.10% from 1989, and 243,958 households, an increase of 44.95%. The China city statistical yearbook (2010) reported that the urban area of Yantai in 2009 increased by 62.23% of that in 1989, amounting to 92.23 km2, and ranking 13th in China.
3. Data and methods
3.1. Data
Given the retrospective nature of the study, the data used in this study are shown in and described separately as follows.
Table 1. Data types used in this study.
3.1.1. Landsat data
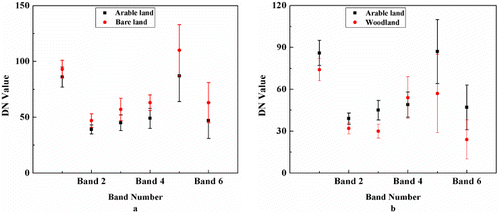
Owing to the nature of land cover types and the influence of satellite sensors and the atmosphere, many land cover types are similar in spectral change, e.g. arable land and bare land () or arable land and woodland (). In this study, we combined early summer and winter images as the data source images, selecting three pairs of bi-temporal cloud-free Landsat images that entirely contained Yantai to classify the land cover types: Landsat-4 TM images, scene 119/34, acquired on 14 January and 2 June 1989; Landsat-7 ETM+ images, scene 119/34, acquired on 12 December 1999 and 12 June 2000; and Landsat-5 TM images (scene 119/34) acquired on 22 June and 17 September 2009. Due to unavailability of the summer image for 1999 and the winter image for 2009, images acquired on 12 June 2000 and 17 September 2009 were selected as alternatives, respectively. In the winter images, arable lands planted with crops (e.g. wheat) could be distinguishable from the already fully shed woodlands. When only a summer image is used, woodlands and some crop lands are spectrally similar; however, the summer image is indispensable to separate crop lands from urban areas that are spectrally similar to bare soil in winter images. Compared to the single date images, using bi-temporal images could efficiently increase the average and minimum separability of classes. Many researchers, including Lunetta and Balogh (Citation1999), Oettera et al. (Citation2000), and Yuan et al. (Citation2005), have demonstrated the value of multi-temporal images for classification of land cover types.
All the Landsat images were rectified to a UTM projection (Zone 51N, Datum: WGS-84) using at least 45 well-distributed ground control points (GCPs) and nearest neighbor resampling. The root mean square errors were < 0.25 pixels (7.5 m) for each of the six images. Excluding the thermal band, all other bands were used in imagery classification.
3.1.2. Reference data
Due to the lack of official statistical data before 1995, a land use map from 1996 was used as a reference for the 1989 classification. Areas that had changed between the years were discarded from the reference data if the 1989 land cover types could not be identified with certainty. Approximately 1.74% of the total pixels were available for training and accuracy assessment, with 80% used for training and 20% for accuracy assessment.
An image captured by the China–Brazil Earth Resources Satellite (CBERS) on 10 April 2000 (19.5 m spatial resolution) was selected for the 1999 training and accuracy assessment. A SPOT Pan image obtained on 21 September 2003 (10 m spatial resolution) was employed as comparison images. The CBERS image was rectified to UTM (Zone 51, WGS-84) using 47 GCPs dispersing throughout the scene and by nearest neighbor resampling. Areas that had changed between the years were discarded if the land cover classes could not be identified. These data included 11,280 pixels, with 6768 pixels used for training and 4512 for accuracy assessment.
The reference data used for the 2009 classification were acquired from two sources. The primary source was a CBERS CCD image acquired on 27 August 2009, which was rectified to UTM (Zone 51, WGS-84) using 49 GCPs dispersing throughout the scene and nearest neighbor resampling; the second source of data was 102 groups of ground truth information obtained from intensive fieldwork for land cover types, which were collected in September and October 2009, with special attentions given to spectrally similar land cover types; at the same time, the images exported from Google Earth were used as comparison images for their different projection and datum. The reference data contained 12,480 pixels, about 2.48% of the total pixels, and 74% were used for training.
In addition to the referenced images, the 20-year socioeconomic data shared by the Yantai Bureau of Statistics (YBS) were used for evaluation of change patterns and driving force analysis.
3.2. Classification methods
Three of the most popular classification methods, maximum likelihood classifier (MLc), artificial neural networks classifier (ANNc), and support vector machine classifier (SVMc), were selected to classify the Landsat images.
Maximum likelihood classifier is a parametric method classifier based on the assumption that the members of each class follow a Gaussian frequency distribution in feature space. It is one of the most widely used classification methods despite its limitations of assuming normal distribution of class signature (Hanson et al. Citation1996).
Artificial neural networks classifier has been successfully applied in a wide range of applications including classification and change detection in remotely sensed images (Foody et al. Citation1995, Dai and Khorram Citation1997). The algorithm structure of ANNc consists of three parts, i.e. input layer, hidden layer, and output layer. Theoretically ANNc is able to achieve an accurate result with high generalization capacity. Nevertheless, in practice, users are faced with a vast selection of possible network architectures and setup parameters in addition to the large variety of training algorithms (Nemmourit and Chibani Citation2005).
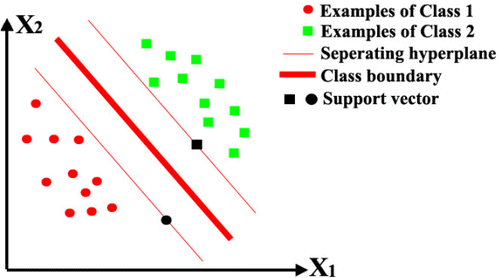
The principle of SVM is to separate examples of opposite categories by maximizing the distance between examples of opposite classes which are closest to the separating hyperplane (see ). It is a range of classification and regression algorithms that have been formulated from the statistical learning theory developed by Vapnik (Citation1995). SVMc has been indicated to have considerable potential for the supervised classification of remotely sensed images. Comparative studies have shown that SVM-based change detection can be more accurate than popular contemporary techniques such as ANNc as well as conventional probabilistic classification methods (Foody and Mathur Citation2004, Nemmourit and Chibani Citation2006). In this study, the radial basis function was selected as the kernel type.
3.3. Image classification
Jensen (Citation2005) suggested that it was not appropriate to attempt to derive more detailed classes using Landsat TM data due to issues of spatial resolution and interpretability. In this study, the total number of land cover types delineated by the classification scheme is five, including agriculture, extraction, forest, urban, and water ().
Table 2. Land cover classification scheme.
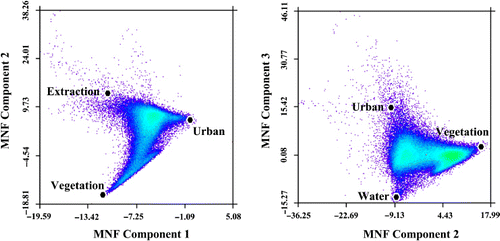
All Landsat images were studied using spectral and spatial profiles to ascertain the digital numbers of different land cover classes prior to classification. Minimum noise fraction (MNF) and pixel purity index (PPI) analyses were performed on the training samples in order to identify endmembers of each land cover class (), which would contribute to improving classification accuracies. The endmembers of each class were then refined, merged, and selected as a region of interest after evaluation of the class histogram and PPI statistical parameters. The three classification methods were then applied to classify the Landsat images.
When the images were derived by the classification methods, the post-classification refinements were applied in order to reduce classification errors caused by the similarities in spectral responses of certain classes, such as bare crop fields and urban or some crop fields and woodlands. In addition, the problem of mixed pixels (e.g. buildings, roads, trees, water) was addressed by using a normalized spectral model analysis method (Wu Citation2004) since mixed pixels are a common problem when using medium spatial resolution data such as Landsat (Lu and Weng Citation2005). As many isolated pixels occurred during the classification process, a 3×3 majority filter was applied to each classification to reduce the salt-and-pepper effect (Lillesand and Kiefer Citation1999).
3.4. Classification accuracy assessment
In order to assess the accuracy of land cover maps extracted from the images, an independent sample was selected from each of the three reference data to assess the classification accuracies, respectively. Confusion matrices as cross-tabulations of the mapped class versus the reference class were used to assess classification accuracy (Congalton and Green Citation1999). The overall accuracy, user's and producer's accuracies, and the non-parametric Kappa coefficients were then derived from the confusion matrices to assess the classification accuracies.
3.5. Change detection
A multi-date, post-classification change detection method was used in this study to determine changes in land cover in three intervals, i.e. 1989–1999, 1999–2009, and 1989–2009. Perhaps, this is the most common approach to change detection (Jensen Citation2004) and has been successfully used by a number of researchers of the urban environment (Hardin et al. Citation2007). Pixel-by-pixel cross tabulation analysis facilitated the determination of the quantity of conversions from a particular land cover class to other land cover categories, and their corresponding area over the period evaluated. A change detection map of ‘from–to’ change information was derived for each of the three five-class maps.
3.6. Change detection accuracy assessment
The change detection accuracy assessment is a unique problem since it is difficult to sample areas that will change in the future before they change (Congalton and Green Citation1999). The simplest method of accuracy assessment of change maps is to multiply the individual classification map accuracies to estimate the expected accuracy of the change map. A more rigorous approach is to randomly sample areas classified as change and no-change and determine whether they were correctly classified (Fuller et al. Citation2003). In this study, we took both the methods to evaluate the change maps for the 1989–2009 intervals. The simple method was used for comparing the change detection accuracy of the three classification methods, and the rigorous one was used to refine the classification results. The sample size of the change and no-change method was determined using the standard formula, as follows.
Where Z=Z value (e.g. 1.96 for 95% confidence level), P=expected accuracy, and E=allowable error. For 50% accuracy, 95% confidence level, and 5% margin of error, N=384, which means a sample of at least 384 pixels should randomly be selected from each class. All sample points were compared to the reference data to determine whether the classification change had actually occurred.
4. Results
4.1. Classification and change detection accuracy
Confusion matrices were used to assess classification accuracies and are summarized for all three years in by using MLc, ANNc, and SVMc as the classification methods. The overall accuracies of the three classification methods for 1989, 1999, and 2009 ranged from 88.14% to 94.85%, with Kappa coefficients from 84.49% to 92.99%; user's and producer's accuracies of individual classes were consistently high, ranging from 70.00% to 100% with the assistance of bi-temporal image and post-classification processing.
Table 3. Summary of classification accuracies for 1989, 1999, and 2009.
Multiplying the individual classification accuracies from gives expected overall change detection accuracies of 78.40% (MLc), 80.11% (ANNc), and 86.02% (SVMc) for the first 10-year interval, 1989–1999; 81.71% (MLc), 83.97% (ANNc), and 89.23% (SVMc) for the interval of 1999–2009; and 81.00% (MLc), 84.41% (ANNc), and 86.72% (SVMc) for the entire period, 1989–2009. All three classification methods had satisfactory performances while SVMc performed best in terms of overall accuracy and Kappa coefficients for all the three years; hence, the land cover maps classified by SVMc would be useful for change pattern analysis.
The change detection accuracy was also evaluated by the method described in Section 3.6. A total of 777 random samples classified as no-change or change using SVMc between 1989 and 2009 were evaluated and a change detection confusion matrix was derived (). The overall accuracy of change detection was 83.78%, with the Kappa coefficient of 80.13%. Of the 16.22% error in change detection, 12.75% were commission errors and 3.47% were omission errors.
Table 4. Change detection error matrix for 1989–2009.
4.2. Classification and change map statistics
Classification maps were generated for all three years (), and the individual class area and change statistics for the three years are summarized in .
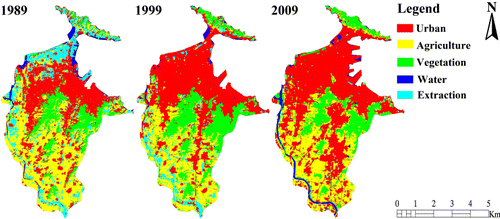
Table 5. Summary of land cover area statistics in 1989, 1999, and 2009.
From 1989 to 2009, urban area increased approximately 35.83 km2 (20.08% of the total area) while agricultural land decreased 12.82 km2 (7.19%). Water increased by 2.43 km2 (1.36%), forest increased 6.39 km2 (3.58%), and extraction decreased 27.53 km2 (15.43%). Relatively, urban and developed areas constantly increased 63.94% from 1989 to 2009. A rapid increase of urban and developed areas occurred from 1989 to 1999, while both agricultural land and water decreased in the first 10-year interval (1989–1999) and increased a little in the second 10-year interval (1999–2009). The area of forest increased by almost a half (13 km2) from 1989 to 1999 and decreased approximate 7 km2 for the 1999–2009 intervals.
To further evaluate the results of land cover conversions, matrices of land cover changes from 1989 to 1999, 1999 to 2009, and 1989 to 2009 were created and are shown in . Unchanged pixels in this table are located along the major diagonal of the matrix and conversion values were calculated by area.
Table 6. Matrices of land cover and change statistics (km2) from 1989 to 2009.
shows the dynamic change information of land cover between 1989 and 2009 in Yantai. Among the 47.91 km2 of total growth in urban land cover from 1989 to 2009, 47.59% was converted from agriculture (22.80 km2), 32.48% from extraction (15.56 km2), 6.70% (3.21 km2) from water, and 5.11% (2.45 km2) from forest. The area shown in for 2009 (91.87 km2) differs from that in (87.57 km2). Comparing the remotely sensed images of the three years (), the profile of Yantai remained almost the same from 1989 to 1999, while the image in 2009 is slightly different in the north-central coastal region, which is the location of the newly built Yantai Port and its related industries reclaimed from the Bohai Sea. Due to the specific analytical algorithm, the conversion matrices of land cover and change statistics omitted the newly developed area in order to maintain a consistent total area.
shows that 2.45 km2 of forest were converted to urban land between 1986 and 2002. At the same time, 3.62 km2 of urban land were converted to forest. It is possible for these changes to be classification errors, but forest areas are among the most sought after areas for developing new residential areas (Yuan et al. Citation2005). In addition, roads and streets were generally classified as urban, but the trees along the streets will grow and expand, and the mixed pixels will probably be classified as forest. We noted that most of the changes from urban to forest occurred along roads and streets. Furthermore, classification errors also cause other unusual changes. From , we can also note that 7.40 km2 of urban changed to agriculture and 1.33 km2 of urban land changed to water between 1989 and 2009. These changes are most likely to be omission and commission errors.
4.3. Analysis of urban change patterns
Although classification change statistics could be generated by other means such as census tract, they shed little light on where the land use changes are occurring. However, by constructing a change detection map (), the advantages of remote sensing can be fully appreciated. shows a map of the major land cover types and the conversion from non-urban to urban areas. Agriculture, urban, and forest are the three major land cover types in Yantai, representing 95% of the total area. Conversions involving these three classes also represent the most significant changes.
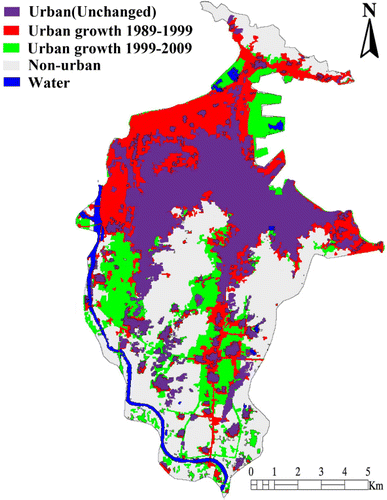
illustrates that the unchanged urban area in purple is mainly located in the center of Yantai city, covering 30% of the total area (). The majority of urban changes occurred from 1989 to 1999, as is highlighted in red. In this period, the newly expanded urban areas covered approximately 20 km2. They were mostly concentrated in the newly established residential and related commercial service areas in the northwest part of the unchanged urban area, namely Xingfu subdistrict, which consists of 17 communities. In the south of the unchanged urban area, due to the construction of tunnels between hills, urban expansion could extend further. For the interval from 1999 to 2009, the urban areas mainly expanded in northerly and southerly directions, which are highlighted in green. The northern part is the newly built port region reclaimed from the Yellow Sea. The southern part was explored for new residential areas to satisfy citizens' demands for housing, an inelastic demand phenomenon directly resulting in the explosive growth of Yantai's real estate industry.
4.4. Analysis of urban sprawl driving factors
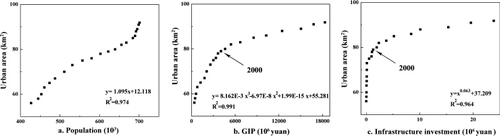
In most cases, urban sprawl and associated land cover changes are affected and driven by a combination of socioeconomical factors, such as population growth, policy, and economic development. Even though it is difficult to quantify and clarify the influences of these factors in land cover changes, their influences were examined by analyzing the relationships between the growth of urban area and socioeconomical and policy factors, such as population, gross industrial products (GIP), and infrastructure investment. The 20-year data of urban area, population, GIP, and infrastructure investment were obtained from YBS since data derived from remotely sensed images only cover three years.
shows the relationships between urban sprawl and the four driving factors over the years from 1989 to 2009. The increase in urban area correlates with the growth of population in linear forms, as shown in . However, the relationships of increased urban area and GIP () and investment in infrastructure () show a more complex relationship with urban sprawl. The year 2000 appears to be a turning point in the course of urban development. Before the year 2000, or during the 1989–1999 interval, both the growth of GIP and investment in infrastructure were slow, but the increase in urban area was relatively rapid; however, the opposite situation occurred after 2000, namely, the GIP and infrastructure investment grew rapidly, but the increase of urban area became relatively slow. This fact may imply a conclusion that the urban sprawl before 2000 was relatively extensive for arable or bare land and was just simply urbanized in terms of the residential establishments (Xingfu sub-district). However, the urban sprawl after 2000 contains much more intensive components, such as the establishment of the new port region and improvement of infrastructure and the city's functionality (e.g. construction of tunnels between hills), which is consistent with the previous discussion in Section 4.3.
Once the land cover classifications have been performed, they can be used as initial inputs for developing additional information. For example, landscape metrics can be derived from the classifications to investigate changes in diversity and fragmentation of the landscape in Yantai. In addition, the classifications could also be used as inputs for an environmental impact analysis and in a land cover transformation model to project future land cover change. In summary, information derived from remotely sensed images plays a significant role in quantifying and understanding the nature of land cover changes on Earth and in identifying where they are occurring, and could be of great significance to the understanding of DE.
5. Conclusions and discussions
This study has assessed the land cover changes and dynamics of urban sprawl in the city of Yantai, China, using remotely sensed images in conjunction with remote sensing classification techniques and change analysis methods. Urban sprawl was quantified for the last three decades using the ‘from–to’ post-classification comparison technique. It was found that Yantai city has experienced rapid changes in land cover during the research period, particularly in urban areas. Analysis revealed urban areas increased by 21.55 km2 during 1989–1999 and 14.28 km2 from 1999 to 2009, which resulted in a substantial reduction in the area of agricultural land, extraction, and forest. The dramatic expansion of the urban area of Yantai exhibited clear spatio-temporal characteristics. From 1989 to 1999, the newly urbanized region was mainly located in the northwestern residential areas; and for the interval of 1999–2009, new urban areas were concentrated in the residential areas in the south as well as the reclaimed harbor region. Analysis of the relationships between the growth of urban area and population, GIP, and investment in infrastructure in terms of statistical data obtained from YBS found that the year 2000 appeared to be a turning point in the course of urban development (converting from extensive to inextensive), which is consistent with the analysis of urban change patterns using remote sensing methods. The results confirm the potential of multi-temporal Landsat images to provide accurate and efficient means to map and analyze spatio-temporal changes of land cover types. Compared with the conventional census method, information derived from remotely sensed imagery could help quantify and understand the nature of land cover changes and find where they are occurring. As reliable and current data are lacking for Yantai and other mid-sized coastal cities, the processes of classification and change detection shown in this study can be useful, and the land cover maps produced in this study will contribute to the development of sustainable urban planning management and establishment of DE database.
Acknowledgements
This study was supported by the Knowledge Innovation Program of the Chinese Academy of Sciences (No. kzcx2-yw-224), the National Natural Science Foundation of China (No. 40801016), and the Natural Science Foundation of Shandong Province (No. ZR2009EM005).
Related Research Data
References
- Alphan, H., 2003. Land use change and urbanization in Adana, Turkey. Land Degradation and Development, 14 (6), 575–586.
- Carlson, T.N. and Arthur, T.S., 2000. The impact of land use-land cover changes due to urbanization on surface microclimate and hydrology: a satellite perspective. Global Planetary Change, 25, 49–65.
- Congalton, R.G. and Green, K., 1999. Assessing the accuracy of remotely sensed data: principles and practices. Boca Rotan, FL: Lewis, 43–64.
- Coppin, P., et al., 2004. Digital change detection methods in ecosystem monitoring: a review. International Journal of Remote Sensing, 25 (9), 1565–1596.
- Dai, X. and Khorram, S., 1997. Development of a new automated land cover change detection system from remotely sensed imagery based on artificial neural networks. Geoscience and Remote Sensing, 2, 1029–1031.
- Dong, Y., Forster, B., and Ticehurst, C., 1997. Radar backscatter analysis for urban environments. International Journal of Remote Sensing, 18 (6), 1351–1364.
- Elmes, G.A., Weiner, D., and D'Alessandro-Scarpari, C., 2009. Digital earth. In: R. Kitchin, & N. Thrift, eds. International Encyclopedia of Human Geography. Oxford: Elsevier Press, 198–204.
- Elvidge, C.D, Sutton, P.C., and Wagner, T.W., 2004. Land change science: observing, monitoring, and understanding trajectories of change on the earth's surface. Dordrecht, Netherlands: Kluwer Academic, 315–328.
- Foody, G.M., McCulloch, M.B., and Yates, W.B., 1995. Classification of remotely sensed data by an artificial neural network: issues related to training data characteristics. Photogrammetric Engineering and Remote Sensing, 4 (61), 391–401.
- Foody, G.M., and Mathur, A., 2004. A relative evaluation of multiclass image classification by support vector machines. IEEE Transactions on Geoscience and Remote Sensing, 2 (6), 1335–1343.
- Fuller, R.M., Smith, G.M. and Devereux, B.J., 2003. The characterization and measurement of land cover change through remote sensing: problems in operational applications. International Journal of Applied Earth Observation and Geoinformation, 4, 243–253.
- Guo, H., Fan, X., and Wang, C., 2009. A Digital Earth Prototype System: DEPS/CAS. International Journal of Digital Earth, 2 (1), 3–15.
- Hanson, M.C., Dubayah, R., and Ruth, D., 1996. Classification tree: an alternative to traditional land cover classifiers. International Journal of Remote Sensing, 17, 1075–1081.
- Hardin, P.J., Jackson, M.W., and Otterstrom, S.M., 2007. Mapping, measuring, and modeling urban growth, Geo-spatial technologies in urban environments: policy, practice and pixels. Heidelberg: Springer-Verlag, 141–176.
- He, C.Y., et al., 2011. Simulation of the spatial stress due to urban expansion on the wetlands in Beijing, China using a GIS-based assessment model. Landscape and Urban Planning, In Press. Available from: http://personal.georgiasouthern.edu/~jtian/Landscape_UrbanPlanning.pdf
- Herold, M., Goldstein, N.C., and Clarke, K.C., 2003. The spatiotemporal form of urban growth: measurement, analysis and modeling. Remote Sensing of Environment, 86, 286–302.
- Jat, M.K., Garg, P.K., and Khare, D., 2008. Modeling urban growth using spatial analysis techniques: a case study of Ajmer city (India). International Journal of Remote Sensing, 29 (2), 543–567.
- Jensen, J.R., 2004. Digital change detection. Introductory digital image processing: a remote sensing perspective. New Jersey' Prentice-Hall, 467–494.
- Jensen, J.R., 2005. Thematic information extraction: pattern recognition. A remote sensing perspective. In: Keith C. Clarke, ed., Vpper Saddle River: Prentice-Hall, 3rd ed., 337–406.
- Jensen, J.R., et al., 2004. Geospatial technologies in urban environments: policy, practice and pixels. Heidelberg: Springer, 5–20.
- Jensen, J.R. and Im, J., 2007. Remote sensing change detection in urban environments. In: J.R. Jensen, J.D. Gatrell, and D. McLean, eds. Geo-spatial technologies in urban environments: policy, practice and pixels. Heidelberg: Springer-Verlag, 141–176.
- Kato, S. and Yamaguchi, Y., 2005. Analysis of urban heat-island effect using ASTER and ETM+data: separation of anthropogenic heat discharge and natural heat radiation from sensible heat flux. Remote Sensing of Environment, 99 (1–2), 44–54.
- Li, X., Zhang, L., and Liang, C., 2010. A GIS-based buffer gradient analysis on spatiotemporal dynamics of urban expansion in Shanghai and its major satellite cities. Procedia Environmental Sciences, 2, 1139–1156.
- Lillesand, T.M. and Kiefer, R.W., 1999. Remote sensing and image interpretation. New York, NY: John Wiley and Sons.
- Liu, J., et al., 2002. Land-cover classification of China: integrated analysis of AVHRR imagery and geophysical data. International Journal of Remote Sensing, 24, 2485–2500.
- Lu, Q. and Weng, D., 2005. Urban classification using full spectral information of Landsat ETM+ imagery in Marion County, Indiana. Photogrammetric Engineering & Remote Sensing, 71 (11), 1275–1284.
- Lunetta, R.S. and Balogh, M., 1999. Application of multi-temporal Landsat 5 TM imagery for wetland identification. Photogrammetric Engineering and Remote Sensing, 65, 1303–1310.
- Nemmourit, H. and Chibani, Y., 2005. Neural network combination by fuzzy integral for robust change detection in remotely sensed imagery. EURASIP Journal on Applied Signal Processing, 14, 2187–2195.
- Nemmourit, H. and Chibani, Y., 2006. Multiple support vector machines for land cover change detection: an application for mapping urban extensions. ISPRS Journal of Photogrammetry and Remote Sensing, 61 (2), 125–133.
- Oettera, D.R., et al., 2000. Land cover mapping in an agricultural setting using multiseasonal Thematic Mapper data. Remote Sensing of Environment, 76, 139–155.
- Ridd, M.K. and Liu, J., 1998. A comparison of four algorithms for change detection in an urban environment. Remote Sensing of Environment, 63, 95–100.
- Shi, P., Chen, J., and Pan, Y., 2000. Land use change mechanism in Shenzhen city. Acta Geographica Sinica, 55, 151–160 ( in Chinese with English abstract).
- Squires, G.D., 2002. Urban sprawl and the uneven development of Metropolitan America, Urban sprawl: Causes, consequences, and policy responses. Washington, DC: Urban Institute Press, 1–22.
- Sui, D.Z. and Zeng, H., 2001. Modeling the dynamics of landscape structure in Asia's emerging desakota regions: a case study in Shenzhen. Landscape and Urban Planning, 53, 37–52.
- Vapnik, V., 1995. The Nature of Statistical Learning Theory (p 188). New York, NY: Springer-Verlag.
- Weng, Q.H., 2001. A remote sensing-GIS evaluation of urban expansion and its impact on surface temperature in the Zhujiang Delta, China. International Journal of Remote Sensing, 22 (10), 1999–2014.
- Weng, Q.H., 2002. Land use change analysis in the Zhujiang Delta of China using satellite remote sensing, GIS and stochastic modeling. Journal of Environmental Management, 64, 273–284.
- Wu, C.S., 2004. Normalized spectral mixture analysis for monitoring urban composition using ETM+ imagery. Remote sensing of environment, 93, 480–492.
- Yuan, F., 2008. Land-cover change and environmental impact analysis in the Greater Mankato area of Minnesota using remote sensing and GIS modeling. International Journal of Remote Sensing, 29 (4), 1169–1184.
- Yuan, F., et al., 2005. Multi-level land cover mapping of the Twin Cities (Minnesota) metropolitan area with multi-seasonal Landsat TM/ETM+data. Geocarto International, 20 (2), 5–14.
- Zhao, P., 2010. Sustainable urban expansion and transportation in a growing megacity: consequences of urban sprawl for mobility on the urban fringe of Beijing. Habitat International, 34, 236–243.