Abstract
Accurate impervious surface estimation (ISE) is challenging due to the diversity of land covers and the vegetation phenology and climate. This study investigates the variation of impervious surfaces estimated from different seasons of satellite images and the seasonal sensitivity of different methods. Four Landsat ETM+images of four different seasons and two popular methods (i.e. artificial neural network (ANN) and support vector machine (SVM)) are employed to estimate the impervious surface on the pixel level. Results indicate that winter (dry season) is the best season to estimate impervious surface even though plants are not in their growing season. Less cloud and less variable source areas (VSA) (seasonal water body) become the major advantages of winter for the ISE, as cloud is easily confused with bright impervious surfaces, and water in VSA is confused with dark impervious surfaces due to their similar spectral reflectance. For the seasonal sensitivity of methods, ANN appears more stable as its accuracy varied less than that obtained with SVM. However, both the methods showed a general consistency of the seasonal changes of the accuracy, indicating that winter time is the best season for impervious surfaces estimation with optical satellite images in subtropical monsoon regions.
1. Introduction
With the fast urbanization process, built-up areas are often with impervious surfaces, including pavements and rooftops. Urban impervious surfaces are important to urban environment and socioeconomic studies (Weng Citation2001; Yu and Wu Citation2004; Wu and Yuan Citation2007). Thus, impervious surface estimation (ISE) has become important and remote-sensing technique is identified as the most popular one due to its low cost and efficiency (Hu and Weng Citation2011). Various data sources have been employed for mapping impervious surfaces, including optical, SAR, and LiDAR data (Wu and Murray Citation2003; Jiang et al. Citation2009; Weng Citation2012; Zhang, Zhang, and Lin Citation2012). Moreover, numerous methods have been applied to estimate the impervious surfaces. Subpixel approaches (e.g. spectral mixture analysis, normalized spectral mixture analysis, regression tree model, and artificial neural networks (ANNs)) and per-pixel approaches (e.g. conventional classification approaches) are employed to extract the impervious surfaces (Wu and Murray Citation2003; Yang et al. Citation2003; Wu Citation2004; Weng and Hu Citation2008; Hu and Weng Citation2011; Weng Citation2012).
However, accurate estimation of impervious surfaces remains challenging due to several issues (e.g. spectral confusions between impervious surfaces and nonimpervious surfaces). One of these important issues is the seasonal effects of impervious surfaces estimation, which has attracted attentions of some scholars (Wu and Yuan Citation2007; Weng, Hu, and Liu Citation2009). Impervious surfaces were reported to be overestimated in winter time, when tree canopies are at their minimum (Weng, Hu, and Liu Citation2009). Moreover, different extraction methods of the impervious surface extent are sensitive to this seasonal change in different ways. For instance, linear spectral mixture analysis turns out to be more sensitive to seasons, while regression tree model is less sensitive to this change (Wu and Yuan Citation2007). Nevertheless, the works done by Wu and Yuan (Citation2007) and Weng, Hu, and Liu (Citation2009) were conducted at the mid-latitude region where the plant phenology undergoes dramatically in different seasons. On the contrary, subtropical monsoon areas enjoy a significantly different condition to their study sites. Thus, the seasonal effects observed before are still not clear about whether they suit the situation in subtropical monsoon areas like Pearl River Delta (PRD). This study aims to address this question and assess the seasonal effects of the ISE in the PRD region.
This study aims to prove/reject two hypotheses. First, seasonal changes of the landscape components should be less problematic in subtropical monsoon areas since vegetation and canopy change less among the seasons, while water may have an impact, as there are many variable source areas (VSA). VSA are those areas filled with water in rainy seasons, and bare soil is exposed in dry seasons (Frankenberger et al. Citation1999). Secondly, the sensitivity of the impervious surface extent extraction may depend on different methods. In this paper, the per-pixel approach is adopted and two popular classifiers are selected, including ANN and the support vector machine (SVM).
2. Study area and data-sets
2.1. Study sites
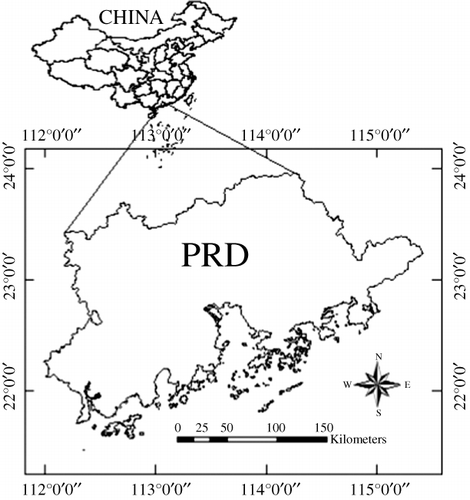
The PRD () in Southern China was chosen as the study area. The region is located on the downstream of the Pearl River, known as the third largest metropolitan in China, and enjoying a tremendously fast development during the past 30 years. The region has gained a rapid urbanization, with a population of over 19 millions and an area of over 21,000 km2 (Fan, Wang, and Wang Citation2008). However, with the strong interactions between human activities and the natural environment, environmental issues also emerge seriously and cause a series of environmental problems, including air and water pollutions (Zhang et al. Citation2008). Nevertheless, unlike many other metropolitans in the world, the PRD is located in a subtropical monsoon area, with a long period of cloudy weather throughout the year and different characteristics of plant phenology (Fan, Wang, and Wang Citation2008). In the PRD, about 80% of precipitation occurs during April–September, which is known as the wet season, while only about 20% of rain water comes from October to next March, which is known as the dry season (Cai et al. Citation2004). Therefore, the seasonal effects of the ISE from remote-sensing imagery are likely to be different from previous studies, which were mainly conducted in mid-latitude regions.
2.2. Satellite data
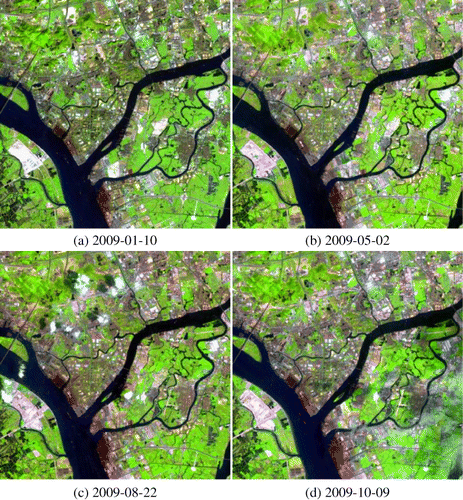
In the subtropical monsoon region, it is very difficult to choose an image without any cloud, even during the dry seasons (Fan, Wang, and Wang Citation2008). The images selected for this study are accompanied with small parts of clouds (less than 6%), which are difficult to be removed by image-processing algorithms as these clouds are very small and thin (Hagolle et al. Citation2010). To investigate the seasonal effects of the ISE from satellite images, four scenes of Landsat ETM +images were chosen for four different seasons in this study (). The ETM+images had one panchromatic band and six bands with the image pixel size of 30 m * 30 m. In this study, only the 30-m data were used. To preprocess the ETM+images, as there are stripes on the eastern and western edges of each scene because of the footprints (location and spatial extent) of each band due to the scan line corrector failure, a process should be applied to get rid of these stripes. For this reason, the study area is located on the middle of each scene where there are no stripes, and thus no stripe removal operation should be applied. Moreover, Landsat calibration was also applied using published post-launch gains and offsets (Chander, Markham, and Helder Citation2009). The calibration was done using the software Calibration Utilities module of ENVI 4.7. We assume that the atmospheric condition is clear and homogeneous and the small parts of clouds would not significantly impact the whole scene of image, and thus no atmospheric correction was performed (Wu and Murray Citation2003).
3. Methods
3.1. ISE with ANN
An ANN consists of a set of nodes which are organized in different layers and are connected to each other. Each node is sometimes called a neuron by analogy to biological data processing from which the term neural network derives (Richards and Jia Citation2006). One of the most widely used ANN is the multi-layer perceptron (MLP) feed-forward network (Kavzoglu and Mather Citation2003), which is structured with three types of layers, input, hidden, and output layers. For the application in satellite imagery, the input layer corresponds to the bands of multispectral images, and the output layer represents different kinds of land use, land cover, or various material classes (Weng and Hu Citation2008). Different procedures for classification are conducted within the hidden layer(s). The performance and effectiveness of MLP depend on the number of hidden layers, the number of nodes in each hidden layer, and the learning algorithm.
A single hidden layer should be sufficient for classification tasks (Lippman Citation1987; Cybenko Citation1989; Garson Citation1998), especially for most multispectral satellite images as several spectral bands are ordinary only. The second key factor is the number of nodes. Actually, a lot of research has been conducted to determine the number of nodes for each hidden layer, but they are seldom widely accepted (Richards and Jia Citation2006). One approach taking into account both the number of input nodes and output nodes seems to be more suitable for remote-sensing classification (Eastman Citation2003; Weng and Hu Citation2008). In this paper, the method used by Weng and Hu (Citation2008) is adopted to determine the number of nodes in each layer. After the structure of MLP is fixed, a learning algorithm should be designed and related parameters should be set. Therefore, the backpropagating learning algorithm, a widely used approach (Richards and Jia Citation2006), is employed in this study. To obtain the best effectiveness of MLP to extract the impervious surfaces from ETM+imagery, different parameters should be optimized (Zhang, Zhang, and Lin Citation2012), including the learning rate, the momentum factor, and the number of training iterations. In this study, according to our previous work (Zhang, Zhang, and Lin Citation2012), the learning rate is 0.2, the momentum is 0.9, and the number of iterations is 1000. This configuration is applied to the images of four seasons.
3.2. ISE with SVM
SVM, using the structural risk minimization principle (Vapnik Citation1995), is different from the empirical risk minimization-based methods such as ANN. The basic idea of SVM is to linearly classify data in a high-dimensional space, where there is a hyperplane that can be used to linearly separate the original data, meanwhile maximizing the margin between different classes (Vapnik Citation1998). For nonlinear cases, a kernel function should be used to map the original data to a higher-dimensional space where the data can be linearly separated. Commonly used kernel functions include polynomial function, radial basis function (RBF), and sigmoid function. The theory of SVM has been extensively described and discussed in the literature (Vapnik Citation1998; Weston and Watkins Citation1999; Hsu, Chang, and Lin Citation2007). In this paper, the SVM described by Hsu, Chang, and Lin (Citation2007) is employed, and the RBF is selected as the kernel function. For a multi-class task as in this study case, a multi-class version of the SVM is needed, and the one-against-rest method, which is widely used (Weston and Watkins Citation1999). The basic idea of the one-against-rest approach is to use multiple binary SVMs, each mapping a certain class as one class against the rest classes as the other. Then, we can get one hyperplane from each binary SVM, and all classes can be separated in the hyperspace by combining all these hyperplanes. The success of the SVM was recognized to depend on the parameter of the penalty and the Gamma in the kernel function. In this study, RBF is employed as the kernel function, and a cross-validation procedure is employed to find out the best value of the penalty and the Gamma in RBF. Finally, the Gamma is fixed as 0.1 and the penalty is 100.
3.3. Classification strategy
Seven land-use types are defined to conduct the classification procedure according to the landscape of the study area. gives a brief description about each land cover type, including water, vegetation, bare soil, clouds, shades, dark impervious surfaces, and bright impervious surfaces. In particular, clouds and shades are treated as one type of land cover, since they have unique spectral and spatial characteristics compared with other types of land cover. As the region is undergoing dramatic urbanization process, a lot of bare soils appear on the areas under construction. Besides, numerous cool roofing materials are used to build up the building rooftops, which turn out to be light blue or white color. These rooftops are designed to highly reflect the solar radiation so as to reduce the urban heat island effect. Thus, they appear to be bright impervious surfaces in the optical remote-sensing data. Then, the ANN and the SVM are applied to classify the four seasons of ETM+images. After seven land-use classes are available, a combining operation is employed to reclassify the five land use types into two types, the impervious surfaces and nonimpervious surfaces. During this period, the water body, vegetation cover, and bare soils are combined together to form the nonimpervious surfaces, while the dark and bright impervious surfaces are combined to be the impervious surface class.
Table 1. Definition of the land covers used in this study.
3.4. Sampling strategy and accuracy assessment
To obtain training and test samples, a visual interpretation procedure is used by visually comparing the four seasons of ETM+images (Year 2009) and the very high-resolution images in the Google Earth (Imagery date: 30 December 2008). However, terrains may appear differently in different seasons due to the seasonal changes of the plants, weather, and solar radiation, while the actual area and distribution of the impervious surfaces should be relatively stable, as all the images are selected in the same year. In this study, we assume that the actual area and distribution of impervious surfaces stay the same during the year of 2009. Therefore, different training sample sets are designed to different seasons of images, while only the same testing data-set is sampled for the accuracy assessment of all the four seasonal images. Generally, the samples include two main types, the impervious surfaces and nonimpervious surfaces. First, to sample the training data for the impervious surfaces, bright impervious surfaces and dark impervious surfaces are sampled separately. Secondly, five types of land cover are sampled for nonimpervious surfaces, the water body, vegetation, bare soils, shades, and clouds. If there are no clouds in the image, i.e. the winter image in this case, then there is no training data for this type. After the classification procedure, a post-classification is applied to combine all the land-cover types into the impervious surfaces and nonimpervious surfaces accordingly. For the testing data, both samples for the impervious surfaces and nonimpervious surfaces are obtained normally from each subtype of land cover. Finally, the total precision and Kappa coefficient based on the confusion matrix are employed to assess the accuracy of the ISA estimation (Jensen Citation2007).
4. Results and discussions
4.1. Seasonal effects of impervious surface estimation
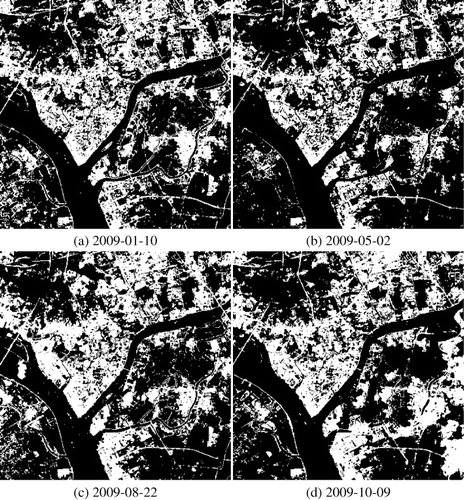
shows the estimate of impervious surfaces with ANN, and gives the accuracy assessment result of the extracted impervious surfaces using the ANN method, which shows a clearer illustration of the patterns. Different from the previously reported research in the mid-latitude region (Wu and Yuan Citation2007; Weng, Hu, and Liu Citation2009), it is impressive that the winter imagery (January 10) obtained the best accuracy, with an overall accuracy of 91.4367% and a Kappa coefficient 0.8287. In spring, the accuracy is also good enough (Overall accuracy: 88.2519%; Kappa coefficient: 0.7651). The lowest accuracy happens in the autumn period (October 9), only with an overall accuracy 83.2979% and Kappa coefficient 0.6615. The summer time (August 22), which was reported to be the best season for the ISE, only has 84.5011% of overall accuracy and the Kappa coefficient 0.6873. Other accuracy indices also have the similar patterns, except for the producer accuracy of impervious surfaces and the user accuracy of nonimpervious surfaces. However, these two indices change only a little, where the values are over 85% for all seasons.
Table 2. Accuracy assessment of the classification results by ANN.
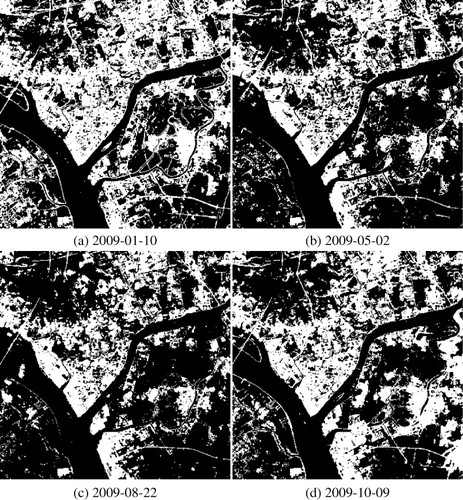
reveals the results with SVM and compares the accuracy assessment of the impervious surfaces estimated from the SVM approach. The highest accuracy occurs in the winter time, where the overall accuracy is 92.0028% and the Kappa coefficient is 0.8394. Both the spring and autumn generate low accuracy in this experiment, with the overall accuracy only about 83%, and Kappa coefficient of about 0.66. The summer image produces a little higher accuracy than the spring and autumn, but the accuracy is still much lower than that of the winter time. For the producer accuracy of impervious surfaces and user accuracy of nonimpervious surfaces, the values does not change too much, both of which are over 80%.
Table 3. Accuracy assessment of the classification results by SVM.
4.2. Analyzing the seasonal changes of typical targets
Plant phenology was considered to be the cause of the seasonal changes of the impervious surfaces estimation, and impervious surfaces estimated in leaf-on seasons are more accurate than that estimated in leaf-off seasons (Wu and Yuan Citation2007; Weng, Hu, and Liu Citation2009; Weng Citation2012). In summer when plant leaves are all on the trees, most part of the bare soils are overlaid by trees, grass, and crops. Hence, the confusion between bare soils and bright impervious surfaces is reduced greatly, and thus the estimated impervious surfaces are more accurate. However, the case in a subtropical monsoon region turns out to be much more complicated. Firstly, the seasonal plant changes are much less in subtropical monsoon areas, where most of the plants are evergreen throughout the whole year. So, there is no boundary between the so-called leaf-on and leaf-off seasons. Secondly, water body becomes seasonally changeable in humid areas. In rainy seasons, rain water fills many areas of different sizes, which will be dry in dry seasons. These areas have been identified as the VSA by hydrological scientist (Frankenberger et al. Citation1999). Moreover, the water level in lakes and rivers in dry seasons will be much lower than that in rainy seasons. Thus, theoretically, in dry seasons, more bare soils are exposed to be confused with bright impervious surfaces. Thirdly, clouds coverage is another important factor. Even in dry seasons, small pieces of cloud appear from time to time. Thus, optical satellite images that are cloud-free are almost not available throughout the year. These clouds become the confused targets with bright impervious surfaces.
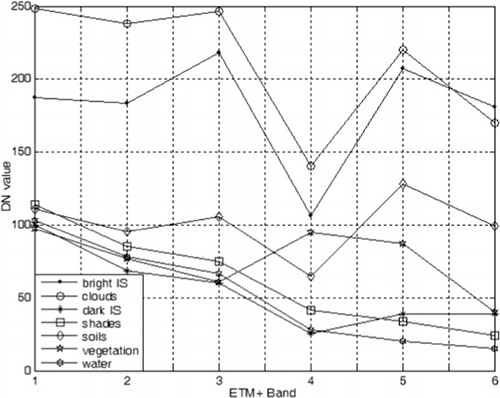
To investigate the seasonal effects of impervious surfaces, about 60 pixels of each typical land cover types are carefully selected and their average spectral characteristics are shown in , giving a typical situation of spectral reflectance in a subtropical monsoon urban city. It is impressive that there are two groups of spectral confusion. One group includes the clouds and bright impervious surfaces. Both of these targets have high reflectance in the six bands. The other group has water body, shades, and dark impervious surfaces. The patterns of these three targets are very similar with low reflectance in the six spectral bands. This is quite an important factor to the ISE, as water body increases in rainy season with more VSA. As a result, the confusion between water and dark impervious surfaces increases in rainy seasons. Another impressive finding is that the average reflectance characteristics of bare soils seem to be much lower than those in the previous reports (Wu and Yuan Citation2007; Weng, Hu, and Liu Citation2009). Actually, this is not surprising, since bare soils in a humid area are almost wet soil because of the humid climate. Therefore, it is much easier to discriminate the bare soil from either bright or dark impervious surfaces.
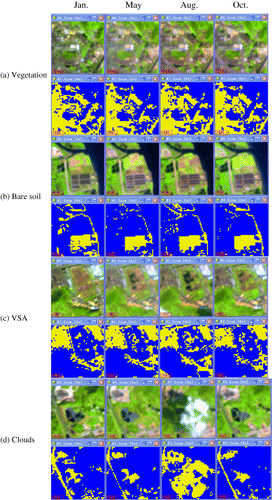
To illustrate the above discussed characteristics of the seasonal changes of typical targets in the subtropical monsoon region, four locations in the study case of this paper are selected, representing different types of terrains. Images of the four dates of the four blocks, together with the related estimated impervious surfaces using ANN method, are correspondingly shown in . (a) shows that the vegetated area keeps relatively stable in different seasons and vegetated areas have little impacts on the estimated impervious surfaces. (b) reveals that even though the bare soils have some changes in different seasons, they can be easily recognized as nonimpervious surfaces. However, water bodies are mistakenly classified as dark impervious surfaces. (c) demonstrates the similar case in (b), where the water bodies in VSA in May and August are wrongly treated as dark impervious surfaces. (d) demonstrates the confusion between clouds and bright impervious surfaces, as well as the confusion between shades and dark impervious surfaces. Clouds and related shades in August are misclassified as impervious surfaces.
Generally, in the dry season, VSA areas are empty of water and clouds are much less, and, therefore, less water is confused with dark impervious surfaces and fewer clouds are confused with bright impervious surfaces. Nevertheless, in rainy seasons, all VSA regions are filled with water, and much more clouds occur, resulting in a number of cloud shades. Particularly, in this study, as the autumn image was taken at the beginning of the dry season (October 9) when most water in VSA regions still remains, it is treated as the wet/rainy season. Thus, the spectral confusion between water/shades and dark impervious surfaces, and clouds and bright impervious surfaces, increases greatly. As a result, the dry season is more appropriate for the estimation of impervious surfaces in subtropical monsoon areas.
4.3. Comparing the seasonal sensitivity of methods
For per-pixel approaches, two categories of classification methods were mainly considered for estimating impervious surfaces, including parametric methods like the maximum likelihood classifiers, and the nonparametric methods like ANN, SVM, decision tree-based methods, and expert system (Weng Citation2012). For the use of parametric methods, a normal distribution of a dataset is often required, which is difficult to satisfy in urban areas because of the complexity of land use or land cover types (Weng Citation2012). Thus, only the nonparametric approaches are employed to compare the sensitivity of these methods to the seasonal effects. In this paper, two nonparametric methods (e.g. ANN and VSM) are selected for comparison. ANN represents the empirical-risk minimization method and SVM is the structural-risk minimization method. Both approaches are considered promising for the estimation of impervious surfaces (Weng Citation2012).
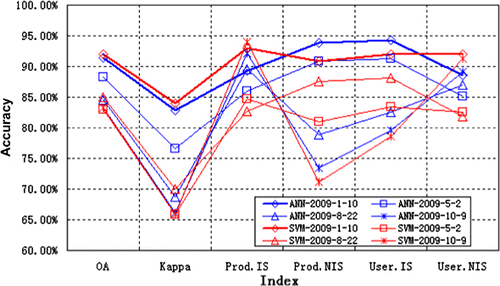
To compare the results using ANN and SVM, we plot the results of and shown in , indicating a general consistency through all the indices. For both methods, the best estimation appeared on 10 January 2009 (winter), while the lowest accuracy was on 9 October 2009 (autumn). The overall accuracy obtained in winter was about 8% higher than that in autumn, and the Kappa coefficient in winter was about 0.17 higher than that in autumn. The highest accuracy occurred to the SVM, while the lowest accuracy was also from the SVM. But there is only a slight difference. Thus, ANN is a little bit less sensitive to the seasonal changes.
5. Conclusions
Accurate ISE remains a challenging work due to the diversity of impervious surfaces, spectral confusions among various land covers, and the seasonal changes of vegetation and climate. Among the challenges, seasonal effect is one of the key issues that influence the accurate estimation of impervious surfaces. In this study, four scenes of Landsat ETM+images were carefully chosen for four different seasons in the same year, and two classification methods, the ANN and the SVM, were employed to extract the impervious surfaces from the images on the pixel level. The experimental results demonstrate quite a special view of seasonal effects in humid areas that is different from that in mid-latitude areas according to previous research (Wu and Yuan Citation2007; Weng, Hu, and Liu Citation2009). According to the results, in subtropical monsoon regions, winter is the best season to estimate impervious surfaces from satellite images. Winter is the dry season in subtropical monsoon regions. Thus, there are little clouds, and most of the VSA are not filled with water. Even though more bare soils in the VSA are exposed, they can be easily identified as most of these soils are actually not dry soils as in the mid-latitude areas. Therefore, satellite images are the most appropriate for estimating impervious surfaces. On the other hand, autumn images obtained the lowest accuracy of impervious surfaces due to the clouds coverage and the water in VSA. Autumn is a rainy season in a subtropical monsoon region, for which clouds occur very often and VSA areas are always filled with water. Consequently, clouds are confused with bright impervious surfaces due to their similarly high reflectance, and more water in VSA is confused with dark impervious surfaces due to their similarly low reflectance.
Moreover, the seasonal sensitivity of the two methods is compared. Both ANN and SVM methods show a general consistency of the seasonal changes of the accuracy. ANN seems a little bit stable as its accuracy changed less than that obtained using SVM. However, both the methods indicated that winter time is the best season for the ISE with satellite images in subtropical monsoon regions. Limitations of this study mainly come from the methodology which is generally based on per-pixel level. In urban and suburban areas, one pixel with a size of 30 × 30 meters does not necessarily include only impervious materials or nonimpervious materials (Wu and Murray Citation2003; Weng Citation2012). In this case, the use of per-pixel methods would obtain a result with lower accuracy. In our future work, more accurate assessment will be made on the subpixel level, in order to provide a clearer understanding of the seasonal effects of the climatology and phenology on the ISE.
Acknowledgements
The ETM+data from USGS are highly appreciated. This study is jointly supported by the CUHK Direct Grants (2021103), Hong Kong Research Grants Council (RGC) General Research Grants (GRF) project (CUHK 459210 and 457212), Hong Kong Innovation and Technology Fund (GHP/002/11GD), the funding of Shenzhen Municipal Science and Technology Innovation Council (JCYJ20120619151239947), and the National Key Technologies R&D Program in the 12th Five Year Plan of China (2012BAH32B03). The authors would like to thank three anonymous reviewers for their critical comments and suggestions to improve the original manuscript.
References
- Cai, W.-J., M. Dai, Y. Wang, W. Zhai, T. Huang, S. Chen, F. Zhang, Z. Chen, and Z. Wang. 2004. “The Biogeochemistry of Inorganic Carbon and Nutrients in the Pearl River Estuary and the Adjacent Northern South China Sea.” Continental Shelf Research 24 (12): 1301–1319. doi:10.1016/j.csr.2004.04.005.
- Chander, G., B. Markham, and D. Helder. 2009. “Summary of Current Radiometric Calibration Coefficients for Landsat MSS, TM, ETM+, and EO-1 ALI Sensors.” Remote Sensing of the Environment 113, 893–903. doi:10.1016/j.rse.2009.01.007.
- Cybenko, G. 1989. “Approximation by Superpositions of a Sigmoidal Function.” Mathematics of Control, Signals, and Systems 2 (4): 303–314. doi:10.1007/BF02551274.
- Eastman, J. R. 2003. IDRISI Kilimanjaro: Guide to GIS and Image Processing. Worcester, MA: Clark University Press (Manual Version 14).
- Fan, F., Y. Wang, and Z. Wang. 2008. “Temporal and Spatial Change Detecting (1998–2003) and Predicting of Land Use and Land Cover in Core Corridor of Pearl River Delta (China) by Using TM and ETM+images.” Environmental Monitoring and Assessment 137 (1–3): 127–147. doi:10.1007/s10661-007-9734-y.
- Frankenberger, J. R., E. S. Brooks, M. T. Walter, M. F. Walter, and T. S. Steenhuis. 1999. “A GIS-based Variable Source Area Hydrology Model.” Hydrological Processes 13 (6): 805–822. doi:10.1002/(SICI)1099-1085(19990430)13:6<805::AID-HYP754>3.0.CO;2-M.
- Garson, G. D. 1998. Neural Networks: An Introductory Guide for Social Scientists, London: Sage.
- Hagolle, O., M. Huc, D. V. Pascual, and G. Dedieu. 2010. “A Multi-temporal Method for Cloud Detection, Applied to FORMOSAT-2, VENμS, LANDSAT and SENTINEL-2 Images.” Remote Sensing of Environment 114, 1747–1755. doi:10.1016/j.rse.2010.03.002.
- Hsu, C., C. Chang, and C. Lin. 2007. A Practical Guide to Support Vector Classification. Taiwan: National Taiwan University. http://ntu.csie.org/~cjlin/papers/guide/guide.pdf
- Hu, X., and Q. Weng. 2011. “Impervious Surface Area Extraction from IKONOS Imagery Using an Object-based Fuzzy Method.” Geocarto International 26 (1): 3–20. doi:10.1080/10106049.2010.535616.
- Jensen, J. R. 2007. Introductory Digital Image Processing: A Remote Sensing Perspective. 3rd ed., 501–505. London: Pearson Education.
- Jiang, L., M. Liao, H. Lin, and L. Yang. 2009. “Synergistic Use of Optical and InSAR Data for Urban Impervious Surface Mapping: A Case Study in Hong Kong.” International Journal of Remote Sensing 30 (11): 2781–2796. doi:10.1080/01431160802555838.
- Kavzoglu, T., and P. M. Mather. 2003. “The Use of Backpropagating Artificial Neural Networks in Land Cover Classification.” International Journal of Remote Sensing 24 (23): 4907–4938. doi:10.1080/0143116031000114851.
- Lippmann, R. P. 1987. “An Introduction to Computing with Neural Nets.” IEEE ASSP Magazine April: 4–2210.1109/MASSP.1987.1165576.
- Richards, J. A., and X. Jia. 2006. Remote Sensing Digital Image Analysis: An Introduction, (pp. 232–234). Heidelberg: Springer.
- Vapnik, V. 1995. The Nature of Statistical Learning Theory, New York: Springer-Verlag.
- Vapnik, V. 1998. Statistical Learning Theory, New York: Wiley.
- Weng, Q. 2001. “Modeling Urban Growth Effects on Surface Runoff with the Integration of Remote Sensing and GIS.” Environmental Management 28 (6): 737–748. doi:10.1007/s002670010258.
- Weng, Q. 2012. “Remote Sensing of Impervious Surfaces in the Urban Areas: Requirements, Methods, and Trends.” Remote Sensing of Environment 117, 34–49. doi:10.1016/j.rse.2011.02.030.
- Weng, Q., and X. Hu. 2008. “Medium Spatial Resolution Satellite Imagery for Estimating and Mapping Urban Impervious Surfaces Using LSMA and ANN.” IEEE Transactions on Geoscience and Remote Sensing 468: 2397–2406. Retrieved from http://ieeexplore.ieee.org/xpls/abs_all.jsp?arnumber=4559748&tag=1.
- Weng, Q., X. Hu, and H. Liu. 2009. “Estimating Impervious Surfaces Using Linear Spectral Mixture Analysis with Multitemporal ASTER Images.” International Journal of Remote Sensing 30 (18): 4807–4830. doi:10.1080/01431160802665926.
- Weston, J., and C. Watkins. 1999. “Support Vector Machines for Multi-class Pattern Recognition.” InProceedings of the Seventh European Symposium on Artificial Neural Networks, Belgium. 219–224. Bruges, Belgium: D-Facto Publications, April 21–23
- Wu, C. 2004. “Normalized Spectral Mixture Analysis for Monitoring Urban Composition Using ETM+Imagery.” Remote Sensing of Environment 93, 480–492. doi:10.1016/j.rse.2004.08.003.
- Wu, C., and A. T. Murray. 2003. “Estimating Impervious Surface Distribution by Spectral Mixture Analysis.” Remote Sensing of Environment 84 (4): 493–505. doi:10.1016/S0034-4257(02)00136-0.
- Wu, C., and F. Yuan. 2007. “Seasonal Sensitivity Analysis of Impervious Surface Estimation with Satellite Imagery.” Photogrammetric Engineering and Remote Sensing 73 (12): 1393–1401. Retrieved from http://cat.inist.fr/?aModele=afficheN&cpsidt=19886470.
- Yang, L., C. Huang, C. G. Homer, B. K. Wylie, and M. J. Coan. 2003. “An Approach for Mapping Large-area Impervious Surfaces: Synergistic Use of Landsat-7 ETM+and High Spatial Resolution Imagery.” Canadian Journal of Remote Sensing 29 (2): 230–240. doi:10.5589/m02-098.
- Yu, D., and C. Wu. 2004. “Understanding Population Segregation from Landsat ETM+Imagery: A Geographically Weighted Regression Approach.” GIScience and Remote Sensing 41 (3): 187–206. doi:10.2747/1548-1603.41.3.187.
- Zhang, Y. H., M. Hu, L. J. Zhong, A. Wiedensohler, S. C. Liu, M. O. Andreae, W. Wang, and S. J. Fan. 2008. “Regional Integrated Experiments on Air Quality over Pearl River Delta 2004 (PRIDE-PRD2004): Overview.” Atmospheric Environment 42 (25): 6157–6173. doi:10.1016/j.atmosenv.2008.03.025.
- Zhang, H., Y. Zhang, and H. Lin. 2012. “A Comparison Study of Impervious Surfaces Estimation Using Optical and SAR Remote Sensing Images.” International Journal of Applied Earth Observation and Geoinformation 18, 148–156. doi:10.1016/j.jag.2011.12.015.

