Abstract
Land surface albedo is an important parameter to describe the radiant forcing in the climate system. A long-time series of global albedo products is needed to understand the mechanism of climate change. Aiming to support global change and Earth system studies, GLASS (Global LAnd Surface Satellites) provides long-term global land surface albedo product from 1981 to 2010, which are generated from multisource remote sensing data and newly developed algorithms. It is critical to assess the quality of the GLASS product when it is released to the public. This paper first introduced the algorithms and then analyzed the integrity, accuracy, and robustness of the GLASS albedo product. The results show that the GLASS albedo product is a gapless, long-term continuous, and self-consistent data-set with an accuracy similar to that of the widely acknowledged MODIS MCD43 product. The quality flag, which is provided along with the black-sky and white-sky albedo, gives a pertinent indication of the expected uncertainty in the product.
1. Introduction
As the effects of global warming become more and more drastic, there comes an urgent demand to understand the global climate system as well as its influence on and reaction to environmental change or human activities (Liang et al. Citation2010). Land surface albedo is one of the major radiant forcing factors in the climate system because the albedo determines how much solar radiation will be absorbed at the land surface (Dickinson Citation1995). The variation of the land surface albedo is hard to predict, as this variation is affected by many factors (Gao et al. Citation2005), such as snow/rain and vegetation status. Therefore, satellite remote sensing is the most effective technique to map the spatial and temporal distribution of the global land surface albedo (Schaaf et al. Citation2008; Zhang et al. Citation2010).
As a result of the advances in quantitative remote sensing research, many global or regional land surface albedo products have been released. These products are derived either from polar orbit satellite data, e.g. Moderate Resolution Imaging Spectroradiometer (MODIS) (Lucht, Schaaf, and Strahler Citation2000; Schaaf et al. Citation2002; Gao et al. Citation2005), POLarization and Directionality of the Earth's Reflectances (POLDER) (Leroy et al. Citation1997; Maignan, Bréon, and Lacaze Citation2004; Bacour and Breon Citation2005), MEdium Resolution Imaging Spectrometer (MERIS) (Muller Citation2008), Clouds and Earth's Radiant Energy System (CERES) (Rutan et al. Citation2006), Multi-angle Imaging SpectroRadiometer (MISR) (Weiss et al. Citation1999; Diner et al. Citation2008), and VEGETATION (Geiger and Samain Citation2004), or from geostationary satellite data, e.g. Meteosat First Generation (MFG) (Pinty et al. Citation2000; Govaerts et al. Citation2008) and Meteosat Second Generation (MSG) (van Leeuwen and Roujean Citation2002; Geiger et al. Citation2005). The MODIS MCD43 series of BRDF (Bidirectional Reflectance Distribution Function) and albedo products, generated by NASA's MODLAND team, provide a global albedo map in a continuous time series from 2000 to the present (Schaaf et al. Citation2008). The MCD43 series of products are the most complete and widely recognized data-set for the global albedo, and their algorithm has a profound influence on other albedo inversion algorithms. Before 2000, however, the available global albedo data-sets are very limited. The published Advanced Very High Resolution Radiometer (AVHRR) albedo products (Saunders Citation1990; Hu et al. Citation2000; Strugnell, Lucht, and Schaaf Citation2001; Trishchenko et al. Citation2008), the POLDER albedo product, and the VEGETATION albedo product cannot compose a continuous time series.
To the users of a remote sensing data product, the quality of the product is critical. There are many aspects of data quality, including integrity, robustness, and accuracy. Integrity refers to the availability of valid data in the user-required spatial and temporal domain. As most remote sensing products suffer from weather influence and leave gaps (invalid data) in cloud-contaminated areas, these gaps often handicap data users. Robustness implies that there should be no unreasonable (but valid) value in the product if the quality flag indicates a valid value. Although most of the existing products have token efforts in quality control (QC) and unreasonable values are generally avoided, anomalies are still occasionally found. The robustness should always be considered, especially for newly derived algorithms or products. Compared with integrity and robustness, much more effort has been devoted to evaluating the accuracy of remote sensing products. For example, the accuracy of the MCD43 series of albedo products has been investigated in many approaches (Liang et al. Citation2002; Jin et al. Citation2003; Liu et al. Citation2009; Román et al. Citation2009; Wang et al. Citation2010; Cescatti et al. Citation2012). These albedo products are generally agreed to be satisfactorily accurate in snow-free conditions and when a full-retrieval algorithm is applied. Many authors have also emphasized that the scale discrepancy between ground observations and remote sensing pixels should be considered when validating remote sensing products with ground-based measurements (Lucht et al. Citation2000; Liang et al. Citation2002; Román et al. Citation2009).
Global change studies demand spatially complete and long-term global albedo products. However, remote sensing retrieval results from a single sensor are limited by the sensor's characteristics, spatial and temporal coverage, and acquisition conditions and cannot satisfy the needs of many applications. To fill this gap, several international research projects have been devoted to the generation of long-term global albedo products by combining remote sensing data from different sensors/satellites. For example, the ESA GLOBALBEDO project has planned to generate 15 years of gap-filled global albedo products by combining remote sensing data from several European sensors, i.e. the Along Track Scanning Radiometer (ATSR) series, the VEGETATION series, and MERIS (Lewis et al. Citation2011; Muller et al. Citation2012).
GLASS (Global LAnd Surface Satellite) is a series of remote sensing products generated by the research team in the College of Global Change and Earth System Sciences, Beijing Normal University. This project aims to provide long-term land surface key parameters for global change study and climate modeling (Liang et al. CitationForthcoming). The GLASS shortwave albedo product provides a long-time series of high-quality, gap-filled global albedo map from 1981 to 2010. The V1.0 GLASS product has been formally released to the public in 2012. The work presented in this article provides the basic description of GLASS albedo product and gives a first-chance evaluation of its quality in the sense of integrity, robustness, and accuracy.
2. Description of the GLASS albedo products and algorithms
2.1. Algorithm summary
To provide a high-quality and user-friendly data product, the GLASS albedo is generated in two steps. In the first step, the albedo is retrieved from remote sensing data by an inversion of the radiative transfer process. The results from the first step are called intermediate products. In the second step, different types of intermediate products are merged to generate a unique and gap-filled final product. Three major algorithms, i.e. AB1 (Angular Bin 1), AB2 (Angular Bin 2), and STF (Statistics-based Temporal Filtering), have been developed to support the GLASS albedo production.
Both AB1 and AB2 are regression algorithms enhanced with the angular bin method, which was first proposed in Liang, Stroeve, and Box (Citation2005) and further developed in Qu et al. (CitationForthcoming). The AB1 algorithm builds a linear regression equation between the ground-surface directional reflectance and the broadband albedo, specifically the shortwave white-sky albedo (WSA) and black-sky albedo (BSA) corresponding to the solar angle at local noon. The idea of angular bin method is to divide the space of the solar/view geometry into small grids, which are called ‘angular bins,’ and to derive different regression coefficients in different angular bins. In this way, the anisotropy of the land surface is empirically corrected. The AB2 algorithm is similar to the AB1 algorithm but builds a linear regression equation between the top-of-atmosphere directional reflectance and the land surface broadband albedo. A detailed description of the angular bin method can be found in the product Algorithm Theoretical Basis Document (ATBD) (Liu et al. Citation2012b) or in Qu et al. (CitationForthcoming).
The STF algorithm is an approach based on Bayes theory that regards different intermediate products as samples of the ‘true’ surface albedo with an inversion error and time discrepancy. Therefore, the optimal estimation of the true albedo is in the position of the maximum posterior probability according to statistical law. In this way, the information from different intermediate products is merged, and the noise is reduced. In the case that there is no valid sample in the temporal filtering window, a-priori distribution of the albedo is adopted to fill the gap. Details of the STF method can be found in the product ATBD (Liu et al. Citation2012b) or in Liu et al. (Citation2011, Citation2012a).
presents the conceptual flowchart for the GLASS albedo production line. AB1 and AB2 are applied in step 1, and STF is applied in step 2.
2.2. Product summary
2.2.1. Years 2000–2010
The information source for the GLASS albedo product from 19 February 2000 to 31 December 2010 is the MODIS sensors onboard the Terra and Aqua satellites.
Both the AB1 and AB2 algorithms are applied to retrieve the shortwave surface albedo from the MODIS data. The input of AB1 is the multiband directional reflectance at the surface, which corresponds to the atmosphere correction products MOD09GA/MYD09GA released by NASA (Vermote, Nazmi, and Christopher Citation2002). The output of AB1 is an intermediate product called either GLASS02A21, which corresponds to Terra, or GLASS02A22, which corresponds to Aqua. The AB2 algorithm is based on the apparent reflectance at the top of the atmosphere. The main input of AB2 is the MODIS calibrated radiance products MOD021km/MYD021km released by NASA. For the purpose of geometric processing, the geolocation products MOD03/MYD03 are necessary. The MODIS cloud mask products MOD35/MYD35 are also adopted to provide cloud information. The outputs of AB2 are intermediate products called GLASS02A23 and GLASS02A24, corresponding to Terra and Aqua, respectively.
In summary, we have four intermediate products, each corresponding to different algorithms and data sources. Instead of sending all these products together to the user, GLASS chooses to merge them into one final product with the STF algorithm. The inputs of STF are the four intermediate products introduced above, and the length of temporal filter window is 17 days. The output final product is called GLASS02A06, which provides a gap-filled land surface shortwave BSA and WSA with a spatial resolution of 1 km and a temporal step of 1 day.
2.2.2. Years 1981–2000
The information source of the GLASS albedo product before 2000 is the AVHRR data. The Long-term Land Data Record (LTDR) project has archived and preprocessed the AVHRR data from 1981 to 2000 (Pedelty et al. Citation2007). Version 3 of the project's released AVHRR data-set has been geometrically and atmospherically corrected (Vermote Citation2007). GLASS combines the AB1 algorithm and STF algorithm in a pipeline program to generate an albedo product from the LTDR AVHRR data-set. Compared to MODIS, the AVHRR data has less spectral channels, reduced number of temporal samples (AVHRR is once a day while MODIS is twice a day) and much lower spatial representativeness (AVHRR Global Area Coverage data-set processes only one scan line out of every three). In order to adequately accumulate valid observations for the STF algorithm, the length of temporal filter window is enlarged to 33 days. The resulting final product is called GLASS02B05; it has a spatial resolution of 0.05° and a temporal step of 8 days, and it extends from 4 July 1981 to 18 February 2000.
A summary of all of the intermediate and final albedo products in GLASS is presented in . Because only the final products will be available to public users, the term ‘GLASS albedo product’ hereafter refers to GLASS02A06 after 2000 and GLASS02B05 before 2000 by default.
Table 1. List of GLASS albedo intermediate and final products.
3. Reference data-sets
To assess the accuracy of a remote sensing product, the product is usually compared with a reference that is considered to be more accurate or trustworthy. A ground-based measurement is a natural candidate to act as the reference and is often referred to as the ‘ground truth.’ However, for coarse-resolution remote sensing products, there is a significant scale discrepancy between ground-based measurements and remote sensing measurements. The ‘ground truth’ may no longer be the best reference data for the evaluation of the coarse-resolution remote sensing product. In this case, another existing remote sensing product is more readily available and scale-consistent to the product to be evaluated. Therefore, a cross comparison with a sophisticated product can provide an even better indication of the product's quality than a direct validation. In this paper, the GLASS albedo is compared not only with the ground-based measurement but also with the MODIS MCD43 product released by NASA.
3.1. Ground-based measurements
The FLUXNET network (Baldocchi et al. Citation2001) is currently the largest global data-set of energy and mass flux measurements at the ecosystem scale. In a recent approach (Cescatti et al. Citation2012), the ‘La Thuile’ database of FLUXNET (www.fluxdata.org, October 2010) has been compared with the MODIS BRDF/albedo product MCD43A1, which has a 500-m spatial resolution and an 8-day temporal step, and the consistency between these data-sets at different areas and plant functional types has been analyzed. In this approach, 53 FLUXNET sites were considered to meet the criterion of land cover homogeneity. To minimize the uncertainty caused by the discrepancy in the observation scale, the same 53 homogeneous sites in the ‘La Thuile’ database are also used to validate the 1-km resolution GLASS albedo products in this paper. In processing the ground measurements, the actual albedo, which is the ratio of the upward to the downward shortwave radiant flux measured by tower-based pyranometers within 2 hours around local noon, is extracted from the database. Invalid values or measurements of insufficient incoming radiant flux, which is mostly caused by clouds and determined when the downward radiant flux is less than 70% of the clear-sky irradiance, have been screened off. The clear-sky irradiance is calculated with a 6S atmospheric radiative transfer model (Vermote et al. Citation1997) with the default atmosphere parameters of a mid-latitude summer and a solar angle corresponding to the measurement time and location.
Although we choose the same ground data-set as the reference paper (Cescatti et al. Citation2012), our results may not be totally comparable to those of the paper because the MCD43A1 product is in 500 m resolution while the GLASS albedo product is in 1 km spatial resolution, and these two approaches have different aims and focuses.
3.2. Other satellite remote sensing data products
The MCD43 series of land surface BRDF/albedo products generated by NASA's MODLAND team is one of the most successful quantitative remote sensing products in the EOS project. This series has been extensively validated and widely applied in many research fields. It also shares the same information source, i.e. MODIS onboard Terra and Aqua, with the GLASS albedo product after 2000. The version 5 of the MCD43A3 product, which is derived from the combined inversion of the MODIS data from both the Terra and Aqua platforms in 16-day composition window, with a 500-m spatial resolution and an 8-day temporal step, is the currently available standard product with highest quality in this series. And its quality flag is provided in the MCD43A2 product. There are also MCD43B3/MCD43B2 products, which are derived by aggregating MCD43A3/MCD43A2 products into 1-km resolution and thus more comparable to GLASS albedo product. These four MCD43 products are adopted as the reference data-set to evaluate the GLASS albedo product.
4. Results analysis
4.1. Statistics of the GLASS albedo quality flag
To evaluate the quality of the GLASS albedo products, we start by analyzing the QC flag in the final GLASS albedo products. The flag is a 16-bit data field provided for each pixel. The bitwise interpretation of the QC flag for GLASS02A06 and GLASS02B05 products is given in , and the details of this interpretation can be found in the user manual. The lowest two bits give an indication of the overall quality of the albedo product in the pixel, with ‘00’ indicating a ‘good’ estimation result with the criterion of an uncertainty of less than 0.01 absolutely or 5% relatively, ‘01’ indicating an ‘acceptable’ estimation with the criterion of an uncertainty of less than 0.05 absolutely or 10% relatively, ‘11’ indicating the most uncertain estimation in which the a-priori value has been applied to fill the pixel, and ‘10’ indicating the state between ‘acceptable’ and a ‘fill value.’ In addition to the overall quality assessment, the uncertainty of the albedo estimation is also quantitatively given in bits 11–14. This uncertainty estimation is first generated in the AB1 and AB2 algorithms and passed to the STF algorithm to derive the final uncertainty using statistical principles. However, this uncertainty is only a statistical estimation and does not always reflect the actual error in a specific case.
Table 2. Quality control (QC) flags of the final GLASS albedo product.
To understand the spatial and temporal distribution of the quality of the GLASS albedo product, we first investigate the seasonal variation of the quality flag at typical sites. Histograms of the overall quality flag are derived in monthly temporal windows and 7*7-pixel spatial windows around six typical FLUXNET sites, the names and basic information of which are listed in . The statistics are presented as a percentage bar in . The yellow bar indicates the percentage of pixels with the overall quality flag ‘11,’ which represents the lowest quality. We observe that these yellow bars occur in the RU-Che site, the DE-Hai site, and the BR-Cax site. In winter in high-latitude areas, it is either polar night or the solar zenith angle is larger than 80°; therefore, there is no valid observation in the MODIS shortwave bands to provide information regarding the surface albedo. This fact explains the low-quality product in the RU-Che site and the DE-Hai site. In the case of the BR-Cax site, there are always heavy clouds from November to May in the tropical forest area; therefore, many of the pixels could not obtain a cloud-free observation within the 17-day composition window and were filled with an a-priori value. The blue, dark-green, and light-green bars indicate the data with ‘good,’ ‘acceptable,’ and ‘with uncertainty’ quality flags, respectively. Most of the ‘good’ data can be found in mid-latitude areas, such as the US-Fpe site, the AU_Tum site, and the ZA_Kru site. The pixels marked as ‘acceptable’ and ‘with uncertainty’ also indicate cloud contamination, which mostly occurs in the rain/snow seasons.
Table 3. Information about six typical FLUXNET sites in different continents.
To obtain a clearer view of the spatial distribution of the quality of the GLASS albedo product, maps of the yearly average percentage of good quality data and the average uncertainty in the global scope have been derived. presents the spatial distribution of the average percentage of ‘good’ quality pixels in the GLASS albedo final product throughout 2003 and 2004. A large part of the land areas in low latitude have approximately 100% ‘good’ quality product, with exceptions in the tropical rain forests in Amazonia, Central Africa, and Indonesia and the monsoon areas in India and Southeast Asia, where cloud cover is present throughout the season or the year. In the high-latitude areas, the percent of good quality pixels decreases with latitude. This decrease is due to the phenomenon of large solar zenith angle or polar night. We can find horizontal strips in the high-latitude areas because, if the average solar zenith angle of a MODIS tile is larger than a threshold (80°), the entire tile is excluded in the calculation. presents the spatial distribution of the average uncertainty in the GLASS albedo final product throughout 2003 and 2004. The pattern is essentially the inverse of because there are fewer good quality pixels where large uncertainties occur. We can see that, except for the polar areas, the yearly average uncertainty is less than 0.05 in most of the areas.
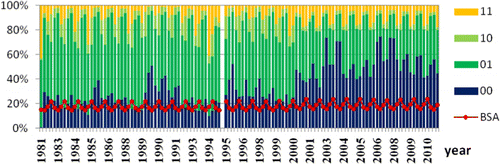
To view the interannual variation in the quality flag of the GLASS albedo product, we chose 402 sample sites scattered all around the world and derived the statistics of the quality flags in these sites. These sites are in the network of Benchmark Land Multisite Analysis and Intercomparison of Products (BELMANIP) (Baret et al. Citation2006). shows the location of these sites on top of a global land/sea boundary map. shows the seasonal average percentage of the quality flags in all of these sites from 1982 to 2010. The percent of good quality products is significantly larger in 2000–2010 than in 1982–1999 because the former is a MODIS-derived product and the latter is AVHRR-derived. The quality improves more after 2003 because the successful launch of the Aqua satellite doubled the available MODIS observations. In the latter half of 1994 (October 1994 to January 1995), there is a gap where no GLASS albedo product is produced. This gap exists because the LTDR version-3 archive does not provide AVHRR data for this period between NOAA 11 and NOAA 14.
4.2. Validation of the GLASS albedo product with ground measurements
The 53 homogeneous FLUXNET sites selected by the former approach (Cescatti et al. Citation2012) are used to validate the accuracy of the GLASS albedo product. The albedo measurement of the flux tower is affected by atmospheric conditions and has less credibility when the incoming solar irradiance is blocked by clouds. Therefore, we screen out the observations with a downward irradiance of less than 70% of the clear-sky irradiance, which are approximately 45% of the total valid data in these sites. The blue-sky albedo of the GLASS product is calculated as a combination of BSA and WSA weighted by a sky light ratio factor, which is simply estimated as the function of the solar angle given in Long and Gaustad (Citation2004). Because only the clear-sky ground measurements are used to validate the GLASS product, the error resulting from this simplistic estimation of the sky light ratio is acceptable.
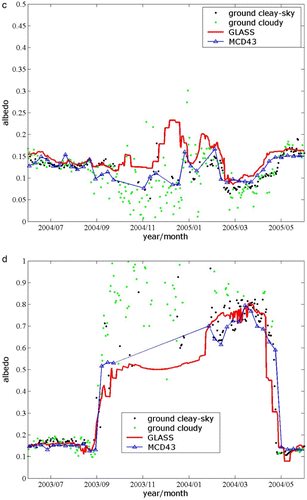
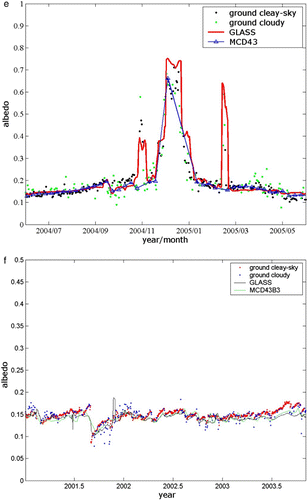
presents the time series of the ground measurement and the GLASS blue-sky albedo in the six typical sites. The black dots indicate the clear-sky ground measurements, whereas the green dots indicate the ground measurements that are screened out. The thick red solid lines indicate the blue-sky albedo extracted from the GLASS02A06 daily product. The blue solid lines with triangular markers indicate the blue-sky albedo from the MCD43A3 8-day product. Generally, the GLASS product reflects the trend and magnitude of the ground observations. The accuracy is better for clear days than for cloudy days. However, some general underestimation of the albedo can be found in winter when snow is most likely present and clear-sky days are rare. A bias is scarcely found in snow-free seasons, except in the DE-Wet site where the GLASS product is slightly higher, which may be caused by the scale discrepancy. The footprint size of surface albedo measurements (mostly 10–20 m) is considerably different from that of MCD43A3 product (500 m) or GLASS02A06 product (1 km). These selected 53 FLUXNET sites are relatively homogeneous in up to a 2 km region around each site. The scale discrepancy is minimized but still exists. Smoothing effects can also be observed in the GLASS product; although the GLASS algorithm tries to preserve the details of the temporal variation of the true surface albedo, there is still a compromise between the actual temporal resolution and noise sensitivity.
Figure 6. Comparison of a one-year time series of the ground-measured albedo and the GLASS blue-sky albedo in typical FLUXNET sites. (a) AU-Tum; (b) BR-Cax; (c) DE-Hai; (d) RU-Che; (e) US-Fpe; (f) ZA-Kru.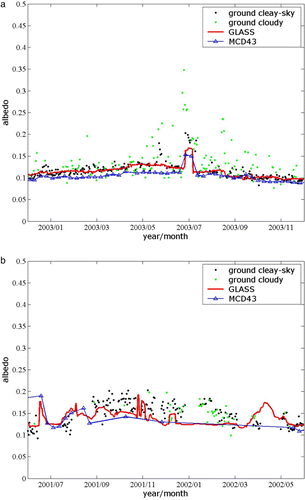
A scatter plot of all of the clear-sky observations in these 53 homogeneous sites is given in , and the statistics are given in . To further analyze the error statistics of the GLASS product, we investigated the GLASS quality flag and selected only the observations with ‘good’ quality flags and the ground measurements of the corresponding date in the clear-sky data-set. The scatter plot for these ‘good’ observations is given in . The points are clearly closer to the diagonal line, and the Root Mean Square Deviation (RMSD) drops from 0.0587 to 0.0455, which means that the quality flag is a pertinent indicator of the accuracy of the GLASS product.
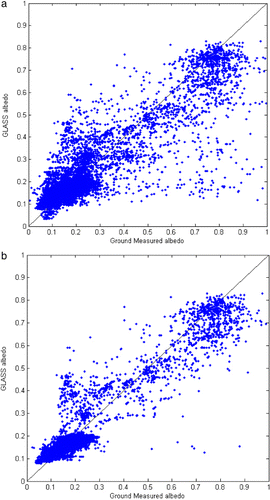
Table 4. Statistics comparing the FLUXNET ground measurements with the GLASS albedo product.
The GLASS albedo algorithm follows a very simple classification rule when generating the product. The land surface state is divided into three categories by the band threshold: vegetation (when NDVI is larger than 0.2), snow/ice (when the reflectance in the blue band is larger than 0.3), and bare ground (other cases). The statistics of these three categories of GLASS albedo are given in . We can see that the RMSD is the smallest in the vegetation observations and the largest in the snow/ice-covered observations. Also note that most of the FLUXNET observations are in the vegetated state. The validation for the bare ground or the snow/ice-covered surface is not sufficient, and the RMSD is larger.
4.3. Cross comparison with the MCD43 product
Cross validation is widely used to evaluate a newly derived product by comparing this product to a more sophisticated existing product. Because both data sources are remote sensing products, this evaluation method is less limited by space, time, and scale discrepancy. The MCD43 series of land surface BRDF/albedo products is currently the most widely used and extensively validated global albedo data-set, and its algorithm has profound influence to algorithms of other albedo products. GLASS albedo product, however, is generated with simpler algorithm of totally different principle. It is interesting to know if the two different algorithms achieve similar results.
To check the consistency of the GLASS albedo product with the MCD43 product, we choose the GLASS02A06 product and MCD43B3 product which have exactly the same spatial coordinates and resolution, as well as similar temporal composition window. The BSA time series from 2003 to 2004 were extracted from 402 BELMANIP sites all around the world. gives the scatter plot of these two products for all valid pairs. Because GLASS provides a gap-filled final product, the term ‘valid pairs’ actually refers to all pairs with a valid MCD43B3 value. The RMSD is 0.031048, and the coefficient of determination (R2) is 0.92225. gives the scatter plot for the good quality GLASS02A06 data and all valid MCD43B3 data. The consistency is better in this refined sample set, with RMSD = 0.022632 and R2 = 0.96682.
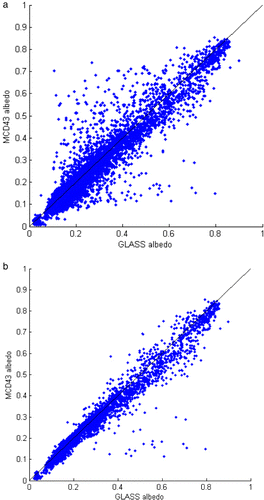
We also divide the data samples into different land surface states with the classification flag in the GLASS product. The statistics in each of the surface states are given in . We can see that most of the samples are categorized as ‘vegetation’ or ‘bare ground,’ and their RMSDs are less than 0.02, indicating a good consistency between the GLASS and MCD43 products in these two surface states. When the surface is most likely covered by snow/ice, the discrepancy is larger, with an RMSD of 0.079677 and a bias of 0.037569. The GLASS albedo product is slightly higher than the MCD43 albedo product for the snow/ice-covered states. Comparing with , the bias between the GLASS and MCD43 products is larger than that between the ground-truth data and the GLASS product. This bias can possibly be attributed to an underestimation of the albedo in the MCD43 product when the surface is covered by snow/ice; the algorithm for NASA's MODIS albedo product has dropped the partially snow-covered observations to maintain the accuracy of the snow-free albedo at the expense of an underestimation of the partial-snow albedo.
Table 5. Statistics of comparing the GLASS02A06 albedo product to the MCD43B3 product.
4.4. Consistency of the MODIS-based and AVHRR-based GLASS albedo products
The GLASS albedo product before 2000 is derived from the AVHRR historical data-set, which has considerable lower quality than other newly acquired remote sensing data. Not only are this product's spatial and temporal resolution considerably lower than that of the product after 2000, which is derived from the MODIS data, but the accuracy is also lower. It is very important to evaluate the quality of the AVHRR-derived GLASS product, but this evaluation is also very difficult because of the scarcity of ground observations or other sophisticated albedo products before 2000. For this reason, as an indirect evaluation of the algorithm, we derived a test product in 2003–2004 from the AVHRR data and compared this product with the MODIS-derived product.
presents the scatter plot of the AVHRR-derived product and the MODIS-derived product in 2003–2004 in all of the BELMANIP sites. gives the statistics of this comparison. In performing the comparison, the MODIS-derived product is upscaled and reprojected into the same geometric grid as the AVHRR-derived product. When the quality flag is not considered, the RMSD of these two products is 0.036668; however, the bias is very small (less than 0.01). This small bias means that in large-scale applications, the random errors will cancel each other, and the overall effect will not be prominent.
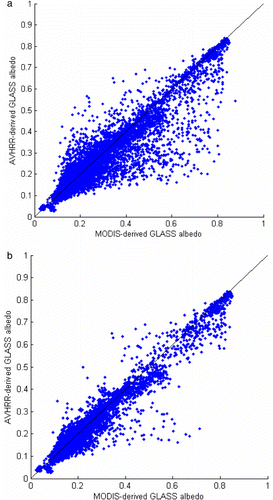
Table 6. Statistics comparing the MODIS-derived GLASS product with the AVHRR-derived GLASS product.
In , the overall quality of the AVHRR-derived product is decreased in contrast to the MODIS-derived product. Therefore, in the AVHRR-derived product, the data with overall quality flags of ‘00’ or ‘01’ are above average quality. If we choose the AVHRR-derived product with ‘00’ or ‘01’ quality flags, the overall RMSD drops to 0.022548, which is a tolerable difference considering the poor quality of the AVHRR data.
Additionally, note that the number of samples in is significantly larger than that in , especially for the snow/ice-covered samples. This difference is explained by the fact that the MCD43 product has many gaps in the permanent and seasonal snow-covered areas, but the GLASS product is gap-filled.
4.5. Albedo change in typical sites from 1982 to 2010
As a demonstration of the possible applications, the time series of the BSA in different latitudinal zones is extracted from the GLASS product, and the changing trends are analyzed. When deriving the regional average albedo, the GLASS albedos in the 0.05° pixels covering the 402 BELMANIP sites are extracted and categorized into four latitudinal zones: S60–S30, S30–N30, N30–N60, and N60–N90. presents the average albedo in these latitudinal zones. To make a clear figure, the albedo time series are temporally aggregated into monthly and yearly averages. The yearly average albedo in each latitudinal zone did not change significantly from 1982 to 2010, but the seasonal pattern shows some interannual change, especially in the third (N30–N60) zone. In the first (S60–S30) and second (S30–N30) zones, the seasonal variation seems to be intensified after 2000, which is most likely an artificial phenomenon due to the difference between the AVHRR-derived albedo and the MODIS-derived albedo. As has been shown in , there are low-quality GLASS albedo products distributed in the tropical area, i.e. the second zone, due to cloud contamination. The albedo products in cloud-contaminated areas obtain very little information from the AVHRR observations but comparatively more information from the MODIS observations. This discrepancy explains why the variation of the albedo product intensified after 2000. Furthermore, the dynamic ranges for the vertical axes of and are very small, which also amplifies the apparent difference. The largest standard deviation of the yearly average albedo is in the third zone (N30–N60). However, in contrast to the large seasonal variation, the interannual variation is not easily detectable by eye.
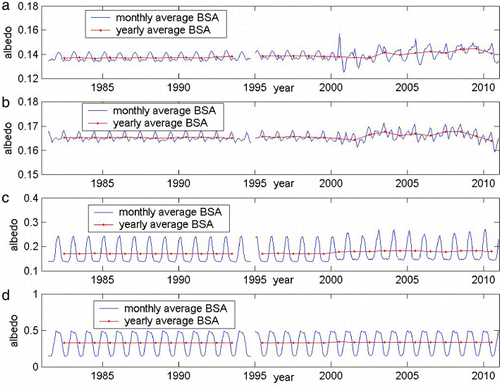
To analyze the changing trend of the yearly average albedo, the Mann–Kendall trend test (Mann Citation1945, Kendall Citation1976) is adopted to determine the significance of the trend and find the trend anomalies. The analysis results are presented in . When the year range of 1982–2010 is considered, a significant increasing trend is detected in all of the zones, and trend anomalies are detected near 2000 in three zones. This result indicates that the switch of the source data from AVHRR to MODIS has an influence on the trend analysis. Comparing the bias in to the standard deviation in , we can conclude that the bias between the two parts of the GLASS albedo product is not omissible when studying the trend in the variation of the albedo. As a compromise, we split the time range into two parts, 1982–1999 and 2000–2010, and analyzed the trend in each part. The results are also in . In the split time ranges, the trend is not significant except for the increasing trend in the first zone (S60–S30), and there are possible (not significant) decreasing trends in the third zone (N30–N60) during 1982–1999 and in the fourth zone (N60–N90) during 2000–2010. The increase in the albedo in the southern hemisphere and the decrease in the albedo in the northern hemisphere are in accordance with other literature (Zhang et al. Citation2010).
Table 7. Results of the Mann–Kendall trend test of the yearly average albedo in different latitudinal zones.
5. Discussions and conclusions
To facilitate climate modeling and global change studies, the GLASS land surface shortwave albedo product has been generated by newly developed algorithms that are different from the commonly used algorithms in other albedo products. Consequently, it is very important and urgent to assess the quality of the GLASS albedo product.
The preliminary evaluation in this paper is based on the V1.0 GLASS products and is performed on three aspects: integrity, accuracy, and robustness. The GLASS albedo product has no spatial gaps over the global land surface and has a continuous time series from 1981 to 2010, except in the latter part of 1994 when no good quality remote sensing data were available. By directly comparing with ground measurements in the homogeneous FLUXNET sites, the GLASS albedo product shows a reasonable consistency with the magnitude and trend of the ground measurements, with a bias of less than 0.001 and an RMSD of less than 0.05 in clear days. The temporal resolution is also enhanced; in several examples, the quick change in the ground measurements can be better captured by the daily GLASS albedo product than the 8-day product. The cross comparison shows that the GLASS product has a very similar value to that of the 1-km resolution MODIS MCD43B3 product generated by NASA's MODLAND team, especially for data marked by a ‘good’ quality flag. Therefore, it can be expected that the GLASS product has a similar accuracy to that of the MCD43 product, which has been widely validated and acknowledged in the community. On the other hand, the standard MCD43A3 product is in 500m spatial resolution and has advantage in capturing the spatial variation of land surface albedo.
The QC flag in the GLASS product gives a valuable indication of the good quality data and those that are uncertain. We can see that more than half of the data are flagged as ‘good’ or ‘acceptable.’ The part of the GLASS product that is most likely to be subjected to error is the AVHRR-derived product. There are almost no adequate validation data before 2000; we can only resort to an indirect evaluation method by comparing the AVHRR-derived product with a theoretically more accurate product, i.e. the MODIS-derived product. A good consistency is found between these two parts of the product.
However, there are possible deficiencies in the current version of the GLASS albedo product, which come either from the algorithm or from the input remote sensing data. The main inversion algorithms, i.e. AB1 and AB2, are regression algorithms that are simple and rely on the representativeness of the training data-set. Although these algorithms are optimized in a statistical way, they certainly cannot account for all the situations of the complex real world. There will be remnant errors in the atmospheric correction, anisotropy correction or band conversion processes. These remnant errors can be partly suppressed in the STF algorithm. However, the STF is not guaranteed to perform well in all cases because it is also a statistics-based algorithm. STF also introduces side effects, such as oversmoothing that decreases the actual temporal resolution of the filtered results. The a-priori database, which is critical in the STF algorithm, is derived from the MCD43B3 product; thus, this database inherits the limitations of the MCD43B3 product, such as insufficient samples in the tropical rain forest areas.
The main information sources of the GLASS albedo product are the MODIS and AVHRR data. There are many other sensors capable of providing information about albedo. Some of these sensors, such as the VIIRS onboard NPP, will be integrated into the GLASS product in the future. However, there is not any likely candidate other than AVHRR to support the generation of an albedo product before 2000. The AVHRR data have limitations in the band number, calibration accuracy, and geometric processing accuracy. Therefore, the AVHRR-derived product has a coarser resolution and lower quality than the MODIS-derived product. The discrepancy between these two parts of the GLASS albedo products are not evident in the large scale but still must be considered when analyzing the change trend of albedo.
The evaluation work presented in this paper is also limited in data source as well as methodology. There are always not enough good quality ground measurements when a global data-set needs to be validated. Measurements in homogeneous sites that are representative to a pixel size of 1 km are even more scarce. Although many researchers suggest adopting an upscaling method to validate remote sensing products in heterogeneous pixels, the procedures are not yet operational. Therefore, the results given in the direct validation section in this paper cannot be looked upon as a strict estimation of the absolute accuracy of the GLASS product but only as an indication.
The GLASS albedo product can be improved in many aspects; for example, the remote sensing data of new sensors should be utilized, and an inversion algorithm based on multisource data needs to be developed. These works have already been started among our fellow scientists. The evaluation/validation of GLASS or any other global albedo product is an ongoing task for all data users. All of the validation results, comments and suggestions will be valuable materials to help us improve GLASS products in the future.
Acknowledgements
This work was financed by the National High Technology Research and Development Program of China (Grant No.2009AA122100) and the authors also want to thank the FLUXNET community for providing the radiometric measurements.
References
- Bacour, C., and F. Breon. 2005. “Variability of Biome Reflectance Directional Signatures as Seen by POLDER.” Remote Sensing of Environment 98: 80–95. doi:10.1016/j.rse.2005.06.008.
- Baldocchi, D., E. Falge, L. H. Gu, R. Olson, D. Hollinger, S. Running, P. Anthoni, et al. 2001. “FLUXNET: A New Tool to Study the Temporal and Spatial Variability of Ecosystem-Scale Carbon Dioxide, Water Vapor, and Energy Flux Densities.” Bulletin of the American Meteorological Society 82: 2415–2434.
- Baret, F., J. T. Morissette, R. A. Fernandes, J. L. Champeaux, R. B. Myneni, J. Chen, S. Plummer, et al. 2006. “Evaluation of the Representativeness of Networks of Sites for the Global Validation and Intercomparison of Land Biophysical Products: Proposition of the CEOS-BELMANIP.” IEEE Transactions on Geoscience and Remote Sensing 44: 1794–1803. doi:10.1109/TGRS.2006.876030.
- Cescatti, A., B. Marcolla, S. K. S. Vannan, J. Y. Pan, M. O. Roman, X. Yang, P. Ciais, et al. 2012. “Intercomparison of MODIS Albedo Retrievals and In Situ Measurements Across the Global FLUXNET Network.” Remote Sensing of Environment 121: 323–334. doi:10.1016/j.rse.2012.02.019.
- Dickinson, R. 1995. “Land Processes in Climate Models.” Remote Sensing of Environment 51: 27–38. doi:10.1016/0034-4257(94)00062-R.
- Diner, D. J., J. V. Martonchik, C. Borel, S. Gerstl, H. R. Gordon, Y. Knyazikhin, R. Myneni, B. Pinty, and M. M. Verstraete. 2008. “Multi-angle Imaging SpectroRadiometer (MISR) Level 2 Surface Retrieval Algorithm Theoretical Basis (Version E).” Accessed May 30, 2008. http://eospso.gsfc.nasa.gov/sites/default/files/atbd/ATB_L2Surface43.pdf.
- Gao, F., C. Schaaf, A. Strahler, A. Roesch, W. Lucht, and R. Dickinson. 2005. “MODIS Bidirectional Reflectance Distribution Function and Albedo Climate Modeling Grid Products and the Variability of Albedo for Major Global Vegetation Types.” Journal of Geophysical Research 110: D01104. doi:10.1029/2004JD005190.
- Geiger, B., J. Roujean, D. Carrer, and C. Meurey. 2005. “Product User Manual (PUM) Land Surface Albedo.” LSA SAF Internal Documents.
- Geiger, B., and O. Samain. 2004. “Albedo Determination, Algorithm Theoretical Basis Document of the CYCLOPES Project.” 20. Météo-France/CNRM. Accessed December 8, 2004. http://toyo.mediasfrance.org/IMG/pdf/CYCL_ATBD-Albedo_I2.0.pdf.
- Govaerts, Y., A. Lattanzio, M. Taberner, and B. Pinty. 2008. “Generating Global Surface Albedo Products from Multiple Geostationary Satellites.” Remote Sensing of Environment 112: 2804–2816. doi:10.1016/j.rse.2008.01.012.
- Hu, B. X., W. Lucht, A. H. Strahler, C. B. Schaaf, and M. Smith. 2000. “Surface Albedos and Angle-corrected NDVI from AVHRR Observations of South America.” Remote Sensing of Environment 71: 119–132. doi:10.1016/S0034-4257(99)00050-4.
- Jin, Y. F., C. B. Schaaf, C. E. Woodcock, F. Gao, X. W. Li, A. H. Strahler, W. Lucht, and S. L. Liang. 2003. “Consistency of MODIS Surface Bidirectional Reflectance Distribution Function and Albedo Retrievals: 2. Validation.” Journal of Geophysical Research-Atmospheres 108: 4159. doi:10.1029/2002JD002804.
- Kendall, M. G. 1976. Rank Correlation Methods. London: Griffin.
- Leroy, M., J. Deuzé, F. Bréon, O. Hautecoeur, M. Herman, J. Buriez, D. Tanré, S. Bouffies, P. Chazette, and J. Roujean. 1997. “Retrieval of Atmospheric Properties and Surface Bidirectional Reflectances over Land from POLDER/ADEOS.” Journal of Geophysical Research 102: 17023–17037. doi:10.1029/96JD02662.
- Lewis, P., C. Brockmann, O. Danne, J. Fischer, L. Guanter, A. Heckel, O. Krueger, et al. 2011. “GlobAlbedo: Algorithm Theoretical Basis Document,” 323 pp. Accessed June 6, 2012. http://www.globalbedo.org/docs/GlobAlbedo_Albedo_ATBD_V3.1.pdf
- Liang, S., J. Stroeve, and J. Box. 2005. “Mapping Daily Snow/Ice Shortwave Broadband Albedo from Moderate Resolution Imaging Spectroradiometer (MODIS): The Improved Direct Retrieval Algorithm and Validation with Greenland in Situ Measurement.” Journal of Geophysical Research 110: D10109. doi:10.1029/2004JD005493.
- Liang, S., K. Wang, X. Zhang, and M. Wild. 2010. “Review on Estimation of Land Surface Radiation and Energy Budgets from Ground Measurement, Remote Sensing and Model Simulations.” IEEE Journal of Selected Topics in Applied Earth Observations and Remote Sensing 3: 225–240. doi:10.1109/JSTARS.2010.2048556.
- Liang, S. L., H. L. Fang, M. Z. Chen, C. J. Shuey, C. Walthall, C. Daughtry, J. Morisette, C. Schaaf, and A. Strahler. 2002. “Validating MODIS Land Surface Reflectance and Albedo Products: Methods and Preliminary Results.” Remote Sensing of Environment 83: 149–162. doi:10.1016/S0034-4257(02)00092-5.
- Liang, S., X. Zhao, W. Yuan, S. Liu, X. Cheng, Z. Xiao, X. Zhang, et al. Forthcoming. “A Long-term Global LAnd Surface Satellite (GLASS) Dataset for Environmental Studies.” International Journal of Digital Earth.
- Liu, J., C. Schaaf, A. Strahler, Z. Jiao, Y. Shuai, Q. Zhang, M. Roman, J. A. Augustine, and E. G. Dutton. 2009. “Validation of Moderate Resolution Imaging Spectroradiometer (MODIS) Albedo Retrieval Algorithm: Dependence of Albedo on Solar Zenith Angle.” Journal of Geophysical Research-Atmospheres 114: D01106. doi:10.1029/2008JD009969.
- Liu, N. F., Q. Liu, L. Z. Wang, S. L. Liang, J. G. Wen, Y. Qu, and S. H. Liu. 2012a. “Mapping Spatially-temporally Continuous Shortwave Albedo for Global Land Surface from MODIS Data.” Hydrology and Earth System Sciences Discussions 9: 1–22. http://www.hydrol-earth-syst-sci-discuss.net/9/9043/2012/hessd-9-9043-2012.html.
- Liu, N. F., Q. Liu, L. Z. Wang, and J. G. Wen. 2011. “A Temporal Filtering Algorithm to Reconstruct Daily Albedo Series Based on GLASS Albedo Product.” In IEEE International Geoscience and Remote Sensing Symposium, 4277–4280. Vancouver, Canada.
- Liu, Q., Y. Qu, L. Z. Wang, N. F. Liu, S. H. Liu, and S. L. Liang. 2012b. “GLASS — Global Land Surface Broadband Albedo Product: Algorithm Theoretical Basis Document.” Accessed February 16, 2013. http://glass-product.bnu.edu.cn/wendangziliao/suanfawendang/61.html.
- Long, C. N., and K. L. Gaustad. 2004. “The Shortwave (SW) Clear-Sky Detection and Fitting Algorithm: Algorithm Operational Details and Explanations.” In Atmospheric Radiation Measurement Program Technical Report, 26 pp.
- Lucht, W., A. H. Hyman, A. H. Strahler, M. J. Barnsley, P. Hobson, and J. P. Muller. 2000. “A Comparison of Satellite-derived Spectral Albedos to Ground-based Broadband Albedo Measurements Modeled to Satellite Spatial Scale for a Semidesert Landscape.” Remote Sensing of Environment 74: 85–98. doi:10.1016/S0034-4257(00)00125-5.
- Lucht, W., C. B. Schaaf, and A. H. Strahler. 2000. “An Algorithm for the Retrieval of Albedo from Space using Semiempirical BRDF Models.” IEEE Transactions on Geoscience and Remote Sensing 38: 977–998. doi:10.1109/36.841980.
- Maignan, F., F. Bréon, and R. Lacaze. 2004. “Bidirectional Reflectance of Earth Targets: Evaluation of Analytical Models using a Large Set of Spaceborne Measurements with Emphasis on the Hot Spot.” Remote Sensing of Environment 90: 210–220. doi:10.1016/j.rse.2003.12.006.
- Mann, H. B. 1945. “Nonparametric Tests Against Trend.” Econometrica 13: 245–259. doi:10.2307/1907187.
- Muller, J.-P., G. López, G. Watson, N. Shane, T. Kennedy, P. Yuen, P. Lewis, et al. 2012. “The ESA GlobAlbedo Project for mapping the Earth's land surface albedo for 15 Years from European Sensors.” In IEEE Geoscience and Remote Sensing Symposium. Munich, Germany.
- Muller, J. 2008. “Algorithm Theoretical Basis Document: BRDF/albedo retrieval.” Accessed March 20, 2006. http://www.brockmann-consult.de/albedomap/documentation.html.
- Pedelty, J., S. Devadiga, E. Masuoka, M. Brown, J. Pinzon, C. Tucker, D. Roy, et al. 2007. “Generating a Long-term Land Data Record from the AVHRR and MODIS Instruments.” In IEEE International Geoscience and Remote Sensing Symposium, 1021–1024. New York: IEEE.
- Pinty, B., F. Roveda, M. Verstraete, N. Gobron, Y. Govaerts, J. Martonchik, D. Diner, and R. Kahn. 2000. “Surface Albedo Retrieval from Meteosat 1. Theory.” Journal of Geophysical Research 105: 18099–18112. doi:10.1029/2000JD900113.
- Qu, Y., Q. Liu, S. L. Liang, L. Z. Wang, N. F. Liu, and S. H. Liu. Forthcoming. “Direct-estimation Algorithm for Mapping Daily Land-surface Broadband Albedo from MODIS Data.” IEEE Transactions on Geoscience and Remote Sensing.
- Román, M. O., C. B. Schaaf, C. E. Woodcock, A. H. Strahler, X. Yang, R. H. Braswell, P. S. Curtis, et al. 2009. “The MODIS (Collection V005) BRDF/Albedo Product: Assessment of Spatial Representativeness Over Forested Landscapes.” Remote Sensing of Environment 113: 2476–2498. doi:10.1016/j.rse.2009.07.009.
- Rutan, D., T. Charlock, F. Rose, S. Kato, S. Zentz, and L. Coleman. 2006. “Global Surface Albedo from CERES/TERRA Surface and Atmospheric Radiation Budget (SARB) Data Product.” In Proceedings of 12th Conference on Atmospheric Radiation (AMS). Madison, WI.
- Saunders, R. W. 1990. “The Determination of Broad Band Surface Albedo from AVHRR Visible and Near-Infrared Radiances.” International Journal of Remote Sensing 11: 49–67. doi:10.1080/01431169008955000.
- Schaaf, C., F. Gao, A. Strahler, W. Lucht, X. Li, T. Tsang, N. Strugnell, X. Zhang, Y. Jin, and J. Muller. 2002. “First Operational BRDF, Albedo Nadir Reflectance Products from MODIS.” Remote Sensing of Environment 83: 135–148. doi:10.1016/S0034-4257(02)00091-3.
- Schaaf, C., J. Martonchik, B. Pinty, Y. Govaerts, F. Gao, A. Lattanzio, J. Liu, A. Strahler, and M. Taberner 2008. “Retrieval of Surface Albedo from Satellite Sensors.” In Advances in Land Remote Sensing: System, Modelling, Inversion and Application, edited by S. Liang, 219–243. Netherlands: Springer.
- Strugnell, N. C., W. Lucht, and C. Schaaf. 2001. “A Global Albedo Data Set Derived from AVHRR Data for Use in Climate Simulations.” Geophysical Research Letters 28: 191–194. doi:10.1029/2000GL011580.
- Trishchenko, A. P., Y. Luo, K. V. Khlopenkov, and S. Wang. 2008. “A Method to Derive the Multispectral Surface Albedo Consistent with MODIS from Historical AVHRR and VGT Satellite Data.” Journal of Applied Meteorology and Climatology 47: 1199–1221. doi:10.1175/2007JAMC1724.1.
- van Leeuwen, W., and J. Roujean. 2002. “Land Surface Albedo from the Synergistic Use of Polar (EPS) and Geo-stationary (MSG) Observing Systems: An Assessment of Physical Uncertainties.” Remote Sensing of Environment 81: 273–289. doi:10.1016/S0034-4257(02)00005-6.
- Vermote, E. 2007. A 0.05 Degree Global Climate/Interdisciplinary Long Term Data Set from AVHRR, MODIS and VIIRS Algorithms Overview. http://ltdr.nascom.nasa.gov/ltdr/docs/workshop/VERMOTE_LTDR-AVHRR-Algorithm.pdf.
- Vermote, E., Z. Nazmi, and O. Christopher 2002 “Atmospheric Correction of MODIS Data in the Visible to Middle Infrared: First Results.” Remote Sensing of Environment 83: 97–111. doi:10.1016/S0034-4257(02)00089-5.
- Vermote, E. F., D. Tanre, J.-L. Deuze, M. Herman, and J.-J. Morcrette. 1997. “Second Simulation of the Satellite Signal in the Solar Spectrum, 6S: An Overview.” IEEE Transactions on Geoscience and Remote Sensing 35 (3): 675–686. doi:10.1109/36.581987.
- Wang, K., S. Liang, C. L. Schaaf, and A. H. Strahler. 2010. “Evaluation of Moderate Resolution Imaging Spectroradiometer Land Surface Visible and Shortwave Albedo Products at FLUXNET Sites.” Journal of Geophysical Research-Atmospheres, 115: D17107. doi:10.1029/2009JD013101.
- Weiss, M., F. Baret, M. Leroy, A. Begue, O. Hautecoeur, and R. Santer. 1999. “Hemispherical Reflectance and Albedo Estimates from the Accumulation of Across-track Sun-synchronous Satellite Data.” Journal of Geophysical Research Atmospheres 104: 22221–22232. doi:10.1029/1999JD900415.
- Zhang, X., S. Liang, K. Wang, L. Li, and S. Gui. 2010. “Analysis of Global Land Surface Shortwave Broadband Albedo From Multiple Data Sources.” IEEE Journal of Selected Topics in Applied Earth Observations and Remote Sensing 3: 296–305. doi:10.1109/JSTARS.2010.2049342.