
Abstract
There are several issues with Web-based search interfaces on a Sensor Web data infrastructure. It can be difficult to (1) find the proper keywords for the formulation of queries and (2) explore the information if the user does not have previous knowledge about the particular sensor systems providing the information. We investigate how the visualization of sensor resources on a 3D Web-based Digital Earth globe organized by level-of-detail (LOD) can enhance search and exploration of information by easing the formulation of geospatial queries against the metadata of sensor systems. Our case study provides an approach inspired by geographical mashups in which freely available functionality and data are flexibly combined. We use PostgreSQL, PostGIS, PHP, and X3D-Earth technologies to allow the Web3D standard and its geospatial component to be used for visual exploration and LOD control of a dynamic scene. Our goal is to facilitate the dynamic exploration of the Sensor Web and to allow the user to seamlessly focus in on a particular sensor system from a set of registered sensor networks deployed across the globe. We present a prototype metadata exploration system featuring LOD for a multiscaled Sensor Web as a Digital Earth application.
1. Introduction
A larger number of distributed environmental sensing and monitoring sensor networks are being deployed and are generating data-sets continuously. Furthermore, increasing demands for environmental sensing and modeling at multiple scales make discovery, exploration, and sharing of sensor resources indispensable. For example, urban meteorological research has a different scope of interest, depending on its modeling scale. This research can vary from the level of individual constructed facilities to the mesoscale of the city and the macrosystem of the coupled biosphere. Therefore, discovery and exploration of sensor resources are a fundamental task undertaken daily by environmental research projects.
While most researchers rely on the sensor data portals hosted by a few large-scale government and research institutes (e.g. NOAA, NASA, GEOSS, et al.) (Liang et al. Citation2010b), finding information on the Web is generally done using an ordinary text query or tree-based hierarchical text exploration interface. This approach is useful in that people routinely find sensor data from specific data portals. However, searching and exploration can be frustrating when queries return a tremendous number of sensor resources. Often the query output does not match what they are seeking. The traditional search and discovery interface of a Web-based sensor resource portal has several issues. First, in a text-based query interface it is often difficult to find proper keywords to formulate queries if the researcher is not a domain expert on the sensor systems. Second, the tree-based exploration interface is inefficient because the information seeker needs to explore every detail node of the interface to figure out if they can find useful sensor resources. The geospatial data infrastructure (GDI) has similar difficulties from the perspective of data discovery and exploration and often uses geobrowsers such as Google Earth or NASA World Wind for geographical mapping and 3D visualization. Unfortunately, the traditional search processes for most sensor networks do not reflect these advances. Search remains primarily textual and result lists are usually unstructured and not interactive. Therefore, there is need for an efficient discovery and exploration interface for large distributed sensor resources.
In this paper, we introduce an approach for sensor metadata discovery by exploring a Web-based 3D virtual globe on which the metadata of distributed sensor systems are queried and visualized through interaction with the information seeker. In order to provide a more intuitive exposure of metadata for sensor networks, we implement a dynamic 3D scene of sensor information on the globe by interactive navigation using Web3D technologies. Multiple levels-of-detail (LOD) for metadata visualization are proposed for the display of a multiscaled sensor network in a Web-based Digital Earth globe. Our goal is to facilitate the dynamic exploration of the Sensor Web and allow the user to seamlessly focus in on a particular sensor system from a set of registered sensor networks. We apply the proposed approach to the exploration of metadata of personal weather stations which are deployed across the globe in order to investigate how the visualization of metadata on a 3D Web-based globe organized by LOD can enhance the search and exploration of information.
2. Related work
Research on the navigation and exploration of sensor networks has been conducted within and across several research communities. In this section, we highlight some of the key ideas underlying our work.
2.1. Discovering, exploring, and sharing the Sensor Web
Similar to the W3C Web standards enabling the WWW, the Open Geospatial Consortium's Sensor Web Enablement (SWE) standards enable researchers and developers to make sensing resources discoverable, accessible, and reuseable via the Web. The SWE is composed of candidate specifications including Observation and Measurement (O&M), Sensor Model Language (SensorML), and Sensor Observation Service (SOS). The Sensor Instance Registry (SIR) was introduced as a web service interface for discovering sensors, collecting sensor metadata, handling sensor status information, and to close the gap between the SensorML-based metadata model and the information models used by Open Geospatial Consortium (OGC) Catalogs (Jirka and Nüst Citation2010). A reader can refer to the recent publication (Bröring et al. Citation2011) to get detail information about examples and applications of SWE.
A semantic approach is necessary to facilitate discovery of heterogeneous sensor resources and their data-sets. Research on the Semantic Sensor Web (Sheth, Henson, and Sahoo Citation2008) investigates the role of semantic annotation, ontologies, and reasoning to improve Sensor Web functionality including sensor discovery and sensor integration. Related work in this field includes methods for linking geosensor databases with ontologies (Hornsby and King Citation2008), a semantically enabled SOS (SemSOS) (Henson et al. Citation2009) or the semantic annotation of sensor services with terms from ontologies (Babitski et al. Citation2009).
Ontologies need to serve as the basis for semantic reasoning. Various research groups have started to specify sensor, stimuli, and observation ontologies. Examples include the Semantic Web for Earth and Environmental Terminology (SWEET) (Raskin and Pan Citation2005) focusing on modeling of observed properties, observation-based ontologies influenced by O&M (Probst Citation2006), and a sensor-centric ontology with a strong relation to SensorML (Russomanno, Kothari, and Thomas Citation2005). There are also domain-specific ontologies, such as the Marine Metadata Interoperability project, which is particularly designed for oceanographic sensors (Bermudez, Graybeal, and Arko Citation2006). The observation-centric ontology was also developed in a consensus process within the W3C Semantic Sensor Network Incubator Group (Janowicz and Compton Citation2010). An ontology for sensor data exchange was derived from the Content Standard for Digital Geospatial Metadata (CSDGM) (Federal Geographic Data Committee Citation1998), SensorML and SWEET, and used for its prototype service (Feng and Yu Citation2010). However, it still has the limitation of a text-based query interface. Thus this paper focuses on enhancing the user interface for search and exploration of sensor resources.
For dynamic exploration of the Sensor Web proposed in this paper, a metadata model and ontology for sensor data are necessary. We utilize the CSDGM standard model for harvesting sensor metadata and transforming the collected metadata sets into our online database to investigate our approach. However, the metadata model and ontology for sensor data collection, which are the enabling technologies for data harvesting for our prototype system, are not the principal idea of our approach because we aim at improving the user's experience for interactive exploration of Sensor Web.
2.2. Visual exploration of metadata and ontology
Metadata that describe characteristics of a sensor resource are used for discovering potential data-sets and evaluating their suitability for the researcher's purposes. Discovery is based on search functions relying on metadata about thematic, spatial, and temporal extents of data-sets (Beard and Sharma Citation1997). Previous teams have developed tools for evaluating data-sets by visualization. For example, Mutton and Golbeck used 2D graphs to visualize semantic metadata and ontologies (Mutton and Golbeck Citation2003), but such graphs can often be complicated and hard to comprehend. Other researchers, therefore, developed algorithms for the 3D visualization of semantic metadata models and ontologies (Papamanthou, Tollis, and Doerr Citation2004). Gobel and Jasnoch used visualization techniques and spatial metaphors to generate effective and intuitive representations of the metadata (Göbel and Jasnoch Citation2001). Multiple scholars have demonstrated the usefulness of the visualization of metadata as a tool for visual analysis and reasoning and have used them to support the search for geographic resources (Ahonen-Rainio Citation2005; Albertoni, Bertone, and Martino Citation2005).
Exploratory visual analysis is useful for the preliminary investigation of large spatiotemporal data-sets (Wood et al. Citation2007). The mapping and superimposition of metadata summaries can be used to provide a supporting context for data discovery and access by the synthesis of metadata, map, and feature services (Aditya and Kraak Citation2007a, Citation2007b; Nicula et al. Citation2008).
2.3. 2D and 3D geovisualization on the web
The previous practices of web portals for sensor data publication seem to be data-oriented instead of demand-driven (Crompvoets et al. Citation2004) and often provide limited support for users to effectively and efficiently assess the fitness of the data for a particular research purpose. For example, the visualization and integration of the metadata, map, and feature services required in support of information discovery and decision support could be improved. Aditya and Kraak introduced a 2D web-based atlas interface as a metaphor to access the GDI (Aditya and Kraak Citation2007a, Citation2007b). Previous work has shown the potential of 3D visualization using virtual globe as a tool of data exploration (Stensgaard et al. Citation2009; Tomaszewski Citation2011). The virtual globe is used for exploring geotemporal differences of data-sets (Hoeber et al. Citation2011; Wood et al. Citation2007) and data publication of Sensor Web (Liang et al. Citation2010a). The 3D thematic mapping using the virtual globe and geobrowsers (Sandvik Citation2008) offered a framework of 3D geovisualization for statistical data-sets. It provides an inspiration for 3D geovisualization of metadata of Sensor Web. Sandvik (Citation2008) also advocated the advantages of 3D visualization when using geographical thematic mapping in a series of articles. Multiple visual variables (e.g. color and height of 3D geometry) to present statistical indicators make comparison of information easier and much more accurate when spinning the globe and they provide freedom of navigation with 3D Digital Earth.
3. Design of metadata visualization
We extend data-oriented data registry of Sensor Web toward visual information exploration in the virtual globe on the Web, by developing interactive visualizations that provide dynamic exploration across multiple LOD. These are intuitive user interfaces for efficient information retrieval of metadata for large data-sets of sensor resources across the globe.
3.1. Design goals
In order to explore a number of distributed sensor resources efficiently, we have to consider the characteristics and the process of information retrieval and acquisition of human recognition. For an unskilled information seeker, finding proper sensor systems from a large amount of unstructured metadata is similar to finding a specific grain of sand in a desert. Because current web portals for data publication and sharing of deployed sensor resources are data-oriented and organized from the perspective of the data provider, it is difficult to explore information without specific knowledge about the resources. Our goal in designing metadata visualization is not to provide a system for the skilled expert who has specific information he or she is seeking but to create an intuitive exploration environment for researchers who may be unfamiliar with the sensor resources in a particular field. These external researchers need tools to dynamically filter out unnecessary information from the system according to their interests by visually exposing a summary of the metadata from a registry of sensor systems on the virtual globe. To realize this goal, the method of visualization and the level of visualized metadata should selectively change according to the perspective view of the information seeker. The visualization system should guide an information seeker in progressively reducing candidate query results from large data-sets of unfamiliar sensor resources. The specific design goals of metadata visualization system are the following:
Enable casual formulation of geospatial semantic queries. An information exploration system should support casual browsing of a large information space using semantic queries. For example, the system should enable filtering metadata according to thematic or administrative areas. The capability of defining a search area with multipolygon and other geospatial queries should be supported. Complex queries can be constructed in a conjunctive form using a combination of multiple queries. The exploration system should allow the formulation of search queries based on parameters by selecting geometric objects in a 3D scene that might be difficult to specify with textual queries. For instance, formulation of a query to select sensor resources recorded within a specific multipolygon is not simple to describe in a textual query.
Summarize information collections visually. The display should include a visual overview of metadata as well as a clear indication of the currently selected and filtered items. According to the selected sensor source area, the number of items, and the complexity of information, the system should represent the summarized information with proper visualization methods and LOD. The LOD will be explained more in the following section.
Use integrated dynamic visualization. The system should provide unrestricted degree-of-freedom of navigation for intuitive exploration. The data should be visualized on the 3D earth globe system.
Optimize the amount of data transmitted to the user. In order to avoid heavy data transmission, the system should minimize the amount of data retrieved. Light and responsive navigation of the 3D earth globe with summarized metadata visualization is necessary.
Conform to open standards for interoperability. The overall architecture and technologies employed in an information exploration system as well as the markup of sensor metadata should use open standards to foster integrated exploration of heterogeneous sensor resources.
Provide information drill down. The interface should provide access to an appropriate resolution of sensor information and specific sensor data. The information seeker should be able to display detailed information such as sensor description and recent history of sensor values for result items upon request. The metadata exploration system can provide direct access to the repository storing the sensor data-set.
3.2. LOD of metadata
In information exploration visualized on a virtual globe, the system must display not only information from the virtual globe but also metadata of sensor networks in a way that depends on the complexity of the two sets of information. For example, if the most pertinent sensor stations are deployed in a specific area while thousands of stations are recorded in the metadata registry, the local view of the 3D scene can display only specific sensor stations which are included in the viewing frustum of the current scene. However, the global view of the same information shows all the metadata in a very small region of display. If the same method of visualization is applied for both cases, the amount of information in the global view is larger than that of the local view, and there are complex occlusions among the metadata displayed in a small area. These phenomena should be avoided through the consideration of proper visualization methods for different LOD. Another example is the visualization of metadata for sensor networks of different deployment scale in a single 3D scene. Assume that one sensor network is deployed in a city-scale area but another sensor network is deployed across the world. Then we have to consider proper LOD for each set of metadata from the two different sensor networks to enable the information seeker recognize the difference. We summarize specific visualization methods for metadata exploration in .
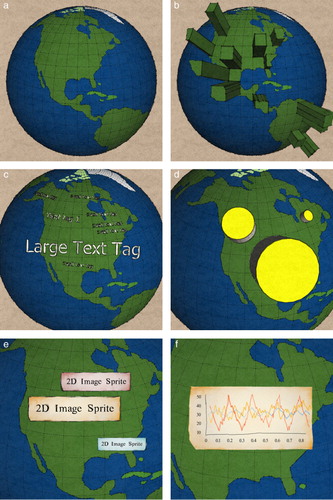
Statistical visualization. An information exploration system should be able to display a statistical visualization, which shows the distribution of sensor systems according to geographical location. It is appropriate to expose a broad view of the overall metadata registered in the system. The visualization can show a bar chart, choropleth, and proportional symbol, which are geographically referenced on the globe (see b).
Text tag: A text tag shows 3D text on a specific location of the virtual globe (c). It shows textual information with variation of size, style, and color of the text displayed. It is used to display more detailed information than statistical visualization. For example, a text tag can show a sensor identification string with different color and size according to the characteristic of sensor systems.
3D shape template. A 3D shape template can be used to display any kind of 3D object on the globe. For example, a simplified 3D model of sensor system can be a template. It can be located at any specific geographical location. It is similar to the proportional symbol of statistical visualization (d). However, a 3D shape template is composed with an X3D shape object so that any event, animation, and interaction can be implemented with X3D standard node description.
2D dynamic sprite. 2D dynamic sprite is a simple 2D image that is generated dynamically on the information exploration server. It is appropriate to draw summarized information of the sensor system in limited 3D space. The image is dynamically generated according to queries and mapped as a texture image on a 3D geometry in a 3D scene (e).
Graph drawing of sensor data: Practical sensor data can be displayed as a 2D or a 3D graph drawing in the 3D space of the information exploration system (f). Otherwise, the graph can be displayed in separate windows in a Web browser. It is useful to visualize the recent history of sensor values when the information seeker wants to access more detail of the sensor system after decreasing focus on a particular sensor system.
The types of visualization, described above, should be modified by a reduction of focus range of the 3D scene in the procedural information exploration so that the amount of information exposed to the user can be managed.
3.3. Standard technologies
The component technologies are configured to explore the massive metadata of Sensor Web. All are freely available with open APIs and data exchange formats, and each has capabilities that fulfill some of the requirements outlined above. The data, applications, and communication technologies used are depicted in .
3.3.1. X3D-Earth
X3D is a royalty-free open standard file format and a run-time architecture to represent and communicate 3D scenes and objects using XML. The X3D Geospatial Component provides support for geographic and geospatial applications, including the ability to embed geospatial coordinates in certain X3D nodes, to support high-precision geospatial modeling and to handle large multiresolution terrain databases.
X3D-Earth is an open standard-based technology for publishing earth globes, which includes tools to enable users to build their own globes utilizing their own data. We can build our X3D-Earth globe instance based on the specific requirements for exploring the metadata from particular sensor networks.
3.3.2. X3DOM
Behr et al. (Citation2009) introduced X3DOM, which is a model that allows the direct integration of X3D nodes into HTML5 document object model (DOM) content. X3DOM eases the integration of X3D in modern web applications by directly mapping and synchronizing live DOM elements to a X3D scene model. X3DOM extends the DOM interfaces and allows the application developer to access and manipulate the 3D content by only adding, removing, or changing the DOM elements via standard DOM scripting. Thus, no specific plug-ins or plug-in interfaces such as the Scene Authoring Interface are needed.
4. Implementation
We implemented a Web-based system to support the visual exploration of a large collection of metadata from the distributed Sensor Web. The prototype performs online browsing of approximately 34,000 sensor systems from which data-sets are accessible.
4.1. Architecture
4.1.1. Web-based architecture
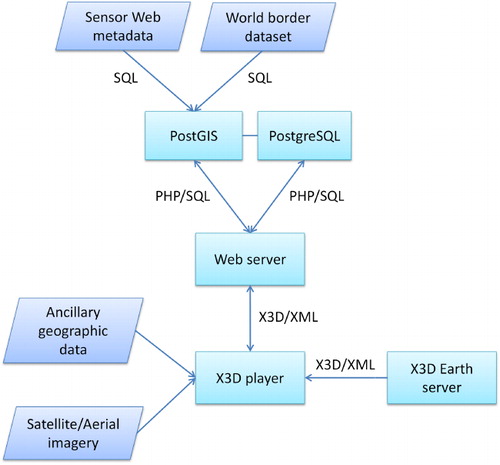
The architecture of the visual metadata exploration system is divided into two parts: client-side and server-side (see ). On the Web server, data are processed and filtered to generate a dynamic X3D scene. We use PHP as an overall programming framework and PostgreSQL as the back-end database for storing processed metadata from the distributed Sensor Web. PostGIS is used to extend the geospatial capability of the database.
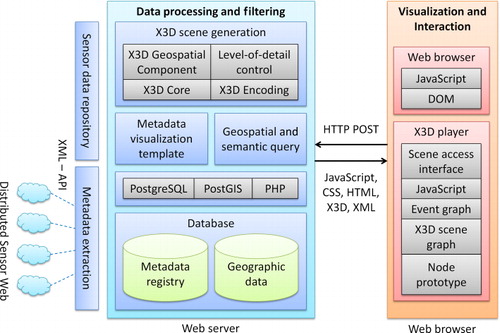
Presentations and interactions are realized in the Web browser. We support the latest build of Mozilla Firefox, Google Chrome, and Microsoft Internet Explorer. We employ BS Contact Geo (Web3D Consortium Citation2010) as a standard X3D player implementation that renders the X3D scene and handles interactive events from the metadata exploration. We chose BS Contact Geo because it conforms to the specification of X3D Geospatial Component and enables integration with multiple Web-browser implementations aforementioned.
While the basic structure of the interface is transmitted as HTML, CSS, and JavaScript files, the actual processed and filtered data for the interactive exploration of metadata is retrieved by the browser as X3D XML encoded objects, generated in response to the current geospatial query.
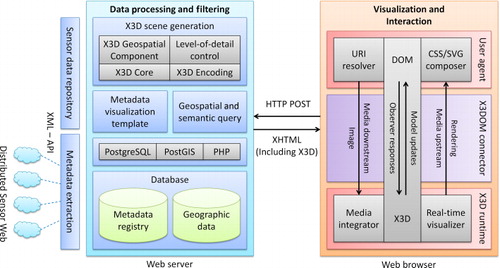
4.1.2. HTML5/X3D integration
Because the W3C standards such as HTML5, CSS3, and Web-browser implementations are moving forward quickly, X3D has also been moving toward a new framework and run-time to support the integration of HTML5 and declarative 3D content. The new framework tries to fulfill the current HTML5 specifications for declarative 3D content and allows the inclusion of X3D elements as part of any HTML5 DOM tree. Therefore, we employ X3DOM as a HTML5/X3D integration model that renders X3D scenes and handles interactive events from the metadata exploration. The architecture of the visual metadata exploration system using the HTML5/X3D integration model is depicted in . Presentations and interactions are realized in the Web browser. We support the latest build of WebGL-enabled browsers. WebGL-enabled web browsers are available for most platforms. The data for interactive exploration of metadata are retrieved by the Web browser as XHTML, which is embedded in HTML documents. In contrast to the abovementioned Web-based architecture employing a separate X3D player, this integration model eliminates the most significant drawback of legacy Web-based architecture; the need for third-party plug-ins to enable interactive representation of 3D geospatial information. Examples of use of the HTML5/X3D integration model are described in from Section 5.2 to Section 5.4.
4.2. X3D-Earth globe
In order to use the X3D-Earth globe (Yoo, Brutzman, and Han Citation2009) to provide background geographical information for metadata of sensor resources, a self-referring PHP script was created to generate X3D terrain-tile sets on-the-fly. When the server receives an initial query by location, it constructs an X3D scene that includes a top-level georeferenced elevation model (GeoElevationGrid node) with height data and an appropriate draped texture imagery (ImageTexture node), along with child URL links to the next-lower quadtree of similarly constructed scenes. The PHP script is then used repeatedly to query, generate, and link terrain-tile files dynamically for each subsequent inline quadtree child. Terrain height data, bathymetry altitude data, cartography, satellite imagery, or aerial photography of interest is retrieved as needed to produce tiled structures for multiresolution terrain. The X3D-Earth globe works with several geospatial web services including OpenAerialMap and OpenStreetMap.
According to circumstance, the application displays only borderlines or satellite imagery, depending on which can help better to make the information seeker concentrate on proper metadata (see ). We implemented the Earth globe using borderlines with georeferenced indexed line sets (IndexedLineSet nodes with GeoCoordinate attribute) generated by a PHP script which queries the jurisdictional region from the world border data stored in our online database. The X3D standard-based Earth globe allows more freedom in expressing geographical context since we can describe the 3D scene graph of the globe itself instead of describing just overlaying information as we would use in a mashup approach with the Google Earth geobrowser.
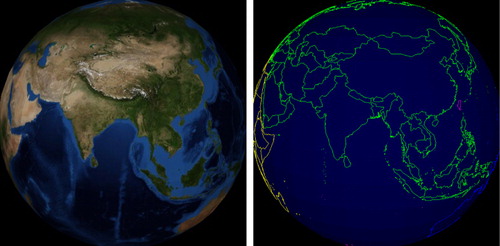
shows the implemented virtual earth rendered with the standard X3D player. The left image is the globe with quadtree tiles based on image texture using NASA's Blue Marble imagery. The right image is the globe with the UN's world border data based on vector poly-lines. We can use these different styles of earth globes according to the application. Furthermore, both implementations can be merged and used simultaneously. The X3D-Earth globe implementation can be easily invoked in any X3D application with an X3D Inline node.
4.3. Geospatial query
A geospatial query is necessary to filter out metadata of sensor resources that are outside of the region of interest during progressive exploration and narrowing of focus. We collect jurisdictional information such as the city and country name when we extract metadata from sensor networks. Therefore, a general query to find metadata of sensor objects that match this city name or region code is straightforward. However, location information such as latitude and longitude is more important because it provides more precise information in a geographic context, and the jurisdictional information is often omitted when we collect metadata from publicly available sensor resources on the Web. In order to make a semantic relation between the jurisdictional name of region and the geographical geometry for the geospatial query, we use the composition of macro geographical (continental) regions, geographical subregions, and selected economic and other groupings information (United Nations Statistics Division Citation2011), which are provided by the statistics division of the USA. The correlated region name, code, and geometry are stored into our online database and are used for formulating a casual query based on the jurisdictional region name such as city or country. For example, it is not possible to figure out whether a sensor station is included in Southeastern Asia, which is a subregion of the Asia, with only the metadata of the station. Formulation of a geospatial query that refers to the corresponding information from world borders data-set enables such a casual query based on region name. This approach is often used for generating metadata visualization with a statistical summary. shows the attribute columns of the world borders data-set stored in our database.
Table 1. Attribute columns of world borders data-set.
4.4. Metadata visualization templates
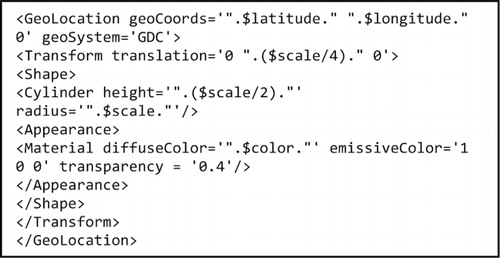
Metadata of selected sensor systems is visualized as X3D nodes in a scene graph. Following the design goals and requirements for LOD mentioned in section 3, we implemented X3D scene graph patterns for metadata visualization templates. At first, we implemented a template for the visualization of a statistical summary using georeferenced 3D bar charts. The bar chart can be located at a specific geographic location by specifying the 3D shape node of the bar chart as a child node of a GeoLocation node in an X3D scene. The rectangular shape of the bar chart can be replaced with an arbitrary 3D object, and it is possible to scale the size of the shape proportionally to the attributes of metadata. We use ProtoDeclare node to declare 3D shape and attribute as a prototype of an X3D shape node and use ProtoInstance node to clone instances of the prototype. Defined prototype nodes can be geographically located, transformed, and scaled with GeoTransform node. In addition, the appearance, such as color and luminosity, can be used to visualize information of metadata attributes implicitly. A simple piece of pseudo code using a cylindrical shape for visualization of a filtered sensor station is shown in .
shows the example visualizations of personal weather stations. The visualizations are implemented using the Web-based architecture explained in Section 4.1.1 with a separate X3D player, BS Contact Geo. (a) shows a 3D bar chart that visualizes the number of stations registered in the database according to country border. (b) shows the geographical location of each station using cylindrical buttons. (b) uses the pseudo code shown in . Both examples are rendered in a standard X3D player embedded in a Web browser. In these examples, we used Google Chrome and BS Contact Geo, although other combinations should work.
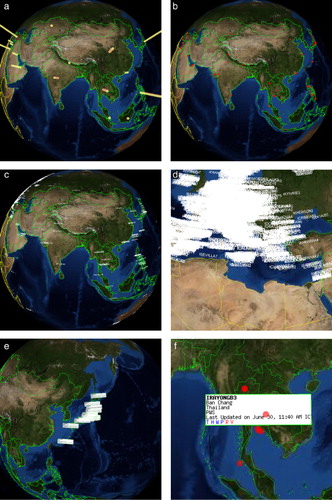
Text tags can display explicit textual information of metadata and implicit information with location, size, and color of the tag. A Text node is used as a child node of a shape node in the X3D scene graph to generate the template for the text tag visualization. A FontStyle node is used to describe size, typeface, color, and style of the text displayed. (c) and (d) show examples of a text tag visualization on the globe. (c) shows a global view with scattered text tags in the Asian region. In this example, we visualized the station identifier as the text string of the text tag, and the geographical location was used for the location of the tag. However, such large numbers of stations are deployed in the European region that the defect of text tag visualization is shown in (d). It is easy for the text tag to be occluded by overlapping tags if the density of deployed stations is higher than the relative distance of the viewing frustum in dynamic exploration. Therefore, a visualization template may need to adapt during exploration to accommodate the density and type of visualized metadata and the current LOD.
The 2D image sprite is generated dynamically from our server by PHP and the GD graphics library. We employed the GD library to generate dynamic images that directly represent summarized metadata queried from our PostGIS database. The generated sprite can represent practical values of measurement as well as the status of sensor systems and the types of sensors with small icons as well as text strings. Font style, color, and size of text string and size, color, and shape of icon can express much detailed information in the limited space of the 2D sprite. The image sprite can be mapped on any 3D geometry in the X3D scene graph since it is used as a regular image texture. (e) shows the visualization of summarized metadata using the image sprite. In this example, we focused our interest on the weather stations located in Japan. The right image shows a close-up view of the 2D image sprite in Thailand. In this example, the image sprite represents identifier, city, and country name, type of the weather station, last observation date and time, and composition and status of sensors, which compose the weather station. Font style and color are used to represent status of the sensors in this example. It is possible to combine multiple visualization templates and formulate more dynamic events using the X3D scene graph. For example, the 3D shape representation shown in (b) can be combined with 2D image sprite. In order to add event control to the 3D scene, a TouchSensor node is attached to the 3D object. The event is triggered when the mouse is over the 3D object (isOver field) and is routed to change the transparency of 2D image sprite. Thus the 2D sprite showing summarized metadata is displayed when the mouse cursor is over the 3D object as shown in (f).
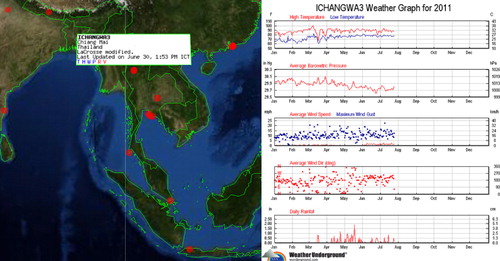
The recent history of sensor data of the selected station can be displayed if the isActive event of the TouchSensor node is triggered as shown in . A 2D image of a graph of recent weather is generated from the API of PWS project of the Weather Underground. The image is embedded in a separate part of the HTML page beside the X3D player. It is the most detailed information that our exploration system can display regarding the selected weather station. The final step of seamless focusing in toward the specific sensor system is that we provide a direct link to the Web page of the sensor system.
5. Use case
5.1. Personal weather stations
As a part of our design process, in order to investigate how the visualization of metadata on a 3D Web-based globe organized by LOD can enhance the search and exploration of information, we applied our development to a prototype metadata exploration system featuring LOD for a multiscaled Sensor Web and used it to visually explore personal- and project-based local weather stations. The 34,700 personal weather stations are collected from the PWS project (Weather Underground Citation2012) and registered in our online database. Large numbers of weather stations are deployed in North America and Europe, but the stations are broadly scattered across the globe. Apart from the personal weather stations, we registered 32 local weather station deployed in Singapore for meteorological research purpose.
The existing data access interface of the PWS project is based on text queries that produce and result lists expressed in HTML table with hyperlinks. This interface provides no mechanism for the user to summarize data or metadata from multiple weather stations. The user's only option is to laboriously follow the link to each individual weather station. This project has transitioned the information exploration process from the traditional text-based user interface to a 3D space with a seamless exploration interface based on a virtual globe. Even when the information seeker does not have domain-specific knowledge of the weather stations, our system provides an easy and intuitive approach to exploring the available sensor information. When the user first engages with the information exploration interface, our system shows only brief information about how many stations are distributed in jurisdictional area borders (a). At this point, the information seeker can decide which areas he or she will explore further to retrieve more detailed information. Once a specific location such as a region border is selected, then a geospatial query implicitly formulated within our system filters out unnecessary information and displays only a summarized result of the metadata within the selected region boundary (b). When the user has more interest in a specific station, then he or she can trigger a mouse event to enable the overlay of a detailed metadata sprite visualized on top of the 3D scene (f). After that, detailed properties and the recent history of measurement shown in a 2D graph can be retrieved as a separate image in an integrated HTML page (). If the information seeker still has specific needs for downloading sensor data from the station, our system provides direct access to the sensor system as a hyperlink.
5.2. Summarization of sensor data
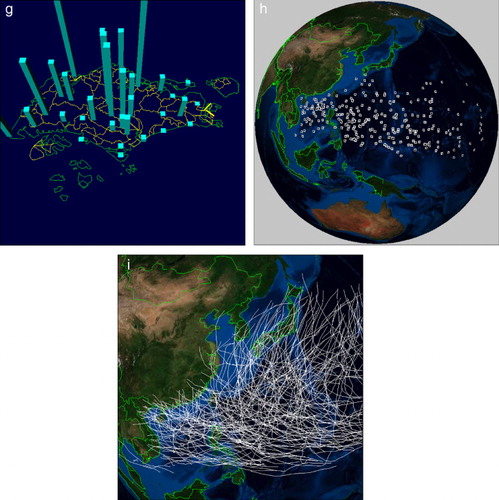
The summarization approaches that reduce LOD at broader views are not limited to summarizing the sensor metadata but are also applicable to summarizing sensor data themselves in order to expose a broad view of the scientific properties of sensors such as temperature to the users. For example, the interface of our system allows the user to browse statistical summaries of the number of registered weather stations that are geographically distributed as depicted in (a). The same visualization template used in the (a) is applicable to visualizing statistical summaries of the temperature values recorded by the sensors at the registered weather stations. When the user selects sensor data (e.g. temperature) instead of sensor metadata as the visualization mode, our prototype system displays average values of temperature recorded by sensors in weather stations within each country border (a). A geospatial query, which computes average values of temperature by country from registered weather stations, is implicitly formulated within our system, and a dynamic 3D scene is generated using a statistical bar chart. The color and the height scale of the bar chart in (a) vary proportionally according to the value of the temperature. The 3D bar chart shows real values scaled to fit on a digital globe, and the user can easily assess differences in average temperature between stations. When the user has more interest in a specific region, e.g. Japan as shown in (b), the LOD of the dynamic 3D scene is automatically updated by a geospatial query, which is again implicitly formulated within the system. If the coverage of a dynamic 3D scene is small enough to expose the values of temperature from every single weather station within the scene bounds, a geospatial query that requests the real temperature of each such weather station is implicitly formulated, and the system displays the temperature of the only those weather stations selected by the query (b).
Figure 9. Visualization of sensor resources on a Web-based virtual globe using HTML5/X3D integration model: (a) a summarized visualization of sensor data showing statistical temperature values of weather stations in each contry, (b) a local view of separate temperature of weather stations, (c) 3D prism, (d) detail sensor data graph visualized with mouse event on a dynamic sprite of sensor metadata, (e) a dynamic 3D scene composed of various visualization templates, (f) visualization of rainfall data for Sinagpore in a local view, (g) dynamic change of the 3D bar chart according to the change of rainfall data, (h) a global view of a 3D shape template used for a visualization of the summary for tropical cyclones data-sets, and (i) a local view of a line set template used for a visualization of the detail trajectory of mature hurrycane data.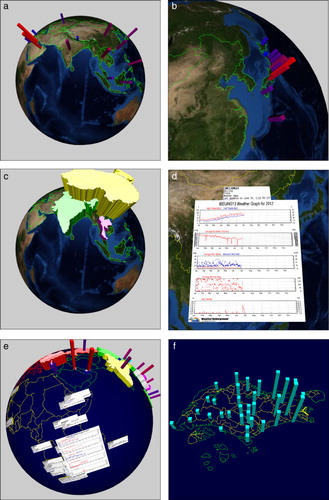
5.3. HTML5/X3D integration prototype
The examples shown in use the HTML5/X3D integration model. We implemented the prototype exploration system to verify the advantages of eliminating third-party X3D players and prove the feasibility of HTML DOM integration. Google Chrome and Mac OS X were used in these examples, although other browsers, including Firefox and Safari, should work for comparison with the prototype using BS Contact Geo and Microsoft Windows. The current implementation of X3DOM lacks support for several nodes belonging to the geospatial component such as GeoLocation, GeoTransform, and GeoViewpoint nodes. Thus we implemented visualization templates using IndexedFaceset composed of GeoCoordinate nodes instead of georeferencing standard X3D objects.
(c) shows a 3D prism map, which is inspired by 3D thematic mapping (Sandvik Citation2008). A combination of multiple visualization templates in a single HTML5 document is also available. For example, the image sprite can be combined with a graph-drawing template. In order to add event control to the 3D scene, an element.appendChild event is attached to the image sprite. The event is triggered when the mouse over the image sprite (element.onmouseover attribute) is routed to add X3D nodes that render a 2D graph. Thus the 2D graph showing the recent history of sensor data is displayed when the mouse cursor is over the image sprite as shown in (d). A 2D image of a graph of recent weather is mapped as an ImageTexture node of a 3D surface by the element.setAttribute method. (e) shows a dynamic 3D scene composed of five different visualization templates in a single HTML5 document. These examples show that the 3D visualization templates make comparison of information easier and much more accurate.
5.4. Visual exploration of cyberinfrastructure
In order to verify the usefulness of our approach and the feasibility of the proposed visualization templates according to the LOD of sensor resources, we applied our approach to different types of sensor data-sets. As we mentioned in Section 1, archived sensor data-sets provided by data portals are the most reliable sensor resource for environmental researchers. We developed a cyberinfrastructure (Yoo et al. Citation2012) to extend the longevity of sensor data, to facilitate data discovery, and to provide data access for authorized users. This Web service provides sensor data registration, discovery, and exchange using ontology-based scientific metadata (Yu and Feng Citation2009).
We registered a rainfall data archive that is available from the National Environment Agency (NEA) of Singapore. The archive is composed of hourly rainfall data from 33 sensor stations. The boundary boarder, water basins, and the rainfall archive of Singapore are accessible from the cyberinfrastructure; however, the interface is based on text-based query. We applied our visualization template to the rainfall data archive and the results are shown in (f) and (g). The 3D bar chart in (f) and (g) show values of rainfall for each water basin, and the bar chart dynamically varies according to the hourly rainfall data archived in our system. The exploration environment using the HTML/X3D integration model makes a dynamic comparison of rainfall values and a precise comparison without any specialized tools except our prototype Web application and standard Web browsers.
The Typhoon Center of Regional Specialized Meteorological Center (RSMC) of Japan at Tokyo provides information on tropical cyclones in the western North Pacific and the South China Sea. The aforementioned cyberinfrastructure provides a web service for spatial analysis of the tropical cyclone track data. We applied the proposed visualization templates to data exploration for the spatial analysis functions. (h) shows a global view of a 3D shape template that visualizes the simplified information of tropical cyclones. The visualization provides an intuitive understanding of the distribution of tropical cyclones for a selected period. The dynamic exploration interface including free spinning and navigation with just a standard Web browser makes data exploration easier. (i) shows a local view of line streams, which represents the trajectories of mature hurricanes among the data-sets shown in (h).
6. Conclusion
In this work, we have introduced a visual exploration interface using 3D space for visualizing metadata of the Sensor Web. Our aim is to provide a more efficient and intuitive mechanism for data discovery using Web-based Digital Earth technology. This approach transitions human processing of information during data discovery from 2D space with text-based search to 3D space with visual media navigation. The amount of information transmitted to the user during the exploration is increased dramatically compared to the former text-based approach. Furthermore, the seamless focusing enabled by the new interface provides a less frustrating and a more intuitive experience.
The main contribution of this work is the design and the verification of LOD of metadata for Web-based dynamic visualization, the application of dynamic geospatial query, and the use of HTML5 Web architecture, which enables mashup with the X3D-based Digital Earth globe and sensor resources. We have shown the feasibility and the usefulness of our approach to make a transition of the legacy data exploration interface to Web-based information exploration of sensor resources. The Web application based on the HTML5/X3D integration model eliminates the need for third-party plug-ins to enable interactive representation of 3D geospatial information. Information exploration of the Sensor Web based on an X3D-Earth globe with only a standard Web-browser implementation without any third-party plug-in has, therefore, been realized.
In the current realization, our prototype system is limited to fairly simple visual representations and query variations. This is partly due to the constrained capabilities of current Web browsers, the current implementation of HTML5/X3D integration model that support X3D Geospatial Component, and the rather simple data extraction used for the prototype. For example, the X3D player, BS Contact Geo, still does not conform to the full specification of X3D standard version 3.2. X3DOM and have not fully implemented the X3D Geospatial Component. We have also found a new need to improve the specification of X3D Geospatial Component. For instance, the Extrusion node specification should be revised to support GeoCoordinate so that the statistical visualization template can support a pyramidal shape representation of choropleth.
We expect to extend the functionality of our prototype to facilitate the dynamic exploration of the Sensor Web and to allow the user to seamlessly focus in on a particular sensor system in more intuitive ways.
Acknowledgment
This work was supported in part by the Korea Institute of Science and Technology (KIST) Institutional Program (Project No. 2E24100).
References
- Aditya, T., and M.-J. Kraak. 2007a. “Aim4GDI: Facilitating the Synthesis of GDI Resources Through Mapping and Superimpositions of Metadata Summaries.” GeoInformatica 11 (4): 459–478. doi:10.1007/s10707-007-0021-4.
- Aditya, T., and M.-J. Kraak. 2007b. “A Search Interface for an SDI: Implementation and Evaluation of Metadata Visualization Strategies.” Transactions in GIS 11 (3): 413–435. doi:10.1111/j.1467-9671.2007.01053.x.
- Ahonen-Rainio, P. 2005. Visualization of Geospatial Metadata for Selecting Geographic Datasets. Espoo: Helsinki University of Technology.
- Albertoni, R., A. Bertone, and M. D. Martino. 2005. “Visualization and Semantic Analysis of Geographic Metadata.” In The 2005 Workshop on Geographic Information Retrieval, 9–16. Bremen: ACM.
- Babitski, G., S. Bergweiler, J. Hoffmann, D. Schön, C. Stasch, and A. Walkowski. 2009. “Ontology-based Integration of Sensor Web Services in Disaster Management.” In Geospatial Semantics, edited by K. Janowicz, M. Raubal, and S. Levashkin, 103–121. Heidelberg: Springer Berlin.
- Beard, K., and V. Sharma. 1997. “Multidimensional Ranking for Data in Digital Spatial Libraries.” International Journal on Digital Libraries 1 (2): 153–160. doi:10.1007/s007990050011.
- Behr, J., P. Eschler, Y. Jung, and M. Zöllner. 2009. “X3dom: A DOM-based html5/X3D Integration Model.” In International Conference on 3D Web Technology, 127–135. Darmstadt: ACM.
- Bermudez, L., J. Graybeal, and R. Arko. 2006. “A Marine Platforms Ontology: Experiences and Lessons.” In 5th International Semantic Web Conference ISWC 2006. Athens, GA: Semantic Web Science Association.
- Bröring, A., J. Echterhoff, S. Jirka, I. Simonis, T. Everding, C. Stasch, S. Liang, and R. Lemmens. 2011. “New Generation Sensor Web Enablement.” Sensors 11 (3): 2652–2699. 10.3390/s110302652
- Crompvoets, J., A. Bregt, A. Rajabifard, and I. Williamson. 2004. “Assessing the Worldwide Developments of National Spatial Data Clearinghouses.” International Journal of Geographical Information Science 18 (7): 665–689. doi:10.1080/13658810410001702030.
- Federal Geographic Data Committee. 1998. Content Standard for Digital Geospatial Metadata [online]. http://www.fgdc.gov/metadata/csdgm.
- Feng, C.-C., and L. Yu. 2010. “Ontology-based Data Exchange and Integration: An Experience in Cyberinfrastructure of Sensor Network Based Monitoring System.” In International Conference on Advances in Semantic Processing, 83–90. Florence: IARIA.
- Göbel, S., and U. Jasnoch. 2001. “Visualization Techniques in Metadata Information Systems for Geospatial Data.” Advances in Environmental Research 5 (4): 415–424. doi:10.1016/S1093-0191(01)00093-4.
- Henson, C. A., J. K. Pschorr, A. P. Sheth, and K. Thirunarayan. 2009. “Semsos: Semantic Sensor Observation Service.” In International Symposium on Collaborative Technologies and Systems, 44–53. Baltimore, ML: IEEE.
- Hoeber, O., G. Wilson, S. Harding, R. Enguehard, and R. Devillers. 2011. “Exploring Geo-temporal Differences Using GTdiff.” In Pacific Visualization Symposium (PacificVis), 2011 IEEE, 139–146. Hong Kong: IEEE.
- Hornsby, K. S., and K. King. 2008. “Linking Geosensor Network Data and Ontologies to Support Transportation Modeling.” In Geosensor Networks, edited by S. Nittel, A. Labrinidis, and A. Stefanidis, 191–209. Berlin: Springer.
- Janowicz, K., and M. Compton. 2010. “The Stimulus-sensor-observation Ontology Design Pattern and Its Integration into the Semantic Sensor Network Ontology.” In International Workshop on Semantic Sensor Networks 2010, 7–11. Shanghai, China.
- Jirka, S., and D. Nüst. 2010. “Sensor Instance Registry Discussion Paper.” Paper presented at the Open Geospatial Consortium.
- Liang, S., D. Chang, J. Badger, R. Rezel, S. Chen, C. Y. Huang, and R. Y. Li, 2010a. “Geocens: Geospatial Cyberinfrastructure for Environmental Sensing.” In International Conference on Geographic Information Science. Zurich, Switzerland, .
- Liang, S., S. Chen, C. Huang, R. Li, Y. Chang, J. Badger, and R. Rezel. 2010b. “Capturing the Long Tail of Sensor Web.” In International Workshop on Role of Volunteered Geographic Information in Advancing Science. Zurich, Switzerland.
- Mutton, P., and J. Golbeck. 2003. “Visualization of Semantic Metadata and Ontologies.” In Seventh International Conference on Information Visualization, Proceedings, 300–305. London: IEEE.
- Nicula, B., C. Marqué, and D. Berghmans. 2008. “Visualization of Distributed Solar Data and Metadata with the Solar Weather Browser.” Solar Physics 248 (2): 225–232. doi:10.1007/s11207-007-9105-4.
- Papamanthou, C., I. G. Tollis, and M. Doerr. 2004. “3D Visualization of Semantic Metadata Models and Ontologies.” In Lecture Notes in Computer Science – 12th International Symposium on Graph Drawing 3383, 377–388. New York, NY.
- Probst, F. 2006. “Ontological Analysis of Observations and Measurements.” In Geographic Information Science, edited by M. Raubal, H. Miller, A. Frank, and M. Goodchild, 304–320. Berlin: Springer.
- Raskin, R. G., and M. J. Pan. 2005. “Knowledge Representation in the Semantic Web for Earth and Environmental Terminology (sweet).” Computers & Geosciences 31 (9): 1119–1125. doi:10.1016/j.cageo.2004.12.004.
- Russomanno, D. J., C. Kothari, and O. Thomas. 2005. “Building a Sensor Ontology: A Practical Approach Leveraging ISO and OGC Models.” In International Conference on Artificial Intelligence, 17–18. Las Vegas, NV, USA.
- Sandvik, B. 2008. “Using KML for Thematic Mapping.” Accessed 19 February 2013. http://thematicmapping.org/downloads/Using_KML_for_Thematic_Mapping.pdf,
- Sheth, A., C. Henson, and S. S. Sahoo. 2008. “Semantic Sensor Web.” Internet Computing, IEEE 12 (4): 78–83. doi:10.1109/MIC.2008.87.
- Stensgaard, A.-S., C. F. L. Saarnak, J. Utzinger, P. Vounatsou, C. Simoonga, G. Mushinge, C. Rahbek, F. Møhlenberg, and T. K. Kristensen. 2009. “Virtual Globes and Geospatial Health: The Potential of New Tools in the Management and Control of Vector-borne Diseases.” Geospatial Health 3 (2): 127–141. http://eprints.bice.rm.cnr.it/2843.
- Tomaszewski, B. 2011. “Situation Awareness and Virtual Globes: Applications for Disaster Management.” Computers & Geosciences 37 (1): 86–92. doi:10.1016/j.cageo.2010.03.009.
- United Nations Statistics Division. 2011. Composition of Macro Geographical (continental) Regions, Geographical Sub-regions, and Selected Economic and Other Groupings. http://unstats.un.org/unsd/methods/m49/m49regin.htm
- Weather Underground. 2012. “The Personal Weather Station Project.” http://www.wunderground.com/weatherstation/index.asp
- Web3d Consortium. 2010. “Player Support for X3D Components.” http://www.web3d.org/x3d/wiki/index.php/Player_support_for_X3D_components
- Wood, J., J. Dykes, A. Slingsby, and K. Clarke. 2007. “Interactive Visual Exploration of a Large Spatio-temporal Dataset: Reflections on a Geovisualization Mashup.” Visualization and Computer Graphics, IEEE Transactions on 13 (6): 1176–1183. doi:10.1109/TVCG.2007.70570.
- Yoo, B., D. Brutzman, and S. Han. 2009. “X3D Earth: Open Standard-based Virtual Globes for Digital Earth Infrastructure.” In International Symposium on Remote Sensing. Busan: KSRS.
- Yoo, B., J. Wu, C.-Y. Chen, and V. J. Harward. 2012. CENSAM Cyberinfrastructure. Accessed 3 March 2013. http://www.censam.org.
- Yu, L., and C.-C. Feng. 2009. Ontology-based Scientific Metadata Infrastructure: Experience of Data Exchange in Environmental Sensing and Modeling. Singapore: National University of Singapore.