
Abstract
This paper evaluates the quality characteristics of existing versions of 3-arc-second SRTM and 1-arc-second GDEM over Anji County, Zhejiang, China using reference elevations from a high-quality 1:10 k topographic map. Results show that SRTM has higher accuracy (RMSE =12.44 m) than GDEM (RMSE=14.20 m for Version 1, 12.76 m for Version 2); however, unsatisfactory void filling and an overall 1/2 pixel shift exits in SRTM version 4.1. Although spurious elevations over omitted water bodies still persist, GDEM Version 2 demonstrated significant improvement over Version 1. Accuracies of both SRTM and GDEM decrease on steeper slopes. Aspect also influences both the magnitude and the sign of errors. DEM accuracy in non-forested areas is considerably higher than that in forested areas. SRTM version 4.1 and GDEM version 2 possessed actual spatial resolutions of 90 m, despite both of them failed to match their nominal accuracies. SRTM Version 4.1 could be the first choice, while ASTER GDEM Version 2 would be a good alternative for areas where extensive voids exist in SRTM.
Keywords:
1. Introduction
A Digital Elevation Model (DEM) is a computational representation of the continuous variation of relief over space from which topographic parameters can be digitally generated. DEMs are an important data source for a wide range of applications in Earth and environmental sciences. From hydrologic modeling of flooding and runoff to characterizing atmospheric boundary layer friction, the Earth's topography is essential, making widespread access to high-quality global DEMs of obvious practical importance (Farr et al. Citation2007).
Coarse-resolution DEMs with global coverage have been publicly available since 1988, including products at 5-arc-minute resolution: ETOPO5, TerrainBase, and JGP95E, and 30-arc-second resolution: GTOPO30, GLOBE, and ACE (Arabelos Citation2000; Hilton et al. Citation2003). Although these DEMs provided basic topographic information, scientific studies concerned with land surface representation at regional scale were constrained by their coarse resolutions (Chang et al. Citation2010). In the last decade, significant advances in global elevation modeling have been made with the release of the space-borne SRTM (Shuttle Radar Topography Mission) and ASTER (Advanced Space-borne Thermal Emission and Reflection Radiometer) Global Digital Elevation Model (GDEM) (Werner Citation2001; Abrams et al. Citation2010). DEM data from these two space missions cover most of the populated regions of the world and are publicly available (at no cost) at spatial resolutions of 3-arc-second (~90 m horizontal spatial resolution) for SRTM and 1-arc-second (~30 m resolution) for GDEM. Earth-spanning DEMs with spatial resolution finer than 100 m were finally available.
Due to their reported vertical accuracy of approximately 16 m or better and their availability, SRTM and GDEM have become very popular (Sun et al. Citation2003; ASTER GDEM Validation Team Citation2009). However, SRTM and GDEM products are known to suffer from a number of significant limitations. SRTM elevation data are derived from X-band and C-band Interferometric Synthetic Aperture Radar (InSAR) sensors, which gives heights of the surface including topographic objects (Werner Citation2001; Gorokhovich and Voustianiouk Citation2006). The approach used for constructing the GDEM is the correlation of stereoscopic image pairs, collected by ASTER satellite sensor (ASTER GDEM Validation Team Citation2009; Abrams et al. Citation2010). SRTM and GDEM are in fact digital surface models (DSMs), which are influenced by natural and man-made features. Recent studies have demonstrated that relief (Carabajal and Harding Citation2006; Jacobsen Citation2010) as well as vegetation (Shortridge Citation2006; Miliaresis and Paraschou Citation2011; Chirico et al. Citation2012) affect the spatial variability of the vertical accuracy of these global DEMs. SRTM and GDEM may contain large areas of missing data (data voids) or other anomalies, which can hinder immediate use of these data in their applications. The original SRTM data have undergone a series of processing steps and are currently available as different versions based on different levels of editing, and several research groups also subsequently worked on improving the original SRTM releases (Hirt, Filmer, and Featherstone Citation2010). The same is true of GDEM: after the first release (version 1) in 2009, GDEM version 2 was published in 2011. Different versions of both products are widely available, which could easily confuse public users. The horizontal resolution of DEM data is usually of primary importance for users, but the concept of resolution is not well defined, and it is often mistakenly stated as the spacing of postings (which is analogous to pixel spacing or pixel size in images) (ASTER GDEM Validation Team Citation2011). Recently, the value of practical horizontal resolution of global DEM has been questioned (Smith and Sandwell Citation2003; Pierce et al. Citation2006). The nominal spatial resolution of DEMs may not coincide with the actual information that it contains, and finer pixel size does not guarantee better accuracy (Gómez et al. Citation2012). In this paper, we consider the following use-oriented questions:
What are major changes between the different versions of each product?
What are the strengths and weaknesses of each DEM?
How are their elevations compared with reference elevations, and how does accuracy depend on terrain relief and land cover?
Lack of suitable topographic data has been an obstacle for environmental studies in many developing countries, including China, the geographic focus of this paper. In China, there is a nationwide DEM at 1:50 k scale (i.e. about 25×25 m), which can only be accessed following a difficult qualification examination. Due to rigorous policies on spatial data and China's spatial coordinate system, many users prefer to choose free global DEM data, such as SRTM or GDEM, which are compatible with satellite image data. Given the great demand for SRTM and GDEM, it is important to examine the quality of these datasets; indeed, DEM quality is a critical determinant of the success of terrain-related applications. However, direct assessment of global DEM products and versions is difficult for regional studies in China, as local reference elevation data may either be publicly unavailable or possess peculiar properties. Local topographic data are usually referenced to a Chinese datum, such as the Xi'an 1980 horizontal datum and the Yellow Sea 1985 vertical datum (Dang, Cheng, and Xue Citation2010). However, SRTM and GDEM were referenced to the World Geodetic System (WGS84) horizontal datum and the Earth Gravitational Model 1996 (EGM96), neither of which coincide with the Chinese system. Datum transformation between world and local coordinate systems is the first challenge in DEM assessment in developing countries like China. That might be one reason why many previous global DEM accuracy studies were mainly on regions in developed countries.
This article contributes to the DEM accuracy literature in two primary ways: first, it details an approach to conduct regional accuracy assessment in a country with limited access to directly comparable reference elevations, precisely the context for which global DEMs are most urgently needed; second, it provides quantitative and qualitative evaluations not only of DEM products but also of several available versions of those products. Using a case study of variable and complex landscape in southeastern China, coupled with local reference topographic data, we conducted a DEM-to-DEM comparison to provide insight into product and version variation and error. The assessment not only provides accuracy estimation for SRTM and GDEM versions but also analyzes the impact of terrain relief and land cover on their accuracies and their practical resolutions compared with reference DEM.
2. Study area and data
2.1. Study area
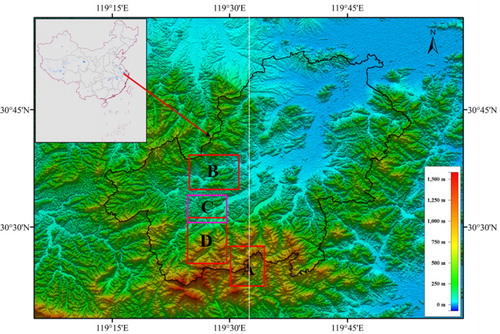
The study area is Anji County, Zhejiang Province, China, which covers an area of 1886 km2 (). Elevation ranges from 1584 m to −44 m (negative values are mainly caused by surface mining, which only cover an area of 0.115 km2). The County is representative of southeastern China with its subtropical climate and hilly landscape. Forest is the major land cover, accounting for 61.2% of the total area. Farmland is generally located at the low and flat areas. The mean annual precipitation is about 1548 mm and the mean annual temperature is 15.7°C (Editor Board of Anji Water Chorography Citation2005). We chose this area because it represents the general geomorphological features of the hilly region in southeastern China and for its broader environmental and scientific significance. As the first ecological county of China, Anji is a part of the Tiaoxi watershed, the most important water source of Taihu Lake, and the site of a series of nationally funded key research projects.
2.2. SRTM
SRTM was an international project spearheaded by the US National Geospatial-Intelligence Agency (NGA) and the National Aeronautics and Space Administration (NASA). The 11-day SRTM flew in February 2000 and has provided a globally consistent digital elevation data for approximately 80% of the world's land surface area (from 60° N to 56° S). SRTM elevation data, produced by NASA originally, are distributed mainly under two spatial resolutions: 1-arc-second in the USA and a degraded 3-arc-second for the rest of the world. SRTM elevation data are based on the WGS84 ellipsoid as horizontal datum, while its mean sea level is defined by EGM96 geoid as vertical datum. The specified accuracy requirement for SRTM DEM products was 16 m absolute vertical error (at 90% confidence level). This paper deals with the better known and widely available 3-arc-second products, which are publicly available over the Internet. There are three versions available:
Version 1 (SRTM1), initial 1-degree tiled elevation data released in 2003; these data are unedited and contain numerous voids and other spurious points, such as anomalously high or low values caused by a variety of reasons such as backscatter and topographic relief.
Version 2.1 (SRTM2), also known as the ‘finished’ version, is the result of substantial editing efforts and exhibits well-defined water bodies and coastlines and the absence of spurious spikes (single pixel errors) based on version 1, although some areas of missing data (voids) still exist.
Version 4.1 (SRTM41), a 5°-tiled version provided by the Consortium of Spatial Information of the Consultative Group for International Agricultural Research (CGIAR–CSI). The original SRTM data have undergone post-processing to fill in the data voids through new interpolation techniques and auxiliary DEM filling (Reuter, Nelson, and Jarvis Citation2007). The first release was version 3 (SRTM3). More information about this data is provided on the CGIAR website http://srtm.csi.cgiar.org.
2.3. ASTER GDEM
ASTER GDEM is a new global elevation data-set, with one arc-sec (30 m) post-spacing in 1°×1°tiles, publicly released by the Japanese Ministry of Economy, Trade, and Industry (METI) and NASA (ASTER GDEM Validation Team Citation2009, Citation2011). The approach used for constructing the GDEM is the correlation of stereoscopic image pairs of the 15 m resolution visible and near infrared (VNIR) imagery component of the ASTER sensor. Complete GDEM covers land surfaces between 83°S and 83°N, which is wider than that of SRTM. There are two versions available:
Version 1 (GDEM1), initially released in 2009, compiled from over 1.2 million scene-based DEMs during an observation period from 2000 to 2007. No accurate information on land or marine areas is provided in GDEM1, nor is an inland water mask applied. GDEM1 had an overall vertical accuracy of around 20 m at the 95% confidence level (Abrams et al. Citation2010). It is important to note that GDEM1 is considered to be research grade because a number of anomalies and artifacts remain in elevation data. (ASTER GDEM Validation Team Citation2009; Hirt, Filmer, and Featherstone Citation2010).
Version 2 (GDEM2), recently released in 2011, compiled from over 1.5 million scene-based DEMs during an observation period from 2000 to 2009. Due to additional scenes, smaller correlation kernel (decreased from nine by 9×9 pixels to 5×5) and improved water masking, (Fujisada, Urai, and Iwasaki Citation2012) identified significant improvements in GDEM2 compared to GDEM1. An accuracy of 17 m at the 95% confidence level was estimated (ASTER GDEM Validation Team Citation2011).
2.4. Reference data
The main reference data was the Chinese 1:10 k Digital Line Graph (DLG): National Topographic Map based on local field survey, with 5 m interval contour lines (Lin et al. Citation2012). The contours were used to generate reference DEM. In addition, field surveyed ground topographic points (GTPs), included in the DLG as an independent layer and with an accuracy of ±0.2 m, were also used as reference data. In this study, a total of 20,000 GTPs, distributed across the entire study area, were extracted from the DLG. The planar coordinate system of these reference data is the 3° zone Gauss-Kruger projection based on the National 1980 Xi'an ellipsoid, and the vertical system is the Yellow Sea 1985 Geoid datum (Dang, Cheng, and Xue Citation2010), both of which are different from that of SRTM and GDEM. Thus the conversion between local reference system and the WGS84 was the first challenge. Measuring of ground control points (GCPs), which had both local reference and WGS 84 coordinates was crucial to the success of this study.
Field GPS measurement is a direct method to empirically derive GCP coordinates. But, it must be acknowledged that the accuracy of absolute positioning of GPS is not always reliable, especially in southeastern China, which have dense vegetation and varied topography. The traditional mode of high accuracy differential GPS (DGPS) positioning requires one GPS receiver to be located at a reference station with known coordinates, while the second receiver simultaneously tracks the same satellite signals. At present, regional networks of Continuously Operating Reference Stations (CORS), which can provide real-time kinematic (RTK) correctors to field GPS users, are now being routinely established as the primary infrastructure over China (Chen et al. Citation2007). In this study, a Trimble 5700 GPS receiver, which can receive a correction signal from ZJCORS (Continuously Operating Reference Stations Network of Zhejiang Province) (Ma et al. Citation2008), was used to measure the coordinates of GCP, and a total of 10 GCPs were collected in the field.
Land cover is also a potentially important factor affecting the elevation accuracy of global DEM. Landsat Thematic Mapper (TM) images in 2007 were used to produce the land use/land cover map, applying supervised classification method. The land use/land cover was classified as Croplands, Orchard, Forest, and Built-up, from which water was masked out.
3. Methods
3.1. Datum transformation
Datum transformation, a conversion from one 3D coordinate system to another, is one of the primary tasks when integrating spatial data with different spatial coordinate systems. As mentioned above, the local topographic data and global DEMs belong to different horizontal and vertical systems. The conversion between local reference system and the WGS84 became the first challenge of this study. Most commonly used datum transformation techniques in geodetics, such as Helmert, Molodensky etc., are 3D transformations. They require precise transformation parameters or a number of precise GCPs, which have 3D geodetic coordinates of WGS84 as well as local datum. However, neither the transformation parameters between WGS84 and Xi'an80 datum, nor the precise geodetic coordinates are available to civilian users in China. ZJCORS does not provide the height data of WGS84, and users can only get the height of Yellow Sea 1985. Coupled with unsatisfactory absolute vertical GPS accuracy, it is difficult to conduct precise3D transformation.
In this study, 2D transformation was used to undertake part tasks of 3D transformation. Compared with 3D transformation, 2D transformation has a different accuracy and may yield a reliable result when the control points are coplanar and the extent of the area is not too large (Knippers and Hendrikse Citation2000). The Spatial Adjustment tool in ArcGIS 10.0 was used to conduct the 2D transformation for this study. This frequently used tool can convert vector data from one coordinate system to another and supports three types of transformations: affine, similarity, and projective (ArcGIS Citation2011). The transformation functions are based on the comparison of the coordinates of source and destination (control) points and different function requires different minimum control points. The Root Mean Square Error (RMSE) can be computed to check the quality of the transformation. With the 10 GCPs, which have both the National 1980 Xi'an and WGS84 coordinates, the original DLGs were converted from Gauss-Kruger coordinate system of Xi'an 80 to Universal Transverse Mercator coordinate system on the WGS84 datum, compatible with the Global DEMs. shows the results using three different transformation methods. Values in are residual errors, indicating the difference between GCPs of the coordinate systems. While all three methods satisfy the accuracy requirements of 1:10 k mapping (State Bureau of Surveying and Mapping Citation2010), the projective transformation provides the best result.
Table 1. Accuracy assessment of spatial adjustment with three different methods.
As mentioned above, local topographic map and global DEM employ different vertical datums: Yellow Sea 1985 and EGM96. Vertical datum mismatch will introduce apparent vertical error and datum matching should be considered (Lalonde, Shortridge, and Messina Citation2010). The difference between Yellow Sea 1985 and EGM96 is about 0.35 m at the national leveling origin of Qingdao (Guo, Jiao, and Yang Citation2004; Zhai et al. Citation2011), and the value increases steadily from the east to the west, with a shift about 1.32 m at Mount Everest (Chen et al. Citation2001). According to the Survey Chorography of Zhejiang Province (Yu Citation1996) and field GPS data, the average difference between these two datums is about 0.4 m for Anji. The value of 0.4 m was added to reference DEMs, so that local elevations would match SRTM and GDEM.
3.2. Reference DEM generation
The Topo to Raster tool, based on ANUDEM 4.6.3 in the ArcGIS 10.x, is the implementation of TopoGrid from ArcInfo Workstation 7.x. It is one of the most popular DEM surface generation tools currently available and can handle large data-sets. It uses a drainage enforcement algorithm, which employs landscape features such as digitized streams to improve the structure of DEM products for hydrologic purposes. Both contour lines and drainage lines from the 1:10 k reference topographic map were used to produce the DEM. A total of 13 DEMs with different cell sizes (i.e. 5 m, 15 m, 30 m, 45 m, 60 m, 75 m, 90 m, 105 m, 120 m, 135 m, 150 m, 165 m, 180 m) were generated using the Topo to Raster tool (). Hereafter, these reference DEMs are referred to as China Elevation Data (CED).
In this study, RMSE, mean error (ME), mean absolute error (MAE), and error standard deviation (STD) were used to get a more comprehensive description of DEM accuracy. These metrics were calculated with the following equations:
3.4. DEM comparison
Two approaches, visual comparison and quantitative comparison, were used. The aim of visual comparison is to detect changes between different DEMs using shaded relief map and relative difference map, which also can be characterized using specific statistical indicators. We consider both homologous comparisons between versions of the same product and heterologous comparisons between global DEM products and the reference DEMs.
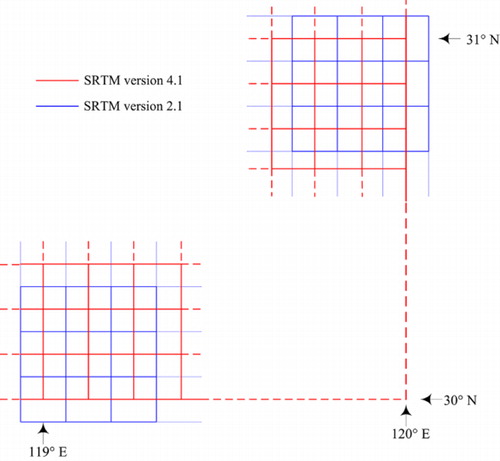
When comparing different DEMs, pixel alignment is critical. Previous studies showed that horizontal shifts, sometimes referred to asgeo-location errors or horizontal errors, can exist among global DEMs (USGS Citation2008; ASTER GDEM Validation Team Citation2009; Abrams et al. Citation2010). Such shifts might originate from erroneous georeferencing inherent in the DEM observations or can be encountered in practice by ambiguous or changing definitions of the position to which elevation refers (cell corner or center) (Hirt, Filmer, and Featherstone Citation2010). A known issue of SRTM3 is a 1/2 grid pixel shift relative to SRTM2, which has been claimed to be compensated in SRTM41 (Reuter, Nelson, and Jarvis Citation2007; Mouratidis, Briole, and Katsambalos Citation2010). However, an obvious 1/2 gridshift was observed when SRTM41 (srtm_60-06 tile) was superposed on SRTM1 and SRTM2 (N30E119 tile) (). A southeast shift was easily detected by comparing the grid values. To investigate the variation of shift direction, other tiles neighboring the srtm_60-06 tile were collected and analyzed. Results indicate that the shift is in the same direction on the same latitude, although its magnitude differs for different latitudes. To facilitate the comparisons with other DEMs, SRTM41 data were adjusted to match with SRTM1 and SRTM2 by geometric correction. According to the ASTER GDEM Validation Team (Citation2011) and Abrams et al. (Citation2010), the magnitude of horizontal shift (GDEM relative to the SRTM) was sub-pixel scale. In this study, besides the 1/2 gridshift of SRTM41, no significant horizontal shifts between the global DEMs and reference DEMs were observed in Anji. By superimposing GDEM on SRTM, it can be observed that GDEM is consistent with SRTM1 and SRTM2; one pixel of SRTM exactly corresponds to nine GDEM cells. Compared to the resolution of global DEMs, the effect of misregistration is negligible.
3.5. DEM validation
As opposed to comparisons among DEMs, validation using ground-truth data can deliver absolute accuracy estimates. Twenty thousand GTPs, collected from the 1:10 K topographic map, were used as reference points to validate both local reference DEMs and the global DEMs. Since the pixel value is often conceptualized as the height at the center of the pixel, which rarely corresponds with the location of reference points, DEM elevation was derived through bilinear interpolation of the DEM elevations at the precise location of the GTP. Error was calculated by subtracting the interpolated DEM elevation from the GTP elevation, and the accuracy of DEM was documented with summary statistics including MAE, STD, and RMSE. To be consistent with accuracy specifications of SRTM and GDEM, this study referenced the ‘5-Step’ accuracy assessment procedure, developed by National Digital Elevation Program (Osborn et al. Citation2007), to deduce accuracies at 95% and 90% confidence levels.
To quantify the impact of terrain relief and land cover on elevation error, slope and aspect raster were derived from the 30 m resolution reference DEM. A threshold slope value of 10° was used to differentiate hilly area from flat area. Slope was reclassified into 19 classes with 2.5° intervals, and aspects were reclassified into 8 classes, i.e. North (N), Northeast (NE), East (E), Southeast (SE), South (S), Southwest (SW), West (SW), and Northwest (NW). The sensitivities of the vertical accuracy to terrain relief and land-use/land-cover (LULC) were investigated by calculating errors for subsets of the data in different slope, aspect, and LULC categories.
For users of grid DEMs, the horizontal resolution may be very important for certain analysis, and the pixel size of one DEM was often regarded as its practical resolution. However, the nominal resolution (pixel size or grid spacing) of global DEM may not coincide with the actual information that it contains. Therefore, it is imperative to understand the relationship between the DEM accuracy and its corresponding resolution. In this study, the resolution of global DEM was determined by accuracy comparisons to reference DEM for which the horizontal detail was degraded until its accuracy best matched that of the global DEM (see section 4.1 and 4.4 for further information). Elevation errors were plotted and linear models were generated to relate the cell sizes of reference DEMs with different accuracy indicators ().
![Figure 5. Effect of cell size on elevation accuracy [Mean Absolute error (MAE), Error Standard Deviation (STD), Root Mean Square Error (RMSE)] of reference DEM. Accuracy values were derived from the validating results of different cell size reference DEMs using 20,000 GTPs.](/cms/asset/6a971d8b-aadc-4939-bbb5-9e0326155b0a/tjde_a_807307_f0005_b.jpg)
4. Results and discussion
4.1. Accuracy of reference DEM
In general, the vertical accuracy of a DEM is dependent upon the spatial resolution, quality of source data, collection and processing procedures, and digitizing systems. In this study, a total of 13 cell sizes (i.e. 5 m, 15 m, 30 m, 45 m, 60 m, 75 m, 90 m, 105 m, 120 m, 135 m, 150 m, 165 m, 180 m) of reference DEMs were validated using the 20,000 GTPs and statistical parameters (i. e. MAE, STD, RMSE) of elevation errors were plotted (). These plots were used to estimate the relationship between equivalent resolution and measured MAE, STD, and RMSE derived for a test DEM. For example, if the test DEM has a 15 m RMSE, then its effective resolution is about 105 m. As shown in , DEM accuracy decreased with larger cell size, consistent with other studies (Gao Citation1997; Ziadat Citation2007). Three models were generated using a linear method to relate the cell size with different accuracy indicators; the increase in error was related positively with resolution in each case, with RMSE affected more by the cell size than STD or MAE. The determination coefficient (R 2 ) of each linear model was larger than 0.99.
4.2. Changes between different versions
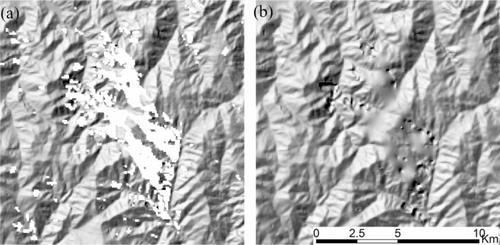
Before assessing the accuracies of these global DEMs, a relative comparison between the versions themselves was conducted. gives a summary of statistics of the elevations implied by different versions of global DEMs over Anji, and are their gray scale representations. Results show that the three versions of SRTM have the same minimum-maximum elevation value and the percentage of void pixels decreases from 1.2% (about 3035 pixels) in version 1 to zero in version 4.1. In Anji, voids of SRTM are mainly located in mountainous areas, and large areas of voids can be observed in the southern part. Visual evaluation checks were performed to test the internal consistence of filled areas of SRTM41. However, the performance of void filling is not visually impressive, since filled areas match their surroundings rather poorly ().
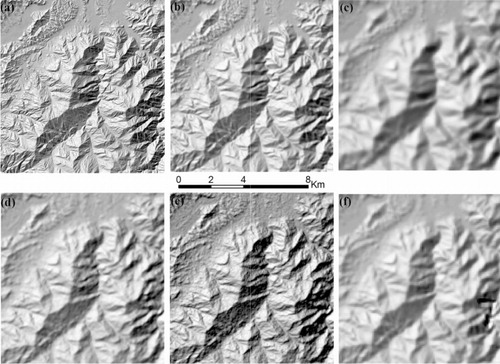
For GDEM, the maximum elevation of version 2 is about 15 m higher than that of version 1, and there is a difference of about 5.8 m between the mean elevations of these two versions (). It is expected that obvious differences may exist between these two versions. As shown in , GDEM2 shows sharper topographic features and represents finer scale topographic variation than GDEM1. In addition to the above, another dramatic change occurs over water body areas. It is clear that GDEM1 pixels inside inland water bodies are not filtered ( and ). Fujisada, Urai, and Iwasaki (Citation2012) reported that water body detection algorithm had been used to identify and mask water areas larger than 1 km2 in the production of GDEM2. However, the results of this study indicated that the water detection and masking process in GDEM2 production were not well done over Anji. Laoshikan Reservoir, which has an area of about 5.3 km2, was not detected and an obvious anomaly was found over the water area as shown in .
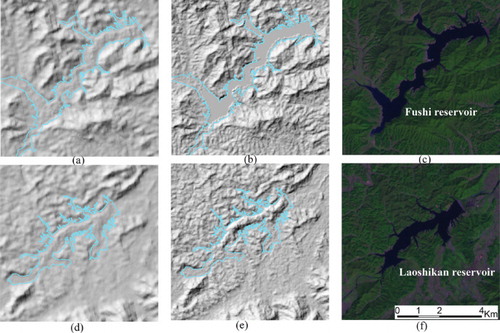
Table 2. Statistics of elevations across Anji County implied by SRTM and GDEM.
Relative pairwise comparisons were conducted by subtracting overlying pixel values of different versions; statistics are summarized in . There were remarkable similarities between the three versions of SRTM, as indicated by STDs that were smaller than 0.6 m and more than 91% of the pixels had the same value. This agrees with the findings of Mouratidis, Briole, and Katsambalos (Citation2010). Considering the inherent similarity of the SRTM products, SRTM1 and SRTM2 were not included in the following sections. GDEM1 and GDEM2 were quite different and only 3.3% of the pixels had the same value. An overall 5.9 m bias was observed between the two versions of GDEM.
Table 3. Statistics of DEM comparisons between different versions of SRTM and GDEM.
4.3. Elevation differences compared to reference DEM
Due to different grid spacing of SRTM and GDEM, CED90m and CED30m were used as base maps to evaluate the relative differences of SRTM and GDEM from reference DEM and results are shown in . Negative values indicate that mean global DEM has elevation values lower than reference DEM, while positive values indicate that global DEM is higher. For SRTM41, the average difference was 2.3 m, which indicated that elevations of SRTM41 were higher compared to reference DEM. In other words, SRTM41 overestimated elevations. For SRTM, overestimation of elevation is predictable since radar signal returns are affected by vegetation cover (Guth Citation2006; Shortridge Citation2006). Mean differences between the two versions GDEM and reference DEM are of different signs. For GDEM1, the average difference was 3.3 m, which indicated that GDEM1 had the tendency to underestimate the true elevations of the terrain. The negative bias of GDEM1 in this study agrees with the results of ASTER GDEM Validation Team (Citation2009), which generally shows a negative bias of about 5 m. Some previous studies also point to the results of underestimated elevation in GDEM1 (Hirt, Filmer, and Featherstone Citation2010; Gómez et al. Citation2012; Hvidegaard et al. Citation2012; Wang, Yang, and Yao Citation2012). While the specific source of underestimation of GDEM1 has not been documented, it is thought to be a result of orbital characteristics of the Terra spacecraft (Slater et al. Citation2011).
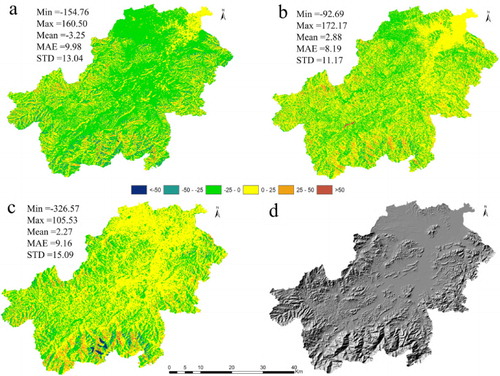
The ASTER GDEM Validation team (Citation2011) stated that the elevation bias (5 m) observed in GDEM1 was removed in GDEM2, which had a great impact on the overall mean difference of GDEM2. Indeed, this study found a mean difference value of 2.9 m. The positive bias may indicate that there is a general overestimation of GDEM2. However, an underestimation of elevation for GDEM2 was found by Mukherjee et al. (Citation2013) in Shiwalik Himalaya. In view of existing global DEM evaluation studies mainly concentrating on SRTM and GDEM1, the quality evaluation of GDEM2 requires more research.
As mentioned in section 4.2, void filling of SRTM41 and water masking of GDEM2 seem unsatisfactory. Elevation difference maps confirmed this visual impression (). About 37% of all the SRTM41 pixels with errors greater than 50 m were located over void areas. Larger discrepancies in GDEM2 could readily be detected over Laoshikan Reservoir. Performance of SRTM void filling was related to the characteristics of the auxiliary DEM. When no high resolution auxiliary DEM is available, the 30 arc-second SRTM DEM is used as the auxiliary data for void filling (CGIAR-CSI Citation2013). It is also clear that differences between global DEM and reference DEM are not geographically random, but demonstrate clear spatial patterns relative to ridges and valleys, which will be examined in the next section.
4.4. Accuracy assessment using reference data
4.4.1. Overall accuracy of global DEM
summarizes the deviation of the DEM-derived elevation values from the elevation of the corresponding reference points. GDEM1 has an ME value of 3.0 m, while GDEM2 has a value of 2.8 m and SRTM41 has a value of 1.9 m, supporting the findings in previous section that GDEM1 underestimates elevation whereas GDEM2 and SRTM41 overestimate them. The RMSE for SRTM41 was 12.4 m, and accuracy, expressed as a linear error at the 90% confidence level (LE90), was 18.8 m. The RMSE for GDEM2 was 12.8 m (compared to 14.2 m for GDEM1), and accuracy, expressed at the 95% confidence level (LE95), was 27.5 m (compared to 29.9 m for GDEM1). Both SRTM and GDEM failed to match their specified accuracies (SRTM, 16 m at 90% confidence level; GDEM2, 17 m at 95% confidence level). Several other studies have noted inaccuracies in the GDEM1 data (Hirt, Filmer, and Featherstone Citation2010; Forkuor and Maathuis Citation2012; Wang, Yang, and Yao Citation2012). It is expected that the accuracy of GDEM1 was less than the accuracy of SRTM41 and GDEM2. Results of this study revealed that SRTM41 had marginally better vertical accuracy than GDEM2 over Anji County, which was contradictory to the accuracy reported by ASTER GDEM Validation Team (Citation2011).
Table 4. Error statistics (m) of GDEM and SRTM comparison with 20,000 GTPs.
Among the typology of errors in DEMs, gross error is the most easily detected one and should be eliminated in practical applications (Lai and Shih Citation2006; Reuter, Nelson, and Jarvis Citation2007). In this study, error larger than 50 m, which was about three times of the specified accuracy (16 m) of SRTM, was defined as gross error. summarizes the proportions of elevation errors in different range and a proportion (3‰) of gross errors were detected. RMSEs of both SRTM and GDEM decreased after gross errors were omitted (). It should be noted that the decrease was less substantial in GDEM (about 0.3 m), compared to 1.44 m in SRTM. It must be acknowledged that the values, listed in and , are only overall accuracy estimates of these global DEMs. The effect of land cover and terrain relief, such as slope and aspect, must be accounted for, in order to understand how these factors influence DEM accuracy.
Table 5. Statistics of the elevation errors of GDEM and SRTM in different ranges.
Table 6. Error statistics (m) for GDEM and SRTM after omitting gross errors greater than 50 m.
4.4.2. Impact of terrain relief on elevation accuracy
Terrain relief is one of the major influencing factors on elevation accuracy of DEM. In this study, a threshold slope value of 10° was used to differentiate high relief from low relief areas. summarizes the deviation of the DEM-derived elevation values from the elevation of the corresponding reference points for rugged and level areas. Results revealed a significant decrease in accuracy of global DEM data when measurements were performed on terrain characterized by slope values greater than 10°. The average magnitude of errors (i.e. MAE, STD, and RMSE) is about two times higher in high relief areas, which also agrees with the results from previous studies (Miliaresis and Paraschou Citation2005; Gorokhovich and Voustianiouk Citation2006; Shortridge and Messina Citation2011). Of particular note are the changes of the magnitude of errors on detailed slope classes. Elevation errors were summarized over 19 slope classes with 2.5° intervals. As shown in , the magnitude of error measures (i.e. MAE, STD, and RMSE) increase sharply as slope rose from 2.5° to 15°. In relatively flat terrain (slope less than 5°), the accuracy of SRTM as well as GDEM is better than 7.5 m. For slopes larger than 15°, SRTM provides greater accuracy compared to GDEM2. It is notable to see that RMSE as well as MAE and STD values of GDEM2 and SRTM41 are similar for slopes between 7.5° and 15°. In general, DEM accuracy decreased as surface slope increased, which conforms to results from other studies (Tighe and Chamberlain Citation2009; Wang, Yang, and Yao Citation2012; Mukherjee et al. Citation2013). However, the relationship between ME and slope was not clear for both SRTM and GDEM products.
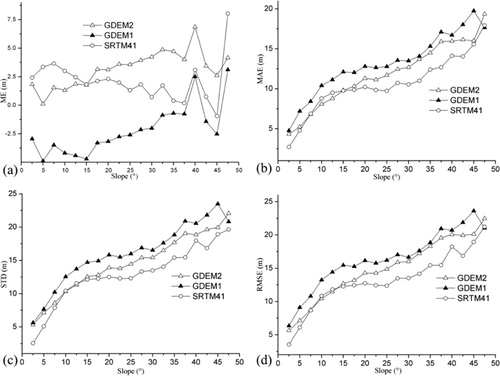
Table 7. Statistics of elevation errors (m) of GDEM and SRTM for terrain with slope values less and greater than 10°
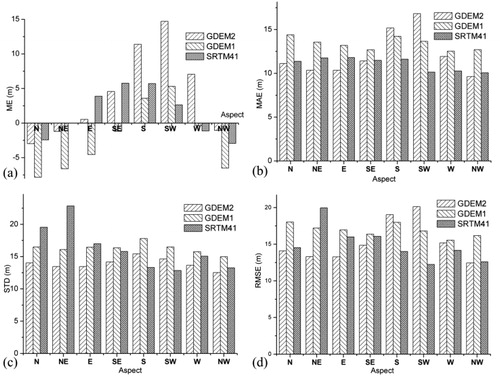
As shown in , the accuracy of global DEM appears to be heavily influenced by terrain aspect. To avoid the random impact of aspect on flat areas, a total of 8094 points with slopes less than 10° were removed from the analysis. shows the elevation difference between global DEM and valid points when the terrain is classified into eight aspect directions [i.e. North (N), Northeast (NE), East (E), Southeast (SE), South (S), Southwest (SW), West (SW), and Northwest (NW)]. A clear trend is apparent in SRTM: SRTM underestimated elevation in locations facing the North and Northwest directions, while South- and Southeast-facing directions were overestimated. It is worth noting this phenomenon also exists in GDEM. GDEM1 were underestimated on the whole, while GDEM2 witnessed substantial overestimates on South- and Southwest-facing slopes. The unusual performance of the mean error values of SRTM and GDEM over opposite aspects, which was also observed by Gorokhovich and Voustianiouk (Citation2006) and Shortridge and Messina (Citation2011), is attributable to their own methodology of DEM production. It is well known that the quality of synthetic aperture radar (SAR) images depends upon the view direction. In the view direction, foreshortening or even lay over caused by terrain inclination influences the accuracy of the generated SRTM height model. Considering GDEM elevation derived using a stereo autocorrelation algorithm, a dependency of elevation accuracy upon terrain inclination is expected. It can be concluded that the error of SRTM or GDEM is not random, but systematically related to aspect. The variations of MAE as well as STD and RMSE between different aspects were smaller than Mean errors ( and ). For GDEM1, there were minor variations over the eight aspects; for GDEM2, the highest RMSE was observed in the South and the lowest was in the Northwest; for SRTM41, the highest was in the Northeast and the lowest was in the Southwest.
4.4.3. Impact of landuse/landcover on elevation accuracy
To examine the impact of cover types on measured DEM errors, the accuracy assessment results were segmented by land cover (i.e. Croplands, Orchard, Forest, and Built-up). Summary statistics of global DEM error in each land cover category are given in . The highest STD and RMSE were observed over forests. It is obvious that DEM accuracy over forested areas was worse than non-forested areas (cropland, orchard, built-up), which was consistent with previous studies (Sefercik and Alkan Citation2009; Miliaresis and Paraschou Citation2011; Chirico et al. Citation2012). Results indicated that SRTM41 had better vertical accuracy than GDEM1 and GDEM2. But, it must be noted that the overall RMSE values of SRTM and GDEM2 for forest category are nearly identical at 14.8 m and 14.9 m. While the mean error for non-forested areas was greater than 2.6 m, the low mean error of SRTM41 for forested areas ( 1.0 m) was surprising, since higher mean errors were to be expected. Further analysis showed that forest areas were almost located at higher elevation. The relatively low mean error over forested areas can be attributed to the dependency of global DEM accuracy on terrain declination, as described in Section 4.4.2. It is clearly shown in that slopes facing South as well as Southeast correlate with obvious positive elevation error, and slopes facing North and Northwest correlate with negative error. The relatively low mean error is actually a balanced result of positive and negative offsets caused by different aspects.
Table 8. Summary statistics of elevation error *(m) with different landuse/landcover classes (i.e. Croplands, Orchard, Forest, and Built-up).
4.4.4. Estimating practical resolution of global DEM
In this study, error statistics (i.e. MAE, STD, RMSE) of SRTM and GDEM comparison with 20,000 GTPs, listed in the and , were used as variables to estimate their practical resolutions. shows the results of practical resolution of SRTM and GDEM. Resolution estimated using STD was obviously coarser than that of using MAE and RMSE. Guth (Citation2006) found that the 3-arc-second SRTM product possessed a real resolution close to the nominal one. The results of this study confirmed that conclusion. On a global scale, the quality of GDEM varies from region to region. Jacobsen and Passini (Citation2010) and Hayakawa, Oguchi, and Lin (Citation2008) reported GDEM1 was in the range corresponding to 60 m point spacing. ASTER GDEM Validation Team (Citation2011) concluded that effective spatial resolution of GDEM1 was on the order of 120 m, and GDEM2 horizontal resolution nearly matches that of SRTM 1-arc-second DEM, about 72 m. The results of this study indicated that the practical resolution of GDEM1 was not better than 100 m, whereas GDEM2 had a resolution of around 90 m.
Table 9. Practical horizontal resolutions of SRTM and GDEM estimated using linear models (). Results estimated before and after omitting gross errors, were separated by the slash character in this table.
As mentioned above, the visual performance of GDEM2 was better than GDEM1 and SRTM due to additional scenes and the smaller correlation kernel. However, ASTER GDEM validation Team (Citation2011) reported that using a smaller stereo correlation kernel to enhance horizontal resolution (high-frequency topographic ‘signal’) could also increase high-frequency noise, which was visually apparent in shaded relief image (). The horizontal resolution estimate of GDEM2 was not as expected as well. As indicated in GDEM2 validation report, the noisy signal is generally better than missing signal, and fine noise can be suppressed by filtering. As an upgrade from version 1, GDEM2 is more versatile than GDEM1 and could be used as an alternative for public users.
5. Conclusions
Taking the local 1:10 k Topographic Map as a reference, the quality of different versions of global DEM products, including 3-arc-second SRTM and 1-arc-second ASTER GDEM, were evaluated over Anji County, southeastern China. Results indicate that all models have strengths and weaknesses, and updated versions have improvements and limitations, which can be summarized as follows:
Among the three existing versions of SRTM, the latest version (version 4.1) might be preferred. It has compensated for the no-data regions (voids) and basically preserved the accuracy of original data, while non-void elevations were largely unchanged from version to version. Proportion of gross error was not high (3‰); however, 37% of gross errors were located in void areas. Performance of void filling of version 4.1 was related to the characteristics of the auxiliary DEM. Moreover, an overall 1/2pixel shift that was detected in version 3 still exists in version 4.1.
Due to additional ASTER stereo pairs and improvements in processing, significant improvements were found in GDEM version 2 compared with version 1. But, we found that water masking of version 2 was not perfect, as some extensive water bodies were undetected and contained worse terrain representations than version 1.
SRTM had a modestly higher accuracy (in term of RMSE, 12.4 m) than ASTER GDEM (Version 1, 14.2 m; Version 2, 12.7 m). Although SRTM and GDEM did not meet their accuracy specifications, the accuracy of SRTM41 and GDEM2 were comparable with the accuracy of 90 m resolution reference DEM. The horizontal resolution estimates of SRTM41 and GDEM2 were 90 m and 93 m, respectively. Local topographic properties significantly affected the accuracy of these global DEM products. DEM accuracy decreased with steeper slopes. Both the magnitude and the sign of errors were correlated with aspect, particularly for SRTM. DEM accuracy varied with land cover type, and forested areas suffered from greater error than non-forested areas.
For public users, SRTM version 4.1 could be used as the first choice, and GDEM2 would be a good alternative when extensive voids exist in SRTM.
Acknowledgements
This study was supported in part by the Natural Science Foundation of China (41240013). Pilot Technology Co., Ltd of Hangzhou supplied the Trimble 5700 GPS receiver. Yufei Wang was helpful in field data collection. The technical support from Continuously Operating Reference Stations of Zhejiang Province, China is also appreciated.
References
- Abrams, M., B. Bailey, H. Tsu, and M. Hato. 2010. “The ASTER Global DEM.” Photogrammetric Engineering and Remote Sensing 76 (4): 344–348. http://digital.ipcprintservices.com/publication/?i=34504&p=&l=&m=&ver=&pp=.
- Arabelos, D. 2000. “Intercomparisons of the Global DTMs ETOPO5, TerrainBase and JGP95E.” Physics and Chemistry of the Earth, Part A: Solid Earth and Geodesy 25 (1): 89–93. doi:10.1016/S1464-1895(00)00015-6.
- ArcGIS. 2011. “Environmental Systems Research Institute (ESRI), Inc., ArcGIS Desktop Help on Web.” Accessed April 5, 2013 http://help.arcgis.com/en/arcgisdesktop/10.0/help/index.html#/About_spatial_adjustment_transformations/001t000000tv000000/.
- ASTER GDEM Validation Team. 2009. “ASTER Global DEM Validation: Summary Report.” Accessed April 5, 2013 http://www.jspacesystems.or.jp/ersdac/GDEM/E/image/ASTERGDEM_ValidationSummaryReport_Ver1.pdf.
- ASTER GDEM Validation Team. 2011. “ASTER Global DEM Validation: Summary Report.” Accessed April 5, 2013 http://www.jspacesystems.or.jp/ersdac/GDEM/ver2Validation/Summary_GDEM2_validation_report_final.pdf.
- Carabajal, C. C., and D. J. Harding. 2006. “SRTM C-band and ICESatLaser Altimetry Elevation Comparisons as a Function of Tree Cover and Relief.” Photogrammetric Engineering and Remote Sensing 72 (3): 287–298. http://www.asprs.org/a/publications/pers/2006journal/march/2006_mar_287-298.pdf.
- CGIAR-CSI. 2013. “CGIAR Consortium for Spatial Information, 2013.” Accessed April 5, 2013 http://www.cgiar-csi.org/data/srtm-90m-digital-elevation-database-v4-1/.
- Chang, H. C., X. Li, and L. Ge. 2010. “Assessment of SRTM, ACE2 and ASTER-GDEM Using RTK-GPS.” In 15th Australasian Remote Sensing & Photogrammetry Conference, September 13–17, 271–279. Alice Springs. http://www.gmat.unsw.edu.au/snap/publications/chang_etal2010a.pdf.
- Chen, J. Y., S. Y. Pang, J. Zhang, and Q. D. Zhang. 2001. “Height of Snow Top for the Mount Everest and Global Warming.” Advance in Earth Sciences 16 (1): 12–14 ( in Chinese). http://www.cnki.com.cn/Article/CJFDTotal-DXJZ200101004.htm.
- Chen, J. Y., P. Zhang, J. L. Wu, and Q. D. Zhang. 2007. “On Chinese National Continuous OpertatingReference Station System of GNSS.” Acta Geodaetica et Cartographica Sinica 36 (4): 366–369 ( in Chinese). http://www.cnki.com.cn/Article/CJFDTotal-CHXB200704003.htm.
- Chirico, P. G., K. C. Malpeli, and S. Trimble. 2012. “Evaluation of an ASTER-Derived Global Digital Elevation Model (GDEM) Version 1 and Version 2 for Two Sites in Western Africa.” GIScience& Remote Sensing 49 (6): 775–801. doi:10.2747/1548-1603.49.6.775.
- Dang, Y. M., Y. Y. Cheng, and S. Q. Xue. 2010. “Geodetic Coordinate Systems and Their Applications.” Surveying Press of China, Beijing. 133–189 ( in Chinese).
- Editor Board of Anji Water Chorography. 2005. “Water Chorography of Anji County.” ChroniclesPress of China, Beijing October 2005, 68–75 ( in Chinese).
- Farr, T. G., P. A. Rosen, E. Caro, R. Crippen, R. Duren, S. Hensley, M. Kobrick et al. 2007. “The Shuttle Radar Topography Mission.” Reviews of Geophysics 45 (2): 1–33. doi:10.1029/2005RG000183.
- Forkuor, G., and B. Maathuis. 2012. “Comparison of SRTM and ASTER Derived Digital Elevation Models Over Two Regions in Ghana – Implications for Hydrological and Environmental Modeling.” In Studies on Environmental and Applied Geomorphology, edited by T. Piacentini and E. Miccadei, 219–240. Rijeka: InTech.
- Fujisada, H., M. Urai, and A. Iwasaki. 2012. “Technical Methodology for ASTER Global DEM.” Geoscience and Remote Sensing, IEEE Transactions 50 (10): 3725–3736. doi:10.1109/TGRS.2012.2187300.
- Gao, J. 1997. “Resolution and Accuracy of Terrain Representation by Grid DEMs at a Micro-scale.” International Journal of Geographical Information Science 11 (2): 199–212. doi:10.1080/136588197242464.
- Gómez, M. F., J. D. Lencinas, A. Siebert, and G. M. Díaz. 2012. “Accuracy Assessment of ASTER and SRTM DEMs: A Case Study in Andean Patagonia.” GIScience& Remote Sensing 49 (1): 71–91. doi:10.2747/1548-1603.49.1.71.
- Gorokhovich, Y., and A. Voustianiouk. 2006. “Accuracy Assessment of the Processed SRTM-based Elevation Data by CGIAR Using Field Data from USA and Thailand and Its Relation to the Terrain Characteristics. Remote Sensing of Environment 104 (4): 409–415. doi:10.1016/j.rse.2006.05.012.
- Guo, H. R., W. H. Jiao, and Y. X. Yang. 2004. “The Systematic Difference and Its Distribution Between the 1985 National Height Datum and the Global Quasigeoid.” Acta Geodaetica Et Cartographica Snica 33 (2): 100–104. (In Chinese). http://d.wanfangdata.com.cn/Periodical_chxb200402002.aspx.
- Guth, P. L. 2006. “Geomorphometry from SRTM: Comparison to NED.” Photogrammetric Engineering and Remote sensing 72 (3): 269–277. http://www.asprs.org/a/publications/pers/2006journal/march/2006_mar_269-277.pdf.
- Hayakawa, Y. S., T. Oguchi, and Z. Lin. 2008. “Comparison of New and Existing Global Digital Elevation Models: ASTER G-DEM and SRTM-3.” Geophysical Research Letters 35 (17): L17404. doi:10.1029/2008GL035036.
- Hilton, R. D., W. E. Featherstone, P. A. M. Berry, C. P. D. Johnson, and J. F. Kirby. 2003. “Comparison of Digital Elevation Models Over Australia and External Validation Using ERS-1 Satellite Radar Altimetry.” Australian Journal of Earth Sciences 50 (2): 157–168. doi:10.1046/j.1440-0952.2003.00982.x.
- Hirt, C., M. S. Filmer, and W. E. Featherstone. 2010. “Comparison and Validation of the Recent Freely Available ASTER-GDEM Ver1, SRTM Ver4. 1 and GEODATA DEM-9S Ver3 Digital Elevation Models Over Australia.” Australian Journal of Earth Sciences 57 (3): 337–347. doi:10.1080/08120091003677553.
- Hvidegaard, S. M., L. S. Sorensen, and R. Forsberg. 2012. “ASTER GDEM Validation Using LiDARData OverCoastal Regions of Greenland.” Remote Sensing Letters 3 (1): 85–91. doi:10.1080/01431161.2010.527389.
- Jacobsen, K. 2010. “Comparison of ASTER GDEMs with SRTM Height Models. EARSeL Symposium Dubrovnik Remote Sensing for Science.” Education and Natural and Cultural Heritage 521–526. http://www.earsel.org/symposia/2010-symposium-Paris/Proceedings/EARSeL-Symposium-2010_12-06.pdf.
- Jacobsen, K., and R. Passini. 2010. Analysis of ASTER GDEM Elevation Models, In IntArchPhRS vol. XXXVIII, part 1, Calgary, 2010, 6 S., (on CD-ROM).
- Knippers, R. A., and J. Hendrikse. 2000. “Coordinate transformation KartografischTijdschrift.” Accessed April 5, 2013 http://kartoweb.itc.nl/geometrics/Publications/KT20003CoordtransUK.pdf/.
- Lai, Z. M., and T. Y. Shih. 2006. “Comparison of DEM Acquired by SRTM and TopSAR.” Journal of Photogrammetry and Remote Sensing 11 (4): 447–459 ( in Chinese). http://jprs.geomatics.ncku.edu.tw/articlePDF/200612-11-4-447-459.pdf.
- Lalonde, T., A. Shortridge, and J. Messina. 2010. “The Influence of Land Cover on Shuttle Radar Topography Mission (SRTM) Elevations in Low-relief Areas.” Transactions in GIS 14 (4): 461–479. doi:10.1111/j.1467-9671.2010.01217.x.
- Lin, S., C. Jing, N. A. Coles, V. Chaplot, N. J. Moore, and J. Wu. 2012. “Evaluating DEM Source and Resolution Uncertainties in the Soil and Water Assessment Tool.” Stochastic Environmental Research and Risk Assessment 27 (1): 209–221. doi:10.1007/s00477-012-0577-x.
- Ma, J. P., X. W. Gao, P. F. Cheng, Y. T. Yang, Y. S. Hu. 2008. “Technical Designs and Tests of Zhejiang CORS.” Science of Surveying and Mapping 33 (5): 132–134 ( in Chinese). http://www.cnki.com.cn/Article/CJFDTotal-CHKD200805046.htm.
- Miliaresis, G. Ch., and C. V. E. Paraschou. 2005. “Vertical Accuracy of the SRTM DTED Level 1 of Crete.” International Journal of Applied Earth Observation and Geoinformation 7 (1): 49–59. doi:10.1016/j.jag.2004.12.001.
- Miliaresis, G. Ch., and C. V. E. Paraschou. 2011. “An Evaluation of the Accuracy of the ASTER GDEM and the Role of Stack Number: A Case Study of Nisiros Island, Greece.” Remote Sensing Letters 2 (2): 127–135. doi:10.1080/01431161.2010.503667.
- Mouratidis, A., P. Briole, and K. Katsambalos. 2010. “SRTM 3″ DEM (Versions 1, 2, 3, 4) Validation by Means of Extensive Kinematic GPS Measurements: A Case Study from North Greece.” International Journal of Remote Sensing 31 (23): 6205–6222. doi:10.1080/01431160903401403.
- Mukherjee, S., P. K. Joshi, S. Mukherjee, A. Ghosh, R. D. Garg, and A. Mukhopadhyay. 2013. Evaluation of Vertical Accuracy of Open Source Digital Elevation Model (DEM).” International Journal of Applied Earth Observation and Geoinformation 21, 205–217. doi:10.1016/j.jag.2012.09.004.
- Osborn, K., J. List, D. Gesch, J. Crowe, G. Merrill, E. Constance, J. Mauck, C. Lund, V. Caruso, and J. Kosovich. 2007. “National Digital Elevation Program (NDEP).” In 2007 Digital Elevation Model Technologies and Applications: The DEM User Manual, edited by D. F. Maune, 83–120. Bethesda, ML: American Society for Photogrammetry and Remote Sensing. ISBN: 1-57083-082-7.
- Pierce, L., J. Kellndorfer, W. Walker, and O. Barros. 2006. “Evaluation of the Horizontal Resolution of SRTM Elevation Data.” Photogrammetric Engineering and Remote Sensing 72 (11): 1235–1244. http://www.asprs.org/a/publications/pers/2006journal/november/2006_nov_1235-1244.pdf.
- Reuter, H. I., A. Nelson, and A. Jarvis. 2007. “An Evaluation of Void-filling Interpolation Methods for SRTM Data.” International Journal of Geographical Information Science 21 (9): 983–1008. doi:10.1080/13658810601169899.
- Sefercik, U. G., and M. Alkan. 2009. “Advanced Analysis of Differences between C and X Bands Using SRTM Data for Mountainous Topography.” Journal of the Indian Society of Remote Sensing 37 (3): 335–349. doi:10.1007/s12524-009-0044-4.
- Shortridge, A. 2006. “Shuttle Radar Topography Mission Elevation Data Error and Its Relationship to Land Cover.” Cartography and Geographic Information Science 33 (1): 65–75. doi:10.1559/152304006777323172.
- Shortridge, A., and J. Messina. 2011. “Spatial Structure and Landscape Associations of SRTM Error.” Remote Sensing of Environment 115 (6): 1576–1587. doi:10.1016/j.rse.2011.02.017.
- Slater, J. A., B. Heady, G. Kroenung, W. Curtis, J. Haase, D. Hoegemann, C. Shockley, and K. Tracy. 2011. “Global Assessment of the New ASTER Global Digital Elevation Model.” Photogrammetric Engineering and Remote sensing 77 (4): 335–349. http://digital.ipcprintservices.com/publication/?i=64759&p=&l=&m=&ver=&pp=.
- Smith, B., and D. Sandwell. 2003. “Accuracy and Resolution of Shuttle Radar Topography Mission Data.” Geophysical Research Letters 30 (9)10.1029/2002GL016643.
- State Bureau of Surveying and Mapping. 2010. “Revision Specifications for Digital Products of 1:5000, 1:10 000 Fundamental Geographic Information.” CH/T9006–2010 (in Chinese).
- Sun, G., K. J. Ranson, V. I. Kharuk, K. Kovacs. 2003. “Validation of Surface Height from Shuttle Radar Topography Mission Using Shuttle Laser Altimeter.” Remote Sensing of Environment 88 (4): 401–411. doi:10.1016/j.rse.2003.09.001.
- Tighe, M. L., and D. Chamberlain. 2009. “Accuracy Comparison of the SRTM, ASTER, NED, NEXTMAP® USA Digital Terrain Model over Several USA Study Sites.” In Proceedings of ASPRS/MAPPS 2009 Fall Conference, November 16–19. San Antonia. http://www.asprs.org/a/publications/proceedings/sanantonio09/Tighe_2.pdf.
- United States Geological Survey (USGS). 2008. “SRTM-NED Vertical Differencing.” Accessed April 5, 2013. http://topochange.cr.usgs.gov/vertical.php.
- Wang, W., X. Yang, and T. Yao. 2012. “Evaluation of ASTER GDEM and SRTM and Their Suitability in Hydraulic Modelling of a Glacial Lake Outburst Flood in Southeast Tibet.” Hydrological Processes 26 (2): 213–225. doi:10.1002/hyp.8127.
- Werner, M. 2001. “Shuttle Radar Topography Mission (SRTM), Mission Overview.” Journal of Telecommunication 55, 75–79. doi:10.1515/FREQ.2001.55.3-4.75.
- Yu, L. N. 1996. “Surveying Chorography of Zhejiang Province.” Book Press of China, Beijing, February 1996, 120–122 ( in Chinese).
- Zhai, Z. H., Z. Q. Wei, F. M. Wu, and H. F. Ren. 2011. “Computation of Vertical Deviation of Chinese Height Datum from Geoid by Using EGM2008 Model.” Journal of Geodesy and Gedoynamics 31 (4): 116–118 ( in Chinese). doi:10.3969/j.issn.1671-5942.2011.04.026.
- Ziadat, F. M. 2007. “Effect of Contour Intervals and Grid Cell Size on the Accuracy of DEMs and Slope Derivatives.” Transactions in GIS 11 (1): 67–81. doi:10.1111/j.1467-9671.2007.01033.x.