
Abstract
Communications network damage resulting from a large disaster causes difficulties in the ability to rapidly understand the current situation and thus make appropriate decisions towards mitigating problems, such as where to send and dispense emergency supplies. The research outlined in this paper focuses on the rapid construction of a network after a disaster occurs. This study suggests ZigBee and geographic information systems (GIS) technologies to resolve these problems and provide an effective communication system. The experimental results of the ZigBee network system are presented, examples are provided of the mapping and analysis undertaken using GIS for the disaster-stricken area of Tsukuba City, Japan, and the communications node arrangements are determined for this region. These results demonstrate the effectiveness of establishing such a communications system for supporting efforts to relieve disaster-damaged areas.
1. Introduction
Communications network damage resulting from a large disaster causes immense difficulty in rapidly gaining an understanding of the situation, in order to adequately determine the extent of disaster effects and manage the appropriate distribution of emergency supplies (Sato 2004; Sugita et al. Citation2003). Additionally, it prevents access to digital earth and related online technologies and data which are increasingly essential to disaster response and recovery (Goodchild Citation2007; Goodchild and Glennon Citation2010). Access to the Internet and mobile technologies is important for deriving location and geolocating objects and processes in geographic space (Veenendaal, Delfos, and Tan et al. Citation2011). Geolocating victims, relief workers, emergency services and supplies, temporary and permanent evacuation centres, and control centres is crucial for a disaster situation. One such recent example is the Great Eastern Japan Earthquake (Kato, Asuma, and Hirakawa Citation2011), where victims could not get information through because the telecommunications network was disabled (Kanayama and Tokumoto Citation2011). Twitter and Ushahidi provide something akin to this in both efficiency and methods for displaying web mapping after the Great Eastern Japan Earthquake, including conditions of water and electricity outage, road blockages and conditions, provision of goods and services, and so on. (Kanayama and Tokumoto Citation2011). Nonetheless, a key premise of the web mapping system of Twitter and Ushahidi involves construction using a mobile multimedia communications network. To address such a problem, this research focuses on the rapid construction of a temporary communications network within a disaster area. shows the overall architecture of the proposed solution. The network demanded in a disaster-damaged area must be capable of providing communications between control centres, the places of safety such as evacuation centres and damage investigators. Control centres are in turn capable of communicating with the investigators and the evacuation centres. To respond to these demands, control centres need a data server system. The wireless network system itself is realised on the data transmission, while the terminal equipment communicates interactively with the control centres. The details of elements are illustrated in and how they work is described in Section 3.
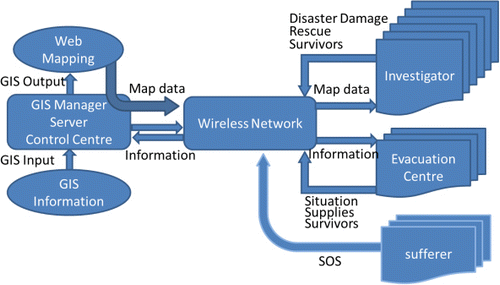
The server system in the control centre needs to efficiently provide information and collect, sort and manage this information by use of the terminal equipment. Using the information that the server has, the control centres can understand the situation across the various stages of a disaster from occurrence to response. This includes the use of geographic information analysis and methods to determine the location of the wireless network. The wireless network system needs to function as the replacement when an existing system is not functional after a disaster. Considering the geographic relations between control centre and evacuation centres, wide area wireless network systems are required. For example, after the Great Eastern Japan Earthquake, the control centre and the evacuation centre (Takezono) in Tsukuba City were 5 km apart. Although there are many methods of constructing wireless communication networks, wide area network systems that can be constructed rapidly are limited. In this research, the ZigBee protocol specification based on the IEEE 802.15.4 standard (Kinny Citation2003) for wireless personal area networks was adopted for the communication method.
As a major premise of this study, terminal equipment, such as cell phones carried by the investigators and terminal equipment established at evacuation centres must have access to the wireless network system. Furthermore, one terminal that is present in a secure location is required to extend the wireless network by linking in to an external network, such as the Internet or an adjoining network system.
This study proposes a system that meets these requirements using ZigBee and geographic information systems (GIS) technologies. Firstly, an overview of the ZigBee wireless network system is presented and the details are explained along with the processes involved in the practical uses of this system. The following section provides the experimental results of the ZigBee network system, the examples of the GIS analysis undertaken for Tsukuba City as a stricken area, and the determination of the ZigBee network node configurations. These results indicate the effectiveness of the communications system for supporting disaster damaged areas.
2. ZigBee network
The ZigBee module, referred to as GeoSense (Nakahata and Kawamura Citation2010; Wang and Kawamura Citation2011), was developed in the Geo-Sensing Laboratory at the University of Tsukuba in collaboration with HITACHI Corporation (). In recent years, ZigBee has come to be regarded as one of the communication standards in wireless sensor networks (Yuksel, Nielson, and Nielson Citation2011); for instance ZigBee modules are sold by several companies such as NEC corporation, HITACHI, and TOKYO COSMOS ELECTRIC CO., LTD. It is primarily used for measurement and control. provides comparisons with other wireless communication standards (Nakahata and Kawamura Citation2010; Wang and Kawamura Citation2011). According to the information in this table, ZigBee is appropriate for various situations related to, for example, home, building and industrial automation. ZigBee is also used for a range of applications such as automatic metre-reading systems, security systems, and remote controls.
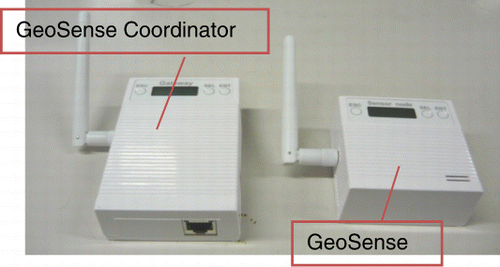
Table 1. Comparison with other wireless communication standards.
There are several reasons for considering ZigBee. ZigBee is characterised by a large network capacity and a multi-hop function for transmitting data via repeaters when the sending terminal cannot directly transmit the data to the receiving terminal. In order to communicate with the terminals, the sending terminal transmits to the nearby receiving terminal, so the transmission power can be reduced. Moreover, if the network capacity is large, a large number of terminals can be configured as one wireless network. By selecting two or more forwarding routes on the ZigBee network, data can be transmitted reliably. In addition, because of this benefit, a mesh network can be constructed. Moreover, since ZigBee designs the networks for automatic operation, easy maintenance is possible. Thus, as a means of constructing a simple wide area network, ZigBee has many advantages. Consequently, we adopted ZigBee for our study.
3. Emergency management system with ZigBee and GIS
3.1. Construct the ZigBee network
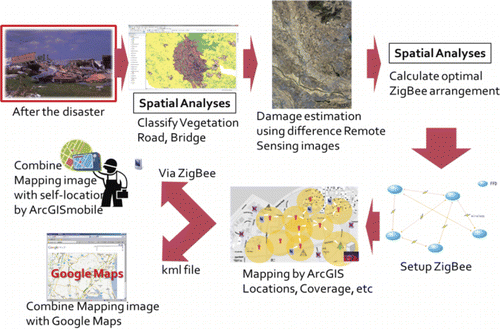
This section explains the construction method and the process of constructing the system after a disaster. shows the proposed system and process used. Processes illustrated in are explained from this point forward. After a disaster occurs, the control centre and the evacuation centres are set up. In the control centre, the server is set up and digital maps are collected and analysed. Then, the digital map information is refreshed according to the state of the disaster damage obtained through remotely sensed imagery (Sawada, Yagi, and Hayashi Citation2005; Xu et al. Citation2006). These data are spatially analysed to determine the optimal arrangement of ZigBee nodes. The optimal configuration identifies the minimum number of ZigBee nodes needed to ensure that communications span the control centre, the evacuation centre, and the region of damage. To determine the optimal arrangement for coverage, the size of the disaster-affected area, the communication distances of ZigBee, attenuation by vegetation and water, diffraction attenuation against structures, increase of communication distance with a road paved with asphalt, and derivation of an optimised solution using geocomputational methods are all necessary. First, the optimal arrangement for the ZigBee node is determined and the nodes are set up for a given disaster area. Each ZigBee node has an on-board GPS and each installation location can be verified by using the information from the on-board GPS. The wireless network is initialised after installing the ZigBee nodes. The geographic location of each node is returned from the wireless network and a server will manage the wireless network including the nodes at the newly installed locations. ArcGIS, being the GIS used in this study, is then used to obtain a coverage map that represents the area covered by the ZigBee network. This GIS engine is running on the server side. Input data for this server-side system are the base map, some map information for thematic maps such as information on vegetation and water areas, a satellite image after the disaster and information from evacuation centres and investigators. The coverage map (output) has the map information, vegetation, buildings and rivers, etc. The investigators who are able to enter the disaster zone and investigate the situation are able to communicate with the ZigBee network. Base maps and thematic maps are especially important since they serve as the base for the investigators’ surveillance activity. Actual techniques to prepare base maps and thematic maps are described in following Section 4.2. In addition, the maps can easily be converted to a Keyhole Markup Language (KML) file and put to practical use for web mapping using the digital earth applications of Google Maps and Google Earth. Sharing these data with the control centre and investigators, would increase the functionality and visualisation capabilities of the digital earth platforms such as Google Earth. This involves many techniques of web mapping and continues to be developed by various developers. Hence, it should support the needs of users, both mobile and at the centres.
3.2. How it works
shows how the proposed system works. Information is first exchanged between the investigators and a control centre (the middle of ), between the evacuation centres and a control centre, and between the victims and the investigators.
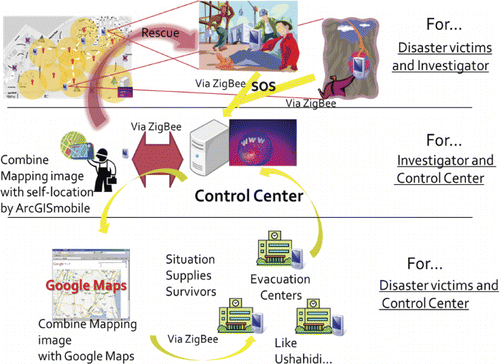
3.2.1. Investigator and control centre
By overlaying the self-location and coverage map sent from a control centre via ZigBee network, the investigators can efficiently recognise the areas where they can communicate via the ZigBee network. The investigators forward the information regarding the disaster conditions, victims, and survivors to the control centre from within the ZigBee communications area by text communication. Using this information, the control centre can consolidate the current status and management of the situation in the disaster area manually. The communication terminal equipment carried by the investigators has a ZigBee communication module and a GPS module; it must also display the coverage map using ArcGIS mobile or other specialised software. This research utilised an Android mobile phone for which ZigBee module apps are expected to be available in the market within several years. Indeed, KDDI CORPORATION demonstrated a system that links mobile phones and a ZigBee module. This communication terminal equipment is very easy to embed in the proposed system and these mobile phones definitely have GPS modules.
3.2.2. Evacuation centre and control centre
From the evacuation centres, the communication terminal equipment is set up and sends information regarding the conditions of the evacuation centres, the sufficiency of supplies, the survivors, etc., to the control centre generally by text communication because of its low transmission rate (256 kbps). The control centre collects and sorts this information for use in managing the individual situations manually. In addition, the control centre sends the information gathered from the investigators to the evacuation centres, as well as announcements needed in evacuation centres.
3.2.3. Victim and investigator
As previously stated, there is a high likelihood of the general public eventually using ZigBee communication technology in their cellular phones. In the case of a disaster, if a victim (for example, a person needs to be helped because of injury) has one of these mobile devices (mentioned in Section 3.2.1) and is in the ZigBee coverage area, he can send an SOS to the control centre. Generally, sent messages from each node reach the ZigBee network coordinator (that is, the control centre) automatically in the ZigBee communication system. In addition, by examining the communication pathway of the outgoing signal using the trilateration method based on the received signal strength indicator (RSSI), the location of the signal transmission can be approximated (Mardeni and Nizam Citation2010). The investigators at the control centre can then initiate a rescue operation.
3.3. WEB mapping
Online digital earth mapping tools and data, such as Google Maps, provide a relatively easy-to-use interface for information terminals in evacuation centres (Goodchild Citation2007). The important thing here is nobody can access the Internet just after the disaster. So, this system uses only the interface of online digital earth mapping tools (these would be pseudo online digital earth mapping tools) because by entering information into a geographic map, personnel are able to use this system immediately with little training and a short learning curve. Since there are situations when the Internet will not be available at all times in all of the evacuation centres, this system will use locally stored imagery and information about the disaster area on an intranet within the ZigBee network. However, if the control centre is able to establish a new connection to an external network, say with satellite-based or other communications, access to and dissemination of information can be broadened and shared worldwide. Easy migration is one of the advantages of using pseudo online digital earth mapping tools. Twitter and Ushahidi provide something akin to this in both efficiency and methods for displaying web mapping after the Great Eastern Japan Earthquake, including water and electricity outages, road blockages and conditions, provision of goods and services, etc. (Kanayama and Tokumoto Citation2011). Nonetheless, there were some serious problems in the Twitter system, which can be used indiscriminately by any number of anonymous persons. The major problem was the information flood resulting from casual use after the earthquake (Oda Citation2011). Furthermore, a key premise of the web mapping system of Twitter and Ushahidi involves construction using a mobile multimedia communications network. In contrast, our proposed management system adapts an ad hoc wireless network system, which can both send and hold information in common with the ZigBee communications network. That immediate network system can eliminate low-trust information from this network system, and this system will thus be an innovative support system for affected areas.
4. Method of constructing the ZigBee network for disaster damaged area
This paper is a concept paper for proposed system. In this section, the attenuation characteristics of ZigBee radio field intensity, investigated by actual experiment, together with how the GIS database actually works, are shown as an example. The significance of this proposed system is in the ability to construct the ZigBee network for use in disaster-damaged areas. The essence of this research is not only in the selection and determination of the ZigBee module, but also in the consideration of the node arrangement. Achieving an optimal ZigBee node arrangement starts with transforming the digital map of the disaster-damaged area. Use of the soft-computing-based optimisation such as NN or GA (Shin, Chin, and Kim Citation2006; Zhao et al. Citation2004) is essential for efficient node configuration. The use of geo-computing methods such as buffering requires determination of the attenuation characteristics of the wireless radio wave's intensity of ZigBee (2.4 GHz) with respect to the communication environment in geographic space.
This section explains the peculiarity of attenuation according to the circumstances of the ZigBee radio field intensity, the GIS techniques for developing a base map, and some examples of the network node arrangements. The study area used for node arrangements is Tsukuba City including the University of Tsukuba.
4.1. Attenuation of ZigBee radio field intensity
Evidently, because ZigBee communication depends on a 2.4 GHz electro-magnetic wave, its communications range varies widely according to geographic conditions. Specifically, substances such as water and vegetation significantly influence attenuation. In contrast, asphalt roads are one characteristic that increases the communications distance. This section outlines the results of using GeoSense to measure attenuation that occurred through various conditions. The ability to determine the range of GeoSense communications is vital for the arrangement of terminal equipment in damage-affected areas. If the distance between the nodes is too far, the line of communication is knocked out, thereby isolated part of the network. On the other hand, if the distance between each node is too close, then large amounts of terminal equipment must be obtained, resulting in unnecessary additional costs and labour. Therefore, the verification of the communications and the variability of the signal intensities according to the environmental conditions were studied.
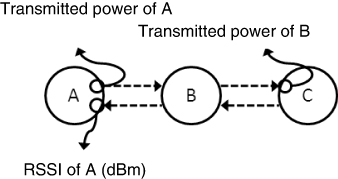
The GeoSense communications range is measured by the intensity of the communications between terminal equipment by actual experiment. The intensity of communication is the RSSI. Originally, used primarily for the control of sending in wireless network systems, RSSI is similar in concept to a wireless Local Area Network (LAN) or Bluetooth. Using this system, wireless network equipment can be used to operate and control both the generation of power and power savings. Calculating the basic value of 1 MW as 0 dBm, this RSSI is a relative value in receiving. The transmission power is also represented as dBm using Equation (1). shows the conceptual diagram between transmitted power and RSSI. Arrows represent the conditions that the command is sending.
The RSSI measurement experiment was completed in the field at the campus and a practice forest of the University of Tsukuba. To evaluate the two categories, the inspection of the range can be communicated along with the variation in communication intensity according to the changeable situations for GeoSense. shows the experimental setup for measuring the RSSI. One GeoSense Coordinator and two GeoSense modules were used in the construction of the wireless network in this test. GeoSense has a function to measure and keep tabs on RSSIs that are close to each other, so this RSSI was retained. Initially, one GeoSense terminal was set up.
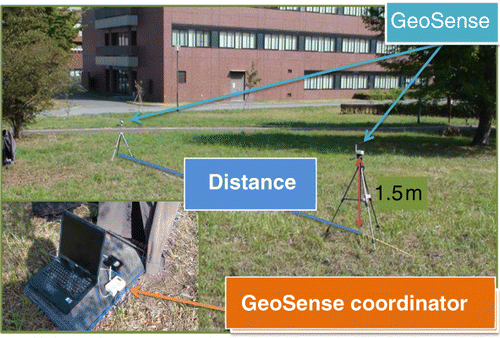
The setup method involved, firstly, mounting the GeoSense terminal on a tripod 1.5 m above ground level. Then, the RSSI was measured for a distance of 10 m and then at all 10 m intervals to a maximum distance of 100 m. The experiments were done four times – changing the location or conditions each time. The first experiment at Point 1 was to investigate the communication range without masking. Point 2 was determined to confirm whether the range of communication was comparatively reduced due to water. Points 3 and 4 were used to investigate the influences of sloping ground and rainfall. In summary, the four experiments were:
Weather is clear, level ground, and no masking.
Weather is clear, level ground, and near the river.
Weather is clear, sloping ground and in the forest.
Same location as Point 3 except under rainy conditions.
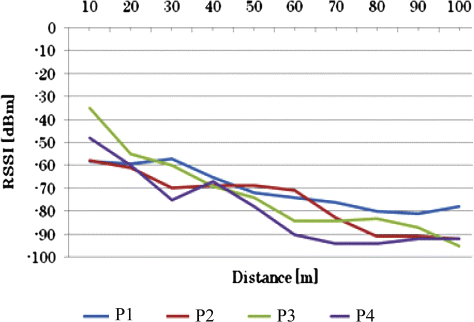
As a result, the communication range of the asphalt street has a coefficient set to 1.0. This coefficient is equal to 0.3 on the green level ground (agricultural area), it is equal to 0.25 near water, and it is equal to 0.2 in the forest area. Although the basic communication distance will change depending on the antenna, transmission power, and type of products, these trends and attenuation coefficients will not change. Determining the condition of the vegetation, the streets and the water in a disaster-damaged area facilitates optimising the ZigBee node configuration and drawing the coverage map for communication based on these attenuation coefficients.
4.2. Developing the GIS database
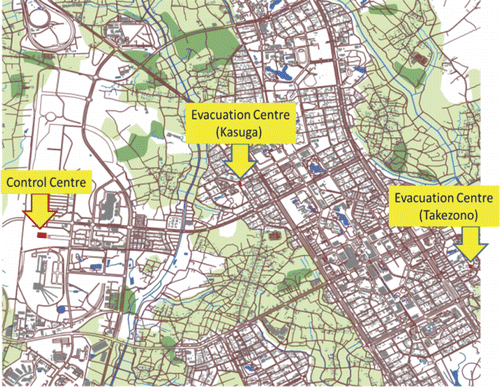
A GIS database was developed for Tsukuba City using ArcGIS to provide a foundation for mapping the communications network coverage area and to be able to view and evaluate the parameters affecting network establishment and operation. Basic thematic maps can then be derived for distribution via the network and use in emergency operations on the ground. The vegetation (forest and agricultural areas) related to radio wave attenuation, the existence of water areas (rivers, lakes, etc.), road systems and structures, are all overlaid based on the base map (1:2500) published by the Geospatial Information Authority of Japan (). The light green represents the agricultural areas, the dark green is the forested areas, the blue is water, and the brown is asphalt streets. The extent of Tsukuba City is the area drawn by meshed roads and water lines. There are 210,000 people in Tsukuba City, but the agricultural area spreads away from the centre of the city. Mount Tsukuba is to the northeast of the city and forest areas are seen around the region. The pink shades represent the densely populated urban area.
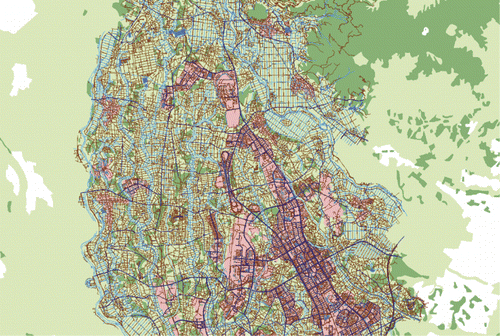
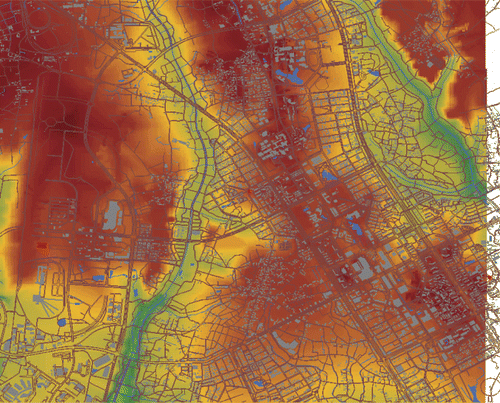
shows a thematic map. The control centre and two evacuation centres put in place after the great Tohoku earthquake are displayed. In the densely populated area, the pink is changed to white in this case. Visualising the condition of the vegetation, the streets, and the water in a disaster-damaged area facilitates optimising the ZigBee node configuration and drawing the coverage map for communication based on these attenuation coefficients. depicts the same area with the digital elevation model (DEM) added. The elevation difference in the centre of Tsukuba City is very small, and so there was no need to consider the DEM map in this case. However, in cases where the geographic region comprises large elevation differences, the DEM needs to be considered because line-of-sight influences the range of ZigBee communications
4.3. Example of the ZigBee node configuration
This section describes how the proposed system was installed in a real disaster-damaged area. The radio wave attenuation coefficients related to the environmental factors (refer to Section 4.1) are used to determine the optimal arrangement of the ZigBee nodes in the disaster-damaged area. The requirement is to construct a wireless network that covers the control centre and all evacuation centres with the minimum number of nodes.
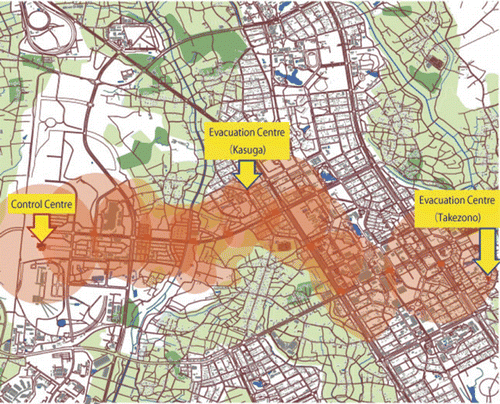
shows the configuration determined for the ZigBee wireless network nodes to connect with the control centre and evacuation centres in the study area. Soft computing-based optimisation methods such as NN or GA were not used for the optimal arrangement of nodes in this case. Instead, the nodes were placed along asphalt streets using the experiment results obtained in Section 4.1. As a result, the node configuration is not optimal. Up to now, the general experiments of performance evaluation and attenuation rate affected by vegetation were carried out using GeoSense, but it is difficult to cover the entire disaster area with GeoSense. Therefore, the TOCOS Wireless Engine (TWE), manufactured by the TOKYO COSMOS ELECTRIC CO., LTD. was recently adopted. These state-of-the-art ZigBee devices make it possible to communicate over 600 m. In this section, the performance of the TWE was adapted to estimate communication coverage. Although the maximum communication distance of the TWE is different from that of the GeoSense, the attenuation rate leverages the results obtained in the previous section. This result demonstrates that the 10 nodes can cover almost 6 km2 in such situations. However, with potentially greater variation in conditions in disaster-damaged regions, it is important that optimisation requirements be more closely analysed and determined. For example, regions along a coastline or river include the possibility of increased water coverage due to flooding, and mountainous regions with large differences in altitude may comprise more pockets of vegetation among built-up areas and meandering roads that are out of line-of-sight. These conditions will affect communication ranges and hence, further research is required to determine the optimal placement of network nodes.
5. Conclusions
This research investigated a wireless network system that can solve some of the problems caused when public wireless network systems are damaged and communications rendered inoperable due to large disasters. The study also included the method of constructing and managing such a system. The goal of this research is to construct a system capable of rapidly responding to the extent of damage after a disaster and ensuring adequate communications is in place within the region to be able to support emergency and recovery operations. ZigBee communication technology is adopted to rapidly construct a wireless network system within disaster-damaged areas, and then to quickly and efficiently provide coverage to the area. The usefulness of GIS for determining and managing the configuration of network nodes is also demonstrated. The wireless network system is constructed to provide communications between investigators, evacuation centres, and victims. Environmental conditions within the disaster-affected region influence the number and placement of communication nodes. Several initial experiments indicate the effects of some conditions involving level ground, forests and rain, but further research will need to investigate a broader range of conditions within potentially affected areas. This research has identified the components of such a proposed communications system and demonstrated its ability to successfully operate within some specified conditions.
References
- Goodchild, M. F.2007. “Citizens as Sensors: The World of Volunteered Geography.” GeoJournal 69 (4): 211–221. doi:10.1007/s10708-007-9111-y
- Goodchild, M. F., and J. A. Glennon. 2010. “Crowdsourcing Geographic Information for Disaster Response: A Research Frontier.” International Journal of Digital Earth 3 (3): 231–241. doi:10.1080/17538941003759255
- Kanayama, T., and R. Tokumoto. 2011. Report of the Great Eastern Japan Earthquake. Report of NKSJ-RM, Issue 52: 1–11. Tokyo: NKSJ.
- Kato, Y., T. Asuma, and R. Hirakawa. 2011. Report of the Great Eastern Japan Earthquake. Report of NKSJ-RM, Issue 47: 1–13. Tokyo: NKSJ.
- Kinney, P. 2003. “ZigBee Technology: Wireless Control that Simply Works.” In Communications Design Conference, 1–20.
- Mardeni, R., and O. Nizam. 2010. “Node Positioning in ZigBee Network Using Trilateration Method Based on the Received Signal Strength Indicator (RSSI).” European Journal of Scientific Research 46 (1): 48–61. http://www.europeanjournalofscientificresearch.com/.
- Nakahata, Y., and Y. Kawamura. 2010. “Development of the Landslide Observation System Using ZigBee.” In Proceedings of SICE Annual Conference 2010, 1191–1195. CD-ROM (TC10.02).
- Oda, T.2011. “Situation of Fukushima after the Great Eastern Japan Earthquake.” In The 2011 East Japan Earthquake Bulletin of the Tohoku Geographical Association. http://wwwsoc.nii.ac.jp/tga/disaster/disaster-j.html.
- Sato, T. 2004. “Reliability on DoCoMo Network-System for No Intermittent Service, Based on Influence of the Sanrikuminami Earthquake.” Journal of REAJ 26 (3): 199–205. http://ci.nii.ac.jp/vol_issue/nels/AN10540883_en.html.
- Sawada, M., H. Yagi, and H. Hayashi. 2005. “A Study on the Technique for Information Sharing and Presentation of Earthquake Disasters – By the Chuetsu Earthquake Restoration and Revival Support GIS Project.” Journal of Natural Disaster Science 27 (2): 41–48. http://www.jsnds.org/index.en.html.
- Shin, J., M. Chin, and C. Kim. 2006. “Optimal Transmission Range for Topology Management in Wireless Sensor Network.” ICOIN 2006, LNCS 3961: 177–185. Berlin: Springer-Verlag.
- Sugita, H., T. Fukuta, M. Tamura, T. Yokoi, T. Hara, T. Kashima, T. Azuhata, B. Shibasaki, and Y. Yagi. 2003. “IISEE-NET: Information Network for Earthquake Disaster Mitigation of Developing Countries.” Bulletin of the International Institute of Seismology and Earthquake Engineering, Special Edition: 137–143.
- Veenendaal, B., J. Delfos, and T. Tan. 2011. “Geolocating for Web Based Geospatial Applications.” In Advances in Web-based GIS, Mapping Services and Applications, edited by S. Li, S. Dragicevic, and B. Veenendaal, 171–183. London: CRC Press, ISBN: 9780415804837.
- Wang, R., and Y. Kawamura. 2011. “Long-Term Operation of Landslide Observation System Using ZigBee Modules.” In The 1st International Workshop on Soft Computing and Disaster Control.
- Xu, Y., L. Zhong, H. Cao, and Y. Pan. 2006. “Study of Earthquake Disaster Reduction Web GIS System and Spatial Data Sharing.” Wuhan Ligong Daxue Xuebao 28 (10): 106–113.
- Yuksel, E., H. R. Nielson, and F. Nielson. 2011. “A Secure Key Establishment Protocol for ZigBee Wireless Sensor Networks.” The Computer Journal 54 (4): 589–601. doi:10.1093/comjnl/bxq036
- Zhao, J., Y. Wen, R. Shang, and G. Wang. 2004. “Optimizing Sensor Node Distribution with Genetic Algorithm in Wireless Sensor Network.” ISNN 2004, LNCS 3174: 242–247. Berlin: Springer-Verlag.