
Abstract
The geographical condition is a very important component of a country's national condition, and geographical conditions monitoring (GCM) has been of great concern to the Chinese government. GCM has a close relation with ‘Digital China’ and is a concrete embodiment of Digital China. This paper discusses the content and classification of GCM. In accordance with application areas, GCM can be divided into fundamental monitoring, thematic monitoring, and disaster monitoring. The application areas perspective includes the content of the three other perspectives, like the monitoring elements, the monitoring scope, and the monitoring cycle and fully reflects the essence of the GCM. Fundamental monitoring mainly focuses on monitoring all of the geographical elements, which provides a basis for follow-up thematic monitoring; thematic monitoring is a special type of designated subject monitoring that concerns the public or the government; disaster monitoring focuses on the dynamic monitoring of the pre-disaster and disaster periods for natural disasters. The monitoring results will provide timely information for governments so that they can meet management or decision-making requirements. A GCM case study in the area of the Qinghai — Tibet plateau was made, and some concrete conclusions were drawn. Finally, this paper presents some thoughts on conducting GCM.
1. Introduction
The term ‘national condition’ refers to the combination of a country's socioeconomic development, geographical conditions, cultural and historical traditions, and international relations. It is a reflection of a country's basic situation at a certain point in time and has been the basis for countries to make or implement national development strategies and policies. The geographical condition is the most important component of the national condition, and it would be fair to say that every human activity has a geographical condition (Hubbard Citation1932). The idea of the geographical condition focuses on the analysis, study, and description of the national situation from a geographical perspective. In other words, it gives a large-scale, holistic, and comprehensive description of the various basic factors that constitute the national substance, with an emphasis on the spatial variation in the natural, biological, and human phenomena found at the Earth surface. The geographical condition covers such aspects as the territorial and geographical characteristics of the country, the topography and geomorphology, the road network, the distribution of rivers and lakes, the land cover, urban layout and expansion, environmental and ecological conditions, and the spatial features of productivity (Loiseau et al. Citation2012; Kozak, Estreguil, and Ostapowicz Citation2008). Geographical conditions monitoring (GCM) means the dynamic and quantitative monitoring of the territory of the country, its topography, land cover, etc., as well as the statistical analysis of their changes in the quantity and frequency, distribution characteristics, regional differences, and trends. This monitoring is done in order to give an objective and comprehensive geographical view of the spatial distribution of natural resources and also the variations in the environment, ecology, and economic factors. In China, GCM has a close relation with ‘Digital China’ and is a concrete embodiment of Digital China. For example, many achievements of Digital China, such as the 1:50000 DLG (Digital Line Graphic), DEM (Digital Elevation Model), and DOM (Digital Orthophoto Map), can play an import role in the process of conducting GCM. The important results coming from GCM, such as those on topography, land cover, geographical boundaries, and other information, can be applied in the ‘Digital China’ public service platform so as to enrich the contents. The GCM will be a driving force behind China's objective of building a ‘Digital Earth’. Focusing specifically on the environment, there is a broad consensus that climate change, loss of biodiversity, water scarcity, and the impact of chemicals and carbon emissions on air quality and public health will continue to be major issues in the next 20–30 years (Craglia et al. Citation2012). GCM will provide a basis or tool toward a cleaner and more sustainable environment and also provide an opportunity for the world.
Many countries have developed similar projects or activities. The United States Geological Survey (USGS) launched its five-year plan called ‘Geographic Analysis and Monitoring Program’ (GAM) in 2002, and this has been running continuously since then. This program is mainly used for geographic information analysis and dynamic monitoring. By combining digital topographic maps, satellite imagery, and other remote-sensing (RS) data with computer modeling and field investigations, GAM has developed GCM of land cover and surface changes in the world's key areas. It provides the basic data and decision-making support for ecological and environmental protection, disaster prevention, climate change monitoring, and sustainable economic development. By now, GAM has become one of America's most important strategic planning (USGS Citation2008) tools. In ecological conditions monitoring area, the National Aeronautics and Space Administration (NASA) put forward the Terrestrial Observation and Prediction System (TOPS), which is a data and modeling software system designed to seamlessly integrate data from satellite, aircraft, and ground sensors with weather, climate, and application models to expeditiously produce operational nowcasts and forecasts of ecological conditions. TOPS provides reliable data on current and forecasted ecosystem conditions through automation of the data retrieval, preprocessing, integration, and modeling steps, allowing TOPS data products to be used in an operational setting for a range of applications (Nemani et al. Citation2009).
The EU launched the program called ‘Global Monitoring for Environment and Security (GMES)’ in 2003. Comparing to GCM in China, GMES is a much broader ideal than GCM, aiming for establishing European Earth observation system in the future. GMES is not only used for the global environment protection, but also includes security content, such as that related to European policy, civil defense, and peacekeeping operations, and is also used by the military. The plan is to obtain all kinds of environmental information related to the Earth and changes in climate. Overall, the build-up phase of the GMES Space Component is well under way. Now GMES is known as the European Earth observation program Copernicus. Copernicus consists of a complex set of systems, which collect data from multiple sources: earth observation satellites and in situ sensors such as ground stations, airborne, and sea-borne sensors. It processes these data and provides users with reliable and up-to-date information through a set of services related to environmental and security issues. The services address six thematic areas: land, marine, atmosphere, climate change, emergency management, and security. The main users of Copernicus services are policy-makers and public authorities who need the information to develop environmental legislation and policies or to take critical decisions in the event of an emergency, such as a natural disaster or a humanitarian crisis (European Commission Citation2009, Citation2011; FDC Citation2013).
Japan has always attached importance to the basics of GCM. The Geographical Information Authority of Japan released the ‘Heisei 23 annual emphasis of the Geographical Survey Institute Implementation’ in October 2010, taking ‘building a harmonious and vibrant society’ as the overall goal. In addition to developing basic surveying and mapping services, the Authority is also responsible for disaster monitoring, urban landscape monitoring, ground movement monitoring, and land use monitoring as key projects and distributes the results through thematic maps, Internet maps, and reports (Geospatial Information Authority of Japan Citation2010).
Besides the above GCM activities, continental or even global-scale monitoring has been conducted in the past years. Till now, there are a number of global land-cover monitoring products that exist in response to the need for information about land cover and land-cover dynamics, such as IGBP DISCover, the MODIS land cover product, UMD land cover product, Global Land Cover 2000, and Forest cover change (FCC) (Loveland et al. Citation2000; Friedl et al. Citation2002; Hansen et al. Citation2000; Bartholomé and Belward Citation2005; Herold et al. Citation2008; Townshend et al. Citation2012). These have been developed in response to the need for information about land cover and land-cover dynamics. They all have been produced from optical, moderate resolution RS and thematically focused on characterizing the different vegetation types worldwide (Herold et al. Citation2008). In 2010, China started a new global land-cover mapping project to meet the needs of global environmental change studies and earth systems simulation. This project aims to develop more accurate global land-cover data products for 2000 and 2010. Primary data sources will include Landsat data, MODIS data, HJ satellite data, etc. This project is planned to be finished at the end of 2013, and the results will be released subsequently.
After a long period of industrialization, it is evident that the supply of global natural resources is in crisis, the Earth's environment on which we rely is being severely damaged by natural and human activities, and a number problems relating to globally and regionally important resources and also environmental problems are threatening the living conditions of people everywhere (Guo, Li, and Zhu Citation2010). Especially in China, the national condition includes the following situations and problems: complex terrain, frequent land-cover changes, a large population, resource shortages, and other issues. In particular, China is now in a period of rapid development, industrialization and urbanization, and, at the same time, natural surface and human geography information changes very fast. In order to make a scientific and accurate decision, there is an urgent need to conduct GCM and to get authoritative, objective, and accurate geographical conditions information. In the next 20 years, China will witness an important period of fast development, a large amount of construction and other big changes together with greater pressure to implement resource conservation and environmental protection. As such, how to plan this industrialization and urbanization, how to plan the development of land and how to promote key construction projects effectively have raised an urgent need for GCM. Through the GCM process, more comprehensive information about China's territory, geographical characteristics, topography, traffic networks, distribution of rivers and lakes, land use and land cover, urban layout and developmental changes, ecological conditions and spatial distribution of productivity can be obtained. By analyzing the spatial extent, distribution characteristics, and geographical differences of the geographical conditions, the monitoring data, maps and research reports reflecting the various types of environmental elements can then be obtained. All of these can help to reveal China's national condition status from a geospatial perspective.
In recent years, some Chinese government departments, such as those responsible for agriculture and forestry, land, water conservancy, and environmental protection, have engaged in investigating the distribution of natural resources, land use, water resources, and ecological changes. Although the above departments have played an important role in their respective fields, the results are inconsistent and discontinuous to some degree. Routine investigation or monitoring has not been carried out, and this means that it is difficult to get a comprehensive picture that consists of authoritative, objective, and accurate information related to geographical conditions. Satellite RS potentially offers spatially continuous information on relevant land surface properties including land cover, vegetation type, vegetation structure, etc. (Turner et al. Citation2009; Fraser, Olthof, and Pouliot Citation2009). Many countries have experiences in national or global GCM by using satellite RS images. However, the previous or current monitoring activities are all at 1 km or lower resolutions with satellite RS and lack the monitoring with high resolution at a or continental county level due to the cost and data acquisition difficulties (Crabtree et al. Citation2009; Miettinen et al. Citation2012).
Against this background, the National Administration of Surveying, Mapping and Geo-information (NASG) proposed the GCM project, which started in 2012. This project consists of three major parts: one is geographical conditions information census, the second, is geographical information monitoring, and the third, is Geo-statistical analysis. This geographical conditions information census will be the first national census for China, which will make full use of high resolution RS images, including space-borne sensors (Worldview 2, Ziyuan-3, etc.), airborne sensors, ground data, etc. From 2012, Preparation work, including project design, data acquisition, technical experiments and pilot work, etc., will be done within the couple of months up to June 2013, followed by a 24-month phase-1 process through June 2015. In phase-2, scheduled between July and December 2015, the tasks will be sorting, gathering and analysis of information, and forming a census report. Through conducting geographical conditions information census, the base for monitoring can be formed. Geo-statistical analysis will run through the entire process of the investigation and monitoring.
Comparing to the past efforts by NASG – mainly focusing on Basic Surveying and Mapping (BSM), GCM has the following characters or differences with basic surveying and mapping:(1) GCM has enriched the geographical elements contents and attribute information comparing with the BSM; (2) GCM focuses on the analysis, study, and description of the national situation from the aspects of spatial distribution, character and relation, and corresponding changes, etc., that is, it focuses on both the geometry and spatiotemporal changes of geographical elements, while BSM focuses only on geometry; (3) The results of GCM will not only provide the basis for creating and carrying out national development plans and facilitating the country's ecological conservation efforts, but also can be used as basic data for different departments and help to avoid duplication of work, data inconsistencies, and other issues. The results of GCM are unified and standard, and so can be provided to the appropriate departments and used as the base map for professional analysis (Xu Citation2011a, Citation2011b).
This paper discusses the content and classification of GCM, taking the Qinghai–Tibet Plateau region as an example. Finally, some conclusions are made and measures that can be taken in the future are proposed.
2. The content of GCM in China
2.1. Classification for GCM
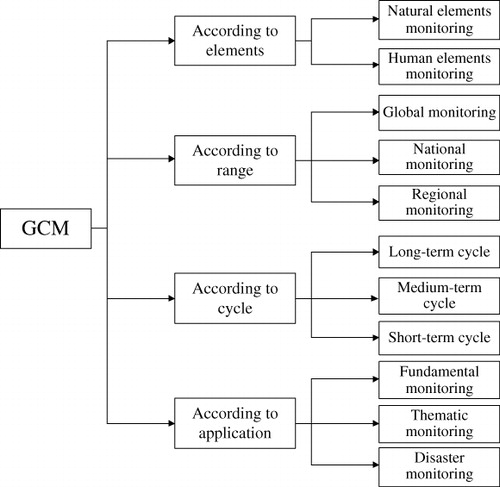
The content of GCM can be divided into different categories from different perspectives. These perspectives are the monitoring elements, the monitoring scope, the monitoring cycle, and the monitoring applications ().
From the point of view of the monitoring elements, GCM content includes natural elements and human elements. Natural elements include landforms, rivers, lakes and swamps, vegetation, etc., while human elements include residential areas, transportation networks, territory, as well as phenomena or objects concerning political, administrative, demographic, urban, historical, cultural, and economic aspects.
From the monitoring range viewpoint, GCM can be divided into three levels: global, national, and regional. The first is based on a global perspective, which is reflected in the global location and the spatial relations between countries. The second, reflects the overall geographical situation and dynamically changing trends of a country, such as China's land area, China's coastline length, and the total amount of national forest and number of national reservoirs, etc. The final level – the regional one – mainly reflects the overall objective geographical situation and dynamical changes in an administrative area, such as those of the province, autonomous region, city, or natural geographical or socioeconomic partitions or zoning (Liu and He Citation2011).
From the point of view of the monitoring cycle, GCM is divided into three time scales, based on the laws of natural and social development: long-, medium- and short-term monitoring. Long-term GCM needs a long time period in order to obtain information relevant to the changes that it monitors and to forecast trends. Long-term monitoring includes the monitoring of changes in surface morphology, such as crustal movements, and the monitoring of changes in the coastline, etc. Medium-term GCM reveals changes in objects by making continuous observations over a relatively short cycle. These observations concern such things as desertification processes, changes in water bodies, glaciers and wetlands area changes. Short-term GCM mainly focuses on geographical changes that occur over a short time or abruptly, such as changes in road networks, vegetation coverage changes, land management, etc. (Kennedy et al. Citation2009).
From the application areas perspective, GCM can be divided into fundamental monitoring, thematic monitoring, and disaster monitoring. Fundamental monitoring mainly focuses on the monitoring of all of the geographical elements, which provides a basis for follow-up thematic monitoring. Thematic monitoring focuses on issues that would arouse public concern, such as those relating to natural resources and ecological protection monitoring. It also deals with the monitoring of the effects of strategic planning implementation, regional development change monitoring, etc. Disaster monitoring focuses on the dynamic monitoring of the period before, during and after disasters such as earthquakes, floods, mudslides, fires and droughts. The monitoring results provide timely information for governments that help with disaster relief and the urgent needs of disaster assessment and reconstruction planning (Guo Citation2010). The application areas perspective includes the content of the three other perspectives described above and fully reflects the essence of the GCM. From the monitoring range and monitoring elements perspective, the fundamental monitoring, thematic monitoring, and disaster monitoring dynamically monitor the natural geographical elements and human geographical elements at the global, national, and regional levels. (This last level includes the province, city, county, township, landscape area, basin, metropolitan area, urban agglomeration or large urban area, etc.) The following section introduces the content of fundamental monitoring, thematic monitoring and disaster monitoring.
2.2. Fundamental monitoring
Fundamental monitoring includes the monitoring of all the geographical elements of the land surface. It includes the dynamic monitoring of slow changes (such as topographical changes), as well as fast changes (such as changes in roads), which will form the basis for thematic monitoring and disaster monitoring. Generally speaking, fundamental monitoring refers to topography, land cover (vegetation coverage, water and wetland areas, glaciers and permanent snow, desert and bare land, traffic networks, residential sites and facilities), and geographical boundaries. Land-cover composition and changes are important in many areas of scientific research and socioeconomic assessments and are the principal data-sets for calculations related to many types of resources and indicators of environmental conditions (Xian et al. Citation2009; Aspinall and Pearson Citation2000; Perera and Tsuchiya Citation2009; Kandrika and Ravisankar Citation2011; Kourgli et al Citation2012).
2.2.1. Topography
Here, ‘topography’ specifically means the identification of specific landforms, such as plains, plateaus, hills and mountains. By using terrain units such as slope, elevation, and amplitude, the range of national landform types can be obtained. From this information, the location and elevation of the nation's major peaks and other useful information can be found.
2.2.2. Vegetation coverage
Vegetation coverage monitoring focuses on the location, range and area of, and changes in, agricultural land (dryland, paddy field, and irrigated land), woodland (woodland, shrub woodland, sparse wood land, immature forest, nursery and cut-over land), plantations (orchards, tea plantations and other plantations) and grassland (that is, grassland with high, medium and low degrees of coverage, and other types of grassland).
2.2.3. Water and wetlands
Water monitoring includes the monitoring of rivers, lakes, reservoirs and channels. River monitoring focuses on the name of the river, the location of its start- and end-points, the river flow, and its length and spatial patterns, as well as changes that occur in perennial rivers and seasonal rivers. Lake monitoring focuses on the name, volume, location, size, water quality and spatial pattern, and also on changes in perennial lakes, seasonal lakes, pools, beaches, and wetlands; Reservoir monitoring focuses on the name, location, size and storage capacity of a reservoir, as well as focusing on the height and width of dams, spatial patterns and changes and on the number of reservoirs. Channel monitoring focuses on the scope, location, length, and number of channels, and on changes in channels.
Wetlands monitoring includes the monitoring of swamp, woody wetland, and other wetland. Wetlands monitoring focuses on the name, location, spatial pattern and also on changes.
2.2.4. Glaciers and permanent snow
Glacier monitoring focuses on the name, location and surface area of a glacier, and on changes in glaciers. Permanent snow monitoring focuses on the surface area covered, as well as on the snow elevation and on changes in the area that is snow covered.
2.2.5. Desert and bare land
Desert monitoring focuses on the name, location, and size of a desert and also on changes. This type of monitoring includes the monitoring of gobi, soil deserts, salt deserts, etc.
Bare land monitoring focuses on the location, size and also on changes. This type of monitoring includes the monitoring of saline areas, bare rock, bare soil, and other exposed places.
2.2.6. Traffic networks
Traffic network monitoring includes the monitoring of railways, highways, and transport facilities. Railway monitoring, focuses on the names, distribution, length, type and amount of high-speed, double-track and single-track railways, and on spatial pattern changes related to these railways. Highway monitoring focuses on the names, quantity, length and type of highways, and on their spatial pattern changes. Transport facilities monitoring focuses on the names, number and location of national airports, ports, railway stations and stations, and on changes in these facilities.
2.2.7. Residential sites and facilities
Residential sites monitoring focuses on the location, scope and size of residential, industrial and mining sites, tourism sites, religious facilities, and on related changes, etc.
Residential sites and facilities, together with traffic networks, belong to impervious surfaces, which are regarded not only as an indicator of the degree of urbanization, but also a major indicator of environmental change and human–environment interactions (Weng Citation2012).
2.2.8. Geographic boundaries
Geographic boundaries monitoring includes the monitoring of the boundaries of nature reserves, forest parks, geological parks, basin divisions, scenic areas and economic divisions, and also the monitoring of principal functional area boundaries and administrative boundaries.
2.3. Thematic monitoring
Thematic monitoring is a special type of designated subject monitoring that especially concerns the public or the government, for example, desert, vegetation, glacier change monitoring, urban development change monitoring, the effects of implementing major engineering projects, etc. Thematic monitoring is based on fundamental monitoring and can be considered as an extension of fundamental monitoring and conducted in some typical and hot areas. Centering on ‘Promote ecological progress’ and ‘Improve development of China's geographical space’ – put forward in the 18th CPC National Congress (November 2012), the thematic monitoring can be summarized into the following themes.
2.3.1. Ecological progress theme
This theme includes the main desert change monitoring, glacier change monitoring, Three-river source region natural ecological monitoring, etc.
2.3.2. Urban development change theme
Understanding urban environments and their spatiotemporal changes is essential for regional and local planning and environmental management (Deng and Wu Citation2012). The growth or sprawl of cities has been a defining influence on life in China during the past two decades and already more than half of China's population is living in cities. Urbanization will undoubtedly be a key force shaping life in the next few decades. Urban development change monitoring focuses on changes in established districts, residential areas, industrial land, greenfield sites, land for construction of public buildings, etc.
2.3.3. Other themes
Other thematic monitoring may include the monitoring of the Three Gorges reservoir area land-cover change monitoring, south-to-north water diversion project surrounding land-cover change monitoring, land reclamation from the sea or lakes, deforestation, etc. (Klaric, Anderson, and Shyu Citation2012).
2.4. Disaster monitoring
Disaster monitoring is the dynamic monitoring of the period before, during and after disasters, such as earthquakes, floods, droughts, mud/rock-slides, land subsidence, etc. (Rojas, Vrieling, and Rembold Citation2011; Yan et al. Citation2012; Metternicht et al. Citation2005; Cleary et al. Citation2012). For example, drought is one of the most frequent climate-related natural disasters in China and other countries in the world (Zhang and Jia Citation2013). Drought disaster monitoring focuses on the area of crop land affected, the number of people affected, and the effects on water body areas. Drought disaster can be effectively monitored by drought indices derived from station-based meteorological data.
2.5. Geo-statistical analysis
Since geo-statistical analysis is an important composite of GCM project, its content will be the interest for all users and the highlights of GCM. Geo-statistical analysis is to analyze geographical elements based on geographical conditions information by integrating social and economic data, in details:
To analyze fundamental geographical conditions information including topography, land cover, and geographical boundaries;
To construct geographical conditions index;
To report geographical conditions information.
2.5.1. Basic statistics
The basic statistics is based on the geographical elements, such as topography, vegetation coverage, water and wetland areas, glaciers and permanent snow, desert and bare land, traffic networks, residential sites and facilities, etc. The geographical elements can be abstracted as point, line, and plane. The major indexes include quantity, orientation, density, and shape. As to the point features, the indexes include quantity, density, proportion, etc. As to the line features, the indexes include quantity, density, length, width, curvature, proportion, etc. As to plane features, the indexes include quantity, area, perimeter, center of gravity, centroid, proportion, etc. The basic statistics reflects the descriptive characteristics for geographical elements.
2.5.2. Comprehensive statistics
The major indexes of comprehensive statistics include the spatial distribution pattern, landscape pattern, the coverage extent, accessibility, superiority, vulnerability, land development degree, spatial correlation, etc., which reflect the physical structure, spatial relationships, and differences for geographical elements. In comprehensive statistics, the socioeconomic data, including the national economy, population, finance, agriculture, industry, education, culture and other data, would be used as reference.
2.5.3. Analysis and evaluation
Based on the basic and comprehensive statistics, combined with the socioeconomic data, the analysis and evaluation will conduct from the point of view of GCM. The analysis and evaluation themes include distribution of resources, ecological protection, regional economic development, social development, etc. The results of the analysis and evaluation will be used for national strategic planning, land planning and management, regional policy-making, etc.
3. A GCM case study in the area of the Qinghai–Tibet plateau
From 2011 to 2012, according to the overall arrangements and requirements of the NASG, the GCM project team of Chinese Academy of Surveying and Mapping conducted GCM of the Qinghai–Tibet Plateau. This study was one of the important national GCM pilots. Land-cover products, DOMs, DEMs and other thematic data from the west China topographic mapping project were fully used in this study.
The Qinghai–Tibet Plateau is a vast, elevated plateau in East Asia that is fragile and highly sensitive to both natural and human disturbances. The Qinghai–Tibet Plateau covers most of the Tibet Autonomous Region as well as most of Qinghai Province, the west of Sichuan Province and northwest Yunnan Province in western China. It stretches approximately 1000 km north to south and 2500 km east to west. With an average elevation exceeding 4000m, the Qinghai–Tibet Plateau is sometimes called ‘the Roof of the World’ and is the world's highest and largest plateau, with an area of 2,674,519 km2 (Zhao et al. Citation2004; Gao et al. Citation2012).
3.1. Qinghai–Tibet Plateau topographic information
Using the updated 1:50 000 DEM data, altitude and slope information for the Qinghai–Tibet Plateau was obtained. The altitude classification results are shown in . From , it can easily be seen that the altitude of most (about 88.14%) of the Qinghai–Tibet Plateau ranges between 3000 and 6000 m. Only 11.44% of the area is blow 3000 m, while 0.42% of the area is over 6000 m. The average altitude is 4300 m. The high-altitude area lies in the southwestern part of the plateau, and to the northeast the altitude gradually falls to 1000 m.
Table 1. Altitude classification for the Qinghai–Tibet Plateau.
The slope classification is shown in . Areas with a slope of less than 3° occupy the largest area – 616,829.10 km2, accounting for 23.06% of the total area. Slopes greater than 35° area occupy the smallest area – 295,682.54 km2, accounting for 11.06% of the total area. The areas with slopes that are relatively gentle lie in the southwestern part of the Qinghai–Tibet Plateau, while the northwestern parts have relatively steep slopes, up to 35° and more.
Table 2. Slope classification for the Qinghai–Tibet Plateau.
By overlaying the altitude and slope classifications of the Qinghai–Tibet Plateau, their spatial distributions were obtained, see .
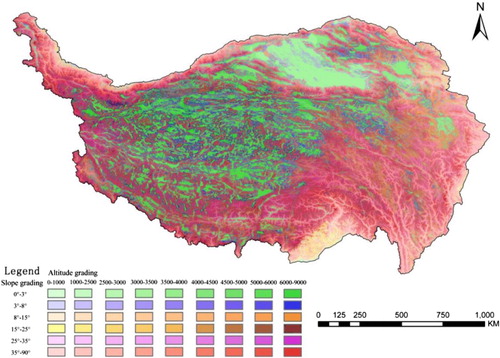
The overlay analysis of the altitude and slope classification shows that:
the altitude and the slope have opposite trends. The area with high altitude and gentle slopes lies in the western and southwestern part of the plateau, while to the north and east the altitude gradually decreases to 1000 m. However, to the northwest and east there are slopes as steep as 35° or even more.
the area of low altitude and gentle slopes lies in the northeast, mainly in the Qaidam Basin; the area with low altitude and steep slopes lies in the southeast, east, and the northern margin. The northwest corner and most parts of the southwestern edge are areas of high altitude and steep slopes.
3.2. Qinghai–Tibet plateau land-cover information
The Qinghai–Tibet Plateau has complex land-cover features and the spatial distribution of these features is very uneven. From northwest to southeast, vegetation shows a uniform zonal distribution. With increasing frequency, land-cover information is often from RS image classification, which is a complex process and requires consideration of many factors. For example, image timing and image quality must be chosen to minimize the influence of unwanted effects on spectral space, since such effects can obscure real change or produce the false appearance of change (Lu and Weng Citation2007; Hansen et al. Citation2000; Kennedy et al. Citation2009). In this study, the land-cover data used was mainly from the western China Topographic Mapping at a Scale of 1:50,000 project, other reference data included the Second National Land Survey data (from the Ministry of Land and Resources, PRC), 1:100,000 land use data (from the Chinese Academy of Sciences), etc. Most of the western China topographic mapping areas are located in Qinghai–Tibet Plateau and have extremely poor transportation and harsh climate conditions. Multisource, multicoverage RS image data were integrated for the west China topographic project, such as satellite and aerial RS data, domestic and international data, and optical and SAR (Synthetic Aperture Radar) RS data (Zhang, Yan, and Xie Citation2012).
Eight land-cover types were used in this study and they were: (1) agricultural land; (2) woodland; (3) plantation (4) grassland; (5) water and wetland; (6) glaciers and permanent snow; (7) residential sites and facilities; (8) desert and bare land. The available land-cover product was limited to that for the year 2011. This could be the basis for future land-cover monitoring of the Qinghai–Tibet Plateau. shows the land-cover map of the Qinghai–Tibet Plateau.
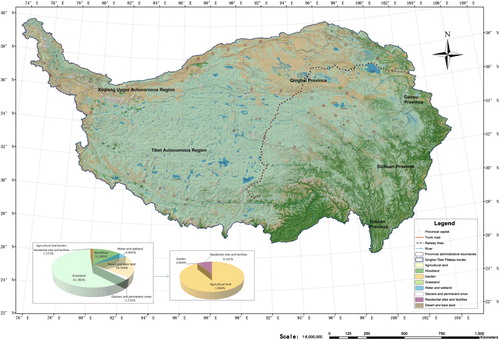
shows the statistical results for the area and percentage of the different land-cover types. The main land-cover type in the Qinghai–Tibet Plateau is grassland, which covers an area of about 1,641,561 km2, accounting for 61.378% of the plateau. The most rare land-cover type is plantation, which has an area of about 111 km2, accounting for 0.004%.
Table 3. Statistical results for the different land-cover types of the Qinghai–Tibet Plateau.
Statistical results for land-cover information that are based on the altitude or slope classifications can reveal further information about the spatial distribution of the different land-cover types and be used by different departments for management or decision-making. According to the land-cover statistical results based on altitude classification, the following results were found. Agricultural land is mainly distributed below 3500 m, woodland is evenly distributed below 5000 m, plantation is mainly distributed between 1000 and 2500 m, and grassland is found mainly above 4000 m. Other results were that water and wetlands are distributed between 4500 and 5000 m, glaciers and permanent snow are found mainly above 4500 m, residential sites and facilities are mainly located below 4000 m – especially between 1000 and 3000 m – and desert and bare land is mainly distributed above 4000 m. According to the land-cover statistical results based on altitude classification, it was found that the grassland area decreases as the slope increases, while the opposite is true for woodland. There is no particularly evident change in the amount of desert and bare land with the change of slope. Water and wetland areas are found in areas where the slope is less than 3°; residential sites and facilities are found mainly where the slope is below 15°; agricultural land and grassland is mainly distributed in the areas with slopes below 25°, and woodland is found mainly where the slope is greater than 15°.
3.3. Typical thematic monitoring on the Qinghai–Tibet Plateau
On the Qinghai–Tibet Plateau, two kinds of typical thematic monitoring were selected. One was the monitoring of the change in the area of Qinghai Lake; the other was monitoring of variations in the glaciers on Geladandong mountain.
3.3.1. Qinghai Lake area change monitoring
Change monitoring is the process of identifying differences in the state of an object or phenomenon by observing it at different times. Essentially, it involves the ability to quantify temporal effects using multitemporal RS data-sets with different methods, like simultaneous analysis of multitemporal image data, post classification comparison, advanced models, integrated Geographic Information System (GIS) and RS method, visual interpretation, etc. (Singh Citation1989; Lu et al. Citation2004; Im, Jensen, and Tullis Citation2008). Qinghai Lake is a saline and alkaline lake situated in an endorheic basin on the Qinghai–Tibet Plateau in the province of Qinghai, and is the largest lake in China. The area of Qinghai Lake is an important piece of data in terms of national geographical conditions and is of great significance in the protection of the ecology and the comprehensive management of the Qinghai Lake basin. Multitemporal and multisource RS images, including Landsat TM/ETM+ data (June 2000; June 2005), CBERS data (December 2008), HJ satellite data (June 2010, 2011), were used in this monitoring together with Qinghai provincial geographic information data. All of the image data were in low-water period except CBERS data. The main technical steps for Qinghai Lake area change monitoring included:
Image data acquisition and analysis;
Image preprocessing (geometrical rectification, radiometric and atmospheric correction);
Waterside line Information extraction using visual interpretation method;
Data validation with fieldwork;
Manual editing of waterside line;
Area statistics for each year and changes calculation.
Table 4. Qinghai Lake area monitoring results.
From 2000 to 2011, little change was witnessed in the area of Qinghai Lake. From 2000 to 2005, there was a slight decline of about 1.3 km2. After 2005, the area began to increase and had increased by 4.5 km2 by 2011. The reason is that the precipitation of Qinghai Lake basin has continued to increase in recent years, while lake evaporation reduced. Using Qinghai provincial geographic information data, the area for year 1976 was found to be 4470 km2. So compared with the area in 1976, the area during the monitoring period had decreased by about 200 km2. In order to discover the long-term trend for Qinghai Lake, more historical image data together with climate data will be required for the detailed reason analysis:
3.3.2. Glacier variations monitoring on Geladandong mountain
Geladandong mountain, the highest peak in the Tanggula Mountains, with an elevation of 6621 m, is located on the central Tibetan Plateau. The mountain is the source of the Yangtze River, which begins in the glaciers on its surface (Ye et al. Citation2006). In this study, Landsat images from 1973, 1986, 1992, 2004 and 2009 were used and the NDSI (Normalized Difference Snow/Ice Index) was employed for glacier information extraction. shows the glacier variations that were found.
Table 5. Geladandong mountain Glacier area variations.
From 1973 to 2009, there were areas of both retreat and advance in the Geladandong glacier but the area that retreated was larger. The area of retreat since 1973 was 118.64 km2 while the area of advance was 62.66 km2. The total glacier area of 845.57 km2 in 1973 had fallen to 789.61 km2 by 2009. The decrease in area of 55.98 km2 represented a percentage decrease of 6.62%, with an average retreat rate of 1.55 km2/year. The areas of glacier retreat for the periods 1973–1986, 1986–1992, 1992–2004 and 2004–2009 were 1.72 km2, 20.83 km2, 25.16 km2 and 8.26 km2, respectively. From 1973 to 1986, the glacier retreated relatively slowly, but it retreated sharply after 1986.
4. Conclusions
In order to conduct GCM in China, some concrete measures should be taken by the Chinese government.
The first measure is to strengthen the unified deployment of and the collaboration between government departments. The NASG is responsible for GCM in China. This means that the NASG will take charge of the overall design, organization, and implementation of GCM. The NASG should formulate the uniform standards and technical solutions for both national and provincial monitoring. Furthermore, the NASG should build a mechanism for unified RS data acquisition, which will avoid repeat purchases. The local management departments for surveying and mapping should help the NASG to carry out national monitoring, especially in collecting and integrating local geographical information. Each local department should develop its own monitoring plan according to the GCM content system, but not be limited by it. The local monitoring plan will be approved by the NASG and the monitoring results will be submitted to the NASG. In summary, the NASG and local departments must cooperate to promote GCM.
The second measure is to strengthen the integration of resources and collective building and sharing. Geographic conditions have trans-department and cross-discipline features. GCM focuses on objectively measurable monitoring information while the investigations or surveys conducted by other departments, such as the land, water, forest, agriculture, traffic, and planning administration departments, focus on specific analysis and subsequent management decisions. The two can be complementary. GCM needs to integrate economic and social thematic data based on the fundamental geographical data in order to produce comprehensive monitoring results. The results can be used as the basis for work by other departments and shared with them.
The third measure is to ensure the authenticity and accuracy of the monitoring results by the adoption of new technologies to the maximum extent. Using RS, GIS, Global Navigation Satellite Systems (GNSS) and other advanced technological solutions, GCM will carry out objective measurement, field validation, and geo-statistical analysis of topography, land cover, geographic boundaries, etc. Furthermore, a strict quality control system should be set up together with the unified technical program and product standards in order to ensure the monitoring results will be objective, precise, and authoritative.
The fourth measure is to strengthen the application and promotion of the monitoring results. The content of GCM has a close relationship with the national economy and social development, as well as issues of current public concern. The monitoring results should be released in a timely fashion to ensure that GCM brings real benefits to the national development.
GCM is a new concept for the traditional surveying and mapping departments, so the final measure is to pay attention to the easier issues first and to gradually proceed from there. For example, small-scale monitoring should be carried out first before it is carried out at the national levels.
GCM will be one of the major strategies for the NASG in the next two decades. At the moment, China's geomatics science and technology is moving from DMTS (Digital Mapping Technology System) to GITS (Geomatics Informatization Technology System), and from data production to information services (Zhang, Li, and Zhai Citation2011). Together with the rapid development of international geomatics science and technology, the contents of GCM in China will be given new expressions and the application of GCM will become ever wider. Also, Chinese GCM will inevitably be an important component of the Global Earth Observation System and be incorporated in the macro-environment of international scientific research for geomatics developments (Ehlers Citation2008; Annoni et al. Citation2011). The NASG should make full use of modern high technology and spare no efforts in establishing an efficient and reliable GCM network as this will enhance the nation's geomatics innovation capability over the next decade. The techniques, policies, standards, and administrative systems relating to GCM are outside the scope of this paper but will be presented in future papers.
Acknowledgments
We thank the anonymous reviewers for their helpful comments. We also would like to acknowledge every member of the GCM project team at CASM, especially Prof. Qin Yan, Zhengjun Liu, Yonghong Zhang, Chun Dong, Xiaogang Ning, Haiyan Gu, Chengfeng Luo, Rong Zhao, Fan Yu, Jing Shen and Yi Jia.
Funding
This work was funded by National Basic Surveying and Mapping Research Program – Automatic Classification with Multisource Remote Sensing Data in Complex Vegetation Coverage Area, National Key Technology Research and Development Program of the Ministry of Science and Technology of China [grant number 2012BAH28B01] and National Natural Science Foundation of China [grant number 41371406].
Additional information
Funding
References
- Annoni, A., M. Craglia, M. Ehlers, Y. Georgiadou, A. Giacomelli, M. Konecny, N. Ostlaender, et al. 2011. “A European Perspective on Digital Earth.” International Journal of Digital Earth 4 (4): 271–284. doi:10.1080/17538947.2011.582888.
- Aspinall, R., and D. Pearson. 2000. “Integrated Geographical Assessment of Environmental Condition in Water Catchments: Linking Landscape Ecology, Environmental Modelling and GIS.” Journal of Environmental Management 59 (4): 299–319. doi:10.1006/jema.2000.0372.
- Bartholomé, E., and A. S. Belward. 2005. “GLC2000: A New Approach to Global Land Cover Mapping from Earth Observation Data.” International Journal of Remote Sensing 26: 1959–1977. doi:10.1080/01431160412331291297.
- Cleary, P. W., M. Prakash, S. Mead, X. M. Tang, H. B. Wang, and S. Ouyang. 2012. “Dynamic Simulation of Dam-Break Scenarios for Risk Analysis and Disaster Management.” International Journal of Image and Data Fusion 3 (4): 333–363. doi:10.1080/19479832.2012.716084.
- Crabtree, R., C. Potter, R. Mullen, J. Sheldon, S. L. Huang, J. Harmsen, A. Rodman, and C. Jean. 2009. “A Modeling and Spatio-Temporal Analysis Framework for Monitoring Environmental Change Using NPP as an Ecosystem Indicator.” Remote Sensing of Environment 113 (7): 1486–1496. doi:10.1016/j.rse.2008.12.014.
- Craglia, M., K. Bie, D. Jackson, M. Pesaresi, G. Remetey-Fülöpp, C. L. Wang, A. Annoni, et al. 2012. “Digital Earth 2020: Towards the Vision for the Next Decade.” International Journal of Digital Earth 5 (1): 4–21. doi:10.1080/17538947.2011.638500.
- Deng, C. B., and C. S. Wu. 2012. “BCI: A Biophysical Composition Index for Remote Sensing of Urban Environments.” Remote Sensing of Environment 127 (12): 247–259. doi:10.1016/j.rse.2012.09.009.
- Ehlers, M., 2008. Geoinformatics and Digital Earth Initiatives: A German Perspective. International Journal of Digital Earth 1 (1): 17–30. doi:10.1080/17538940701781975.
- European Commission. 2009. “Global Monitoring for Environment and Security (GMES): Challenges and Next Steps for the Space Component” [online]. http://ec.europa.eu/enterprise/policies/space/documents/gmes_en.htm
- European Commission. 2011. “On the European Earth Monitoring Programme (GMES) and Its Operations (from 2014 onwards)” [online]. http://ec.europa.eu/enterprise/policies/space/documents/gmes_en.htm
- FDC. 2013. “The European Earth Observation Programme” [online]. http://copernicus.eu/pages-principales/overview/
- Fraser, R. H., I. Olthof, and D. Pouliot. 2009. “Monitoring Land Cover Change and Ecological Integrity in Canada's National Parks.” Remote Sensing of Environment 113 (7): 1397–1409. doi:10.1016/j.rse.2008.06.019.
- Friedl, M. A., D. K. McIver, J. C. F. Hodges, X. Y. Zhang, D. Muchoney, A. H. Strahler, C. E. Woodcock, et al. 2002. “Global Land Cover Mapping from MODIS: Algorithms and Early Results.” Remote Sensing of Environment 83 (1–2): 287–302. doi:10.1016/S0034-4257(02)00078-0.
- Gao, Y., J. Huang, S. Li, and S. C. Li. 2012. “Spatial Pattern of Non-Stationarity and Scale-Dependent Relationships Between NDVI and Climatic Factors—A Case Study in Qinghai-Tibet Plateau, China.” Ecological Indicators 20: 170–176. doi:10.1016/j.ecolind.2012.02.007.
- Geospatial Information Authority of Japan. 2010. “Heisei 23 Annual Emphersis of the Geographical Survey Institute Implementation” [online]. http://www.gsi.go.jp/index.html
- Guo, H. D. 2010. “Understanding Global Natural Disasters and the Role of Earth Observation.” International Journal of Digital Earth 3 (3): 221–230. doi:10.1080/17538947.2010.499662.
- Guo, H. D., Z. Liu, and L. W. Zhu. 2010. “Digital Earth: Decadal Experiences and Some Thoughts.” International Journal of Digital Earth 3 (1): 31–46. doi:10.1080/17538941003622602.
- Hansen, M. C., R. S. Defries, J. R. Townshend, and R. Sohlberg. 2000. “Global land Cover Classification at 1 Km Spatial Resolution Using a Classification Tree Approach.” International Journal of Remote Sensing 21 (6–7): 1331–1364. doi:10.1080/014311600210209.
- Herold, M., P. Mayaux, C. E. Woodcock, A. Baccini, and C. Schmullius. 2008. “Some Challenges in Global Land Cover Mapping: An Assessment of Agreement and Accuracy in Existing 1 km Datasets.” Remote Sensing of Environment 112 (5): 2538–2556. doi:10.1016/j.rse.2007.11.013.
- Hubbard, G. D. 1932. “Geographic Conditions, Influences, Controls.” The Ohio Journal of Science 32 (1): 39–54.
- Im, J., J. R. Jensen, and J. A. Tullis. 2008. “Object-Based Change Detection Using Correlation Image Analysis and Image Segmentation.” International Journal of Remote Sensing 29 (2): 399–423. doi:10.1080/01431160601075582.
- Kandrika, S., and T. Ravisankar. 2011. “Multi-Temporal Satellite Imagery and Data Fusion for Improved Land Cover Information Extraction.” International Journal of Image and Data Fusion 2 (1): 61–73. doi:10.1080/19479832.2010.518166.
- Kennedy, R. E., P. A. Townsend, J. E. Gross, W. B. Cohen, P. Bolstad, Y. Q. Wang, and P. Adams. 2009. “Remote Sensing Change Detection Tools for Natural Resource Managers: Understanding Concepts and Tradeoffs in the Design of Landscape Monitoring Projects.” Remote Sensing of Environment 113 (7): 1382–1396. doi:10.1016/j.rse.2008.07.018.
- Klaric, M. N., B. Anderson, and C. R. Shyu. 2012. “Information Mining From Human Visual Reasoning About Multi-Temporal, High-resolution Satellite Imagery.” International Journal of Image and Data Fusion 3 (3): 243–256. doi:10.1080/19479832.2012.683821.
- Kourgli, A., M. Ouarzeddine, Y. Oukil, and A. Belhadj-Aissa. 2012. “Texture Modelling for Land Cover Classification of Fully Polarimetric SAR Images.” International Journal of Image and Data Fusion 3 (2): 129–148. doi:10.1080/19479832.2010.551521.
- Kozak, J., C. Estreguil, and K. Ostapowicz. 2008. “European Forest Cover Mapping with High Resolution Satellite Data: The Carpathians Case Study.” International Journal of Applied Earth Observation and Geoinformation 10 (1): 44–55. doi:10.1016/j.jag.2007.04.003.
- Liu, Y. L., and J. H. He. 2011. “On Geographical Condition Monitoring Framework.” In Research and Exploration of Geographical Condition Monitoring, edited by China Surveying and Mapping Publicity Center, 129–135. Beijing: Surveying and Mapping Press.
- Loiseau, E., G. Junqua, P. Roux, and V. B. Maurel. 2012. “Environmental Assessment of a Territory: An Overview of Existing Tools and Methods.” Journal of Environmental Management 112: 213–225. doi:10.1016/j.jenvman.2012.07.024.
- Loveland, T. R., B. C. Reed, J. F. Brown, D. O. Ohlen, Z. Zhu, L. Yang, and J. W. Merchant. 2000. “Development of a Global Land Cover Characteristics Database and IGBP DISCover from 1 km AVHRR Data.” International Journal of Remote Sensing 21 (6–7): 1303–1330. doi:10.1080/014311600210191.
- Lu, D., P. Mausel, E. Brondizio, and E. Moran. 2004. “Change Detection Techniques.” International Journal of Remote Sensing 25 (12): 2365–2401. doi:10.1080/0143116031000139863.
- Lu, D., and Q. Weng. 2007. “A Survey of Image Classification Methods and Techniques for Improving Classification Performance.” International Journal of Remote Sensing 28 (5): 823–870. doi:10.1080/01431160600746456.
- Metternicht, G., L. Hurni, and R. Gogu. 2005. “Remote Sensing of Landslides: An Analysis of the Potential Contribution to Geo-Spatial Systems for Hazard Assessment in Mountainous Environments.” Remote Sensing of Environment 98 (2–3): 284–303. doi:10.1016/j.rse.2005.08.004.
- Miettinen, J., C. H. Shi, W. J. Tan, and S. C. Liew. 2012. “2010 Land Cover Map of Insular Southeast Asia in 250-m Spatial Resolution.” Remote Sensing Letters 3 (1): 11–20. doi:10.1080/01431161.2010.526971.
- Nemani, R., H. Hashimoto, P. Votava, F. Melton, W. L. Wang, A. Michaelis, L. Mutch, C. Milesi, S. Hiatt, and M. White. 2009. “Monitoring and Forecasting Ecosystem Dynamics Using the Terrestrial Observation and Prediction System (TOPS).” Remote Sensing of Environment 113 (7): 1497–1509. doi:10.1016/j.rse.2008.06.017.
- Perera, K., and K. Tsuchiya. 2009. “Experiment for Mapping Land Cover and It's Change in Southeastern Sri Lanka Utilizing 250 m Resolution MODIS Imageries.” Advances in Space Research 43 (9): 1349–1355. doi:10.1016/j.asr.2008.12.016.
- Rojas, O., A. Vrieling, and F. Rembold. 2011. “Assessing Drought Probability for Agricultural Areas in Africa with Coarse Resolution Remote Sensing Imagery.” Remote Sensing of Environment 115 (2): 343–352. doi:10.1016/j.rse.2010.09.006.
- Singh, A. 1989. “Review Article Digital Change Detection Techniques Using Remotely-Sensed Data.” International Journal of Remote Sensing 10 (6): 989–1003. doi:10.1080/01431168908903939.
- Townshend, J. R., J. G. Masek, C. Q. Huang, E. F. Vermote, F. Gao, S. Channan, J. O. Sexton, et al. 2012. “Global Characterization and Monitoring of Forest Cover Using Landsat Data: Opportunities and Challenges.” International Journal of Digital Earth 5 (5): 373–397. doi:10.1080/17538947.2012.713190.
- Turner, D. P., W. D. Ritts, S. Wharton, C. Thomas, R. Monson, T. A. Black, and M. Falk. 2009. “Assessing FPAR Source and Parameter Optimization Scheme in Application of a Diagnostic Carbon Flux Model.” Remote Sensing of Environment 113 (7): 1529–1539. doi:10.1016/j.rse.2009.03.003.
- USGS. 2008. “Geographic Analysis and Monitoring Program-5 Year Program Plan (2008–2013)” [online]. http://gam.cr.usgs.gov/pubs.shtml
- Weng, Q. H. 2012. “Remote Sensing of Impervious Surfaces in the Urban Areas: Requirements, Methods, and Trends.” Remote Sensing of Environment 117 (2): 34–49. doi:10.1016/j.rse.2011.02.030.
- Xian, G., C. Homer, and J. Fry. 2009. “Updating the 2001 National Land Cover Database Land Cover Classification to 2006 by Using Landsat Imagery Change Detection Methods.” Remote Sensing of Environment 113 (6): 1133–1147. doi:10.1016/j.rse.2009.02.004.
- Xu, D. M. 2011a. “To Conduct Geographical Conditions Monitoring and Serve for Scientific Development” [online]. http://paper.people.com.cn/rmrb/html/2011-04/01/nbs.D110000renmrb_01.htm
- Xu, D. M. 2011b. “Improve the Level of Surveying and Mapping Service for National Economic and Social Development.” Qiu Shi 23 (5): 54.
- Yan, Y. J., E. Trouvé, V. Pinel, G. Mauris, E. Pathier, and S. Galichet. 2012. “Fusion of D-InSAR and Sub-Pixel Image Correlation Measurements for Coseismic Displacement Field Estimation: Application to the Kashmir Earthquake (2005).” International Journal of Image and Data Fusion 3 (1): 71–92. doi:10.1080/19479832.2011.577563.
- Ye, Q. H., S. C. Kang, F. Chen, and J. H. Wang. 2006. “ Monitoring Glacier Variations on Geladandong Mountain, Central Tibetan Plateau, From 1969 to 2002 Using Remote-Sensing and GIS Technologies.” Journal of Glaciology 52 (179): 537–545. doi:10.3189/172756506781828359.
- Zhang, Z., and G. S. Jia. 2013. “Monitoring Meteorological Drought in Semiarid Regions Using Multi-Sensor Microwave Remote Sensing Data.” Remote Sensing of Environment 134 (7): 12–23. doi:10.1016/j.rse.2013.02.023.
- Zhang, X., W. S. Li, and L. Zhai. 2011. “A High-Level Architecture for a Geomatics Informatization Technology System: the Chinese Case.” International Journal of Digital Earth 4 (2): 93–107. doi:10.1080/17538947.2010.513420.
- Zhang, J. X., Q. Yan, and W. H. Xie. 2012. “Mapping Western China at a Scale of 1:50,000.” Photogrammetric Engineering And Remote Sensing 78 (4): 289–290.
- Zhao, L., C. L. Ping, D. Q. Yang, G. D. Cheng, Y. J. Ding, and S. Y. Liu. 2004. “Changes of Climate and Seasonally Frozen Ground Over the Past 30 Years in Qinghai–Xizang (Tibetan) Plateau, China.” Global and Planetary Change 43 (1–2): 19–31. doi:10.1016/j.gloplacha.2004.02.003.