
Abstract
Understanding the relationships between snow and vegetation is important for interpretation of the responses of alpine ecosystems to climate changes. The Qinghai-Tibetan Plateau is regarded as an ideal area due to its undisturbed features with low population and relatively high snow cover. We used 500 m Moderate Resolution Imaging Spectroradiometer (MODIS) datasets during 2001–2010 to examine the snow–vegetation relationships, specifically, (1) the influence of snow melting date on vegetation green-up date and (2) the effects of snow cover duration on vegetation greenness. The results showed that the alpine vegetation responded strongly to snow phenology (i.e., snow melting date and snow cover duration) over large areas of the Qinghai-Tibetan Plateau. Snow melting date and vegetation green-up date were significantly correlated (p < 0.1) in 39.9% of meadow areas (accounting for 26.2% of vegetated areas) and 36.7% of steppe areas (28.1% of vegetated areas). Vegetation growth was influenced by different seasonal snow cover durations (SCDs) in different regions. Generally, the December–February and March–May SCDs played a significantly role in vegetation growth, both positively and negatively, depending on different water source regions. Snow's positive impact on vegetation was larger than the negative impact.
1. Introduction
Over the past two decades, terrestrial vegetation has undergone dramatic changes from regional to global scale monitored with long-term satellite records (Li et al. Citation2010; Stockli et al. Citation2011; Beck and Goetz Citation2011, Citation2012; Fensholt et al. Citation2012). Recent reviews confirm that climate changes are likely to affect several aspects of vegetation, such as plant composition and diversity (Ozanne et al. Citation2003; Hallinger, Manthey, and Wilmking Citation2010), phenology (Nemani et al. Citation2002), greenness and productivity (Thomey et al. Citation2011; Zhang et al. Citation2013), and biomass and vegetation fraction (Zhang and Walsh Citation2007; Yu, Wang, and Wang Citation2010). Several studies have explicitly examined factors that control vegetation change and have confirmed that climate is the dominant factor affecting changes in plant communities (Voronin et al. Citation2003; Millett, Johnson, and Guntenspergen Citation2009). In northern mid-high latitudinal zones, increasing temperature and precipitation are considered as the primary climatic factors controlling vegetation growth (Tucker et al. Citation2001; Ichii et al. Citation2002).
In alpine vegetation areas, snow is a major source of fresh water for vegetation activities (Beniston et al. Citation1997). In addition, snow insulates soil from cold temperatures and wind, which is beneficial to vegetation growth (Fahnestock et al. Citation1998; Nobrega and Grogan Citation2007). Previous studies have suggested that increasing snow depth promotes alpine vegetation growth (Groffman et al. Citation2001; Dorrepaal et al. Citation2004). However, most such studies focused only on the response of vegetation activities to snow depth, which results in an unclear view of the relationship between vegetation activities and snow phenology. Furthermore, snow measurements in previous studies have primarily been limited to in situ records and microwave data. In situ snow records are scarce in the region and coarse resolution microwave data have low measurement accuracy. The Moderate Resolution Imaging Spectroradiometer (MODIS) snow products (MOD10A2) provide relatively high temporal frequency (8-day) for monitoring snow cover at 500-m resolution and provide an effective method for monitoring snow phenology parameters, thereby promoting awareness of the effect of snow on vegetation activities.
As a typical alpine ecosystem, the Qinghai-Tibetan Plateau is an ideal area for the study of the effect of snow phenology on vegetation activities. The plateau has a relatively large area covered by snow (Pu and Xu Citation2009) and is more sensitive to global climatic changes than most other parts of the world (Ye and Wu Citation1998). Snow cover plays an important role in ecological environment on the Qinghai-Tibetan Plateau (Li et al. Citation2008; Li et al. Citation2010; Xiao et al. Citation2002; Yan and Onipchenko Citation2006). A warming trend over the plateau, with an average climate increase of 0.37°C/decade, was recently reported by Li et al. (Citation2008). Increasing temperatures may result in a decline in snow cover and enhancement of vegetation activities. A warming trend may also promote interactions between changes in snow cover and vegetation activities (Dye and Tucker Citation2003). Understanding the interactions between vegetation and snow in alpine ecosystems can support ecological modeling and help deepen understanding of vegetation dynamics.
The objective of this study is to explore the effect of snow phenology on vegetation in alpine ecosystems. In this study, we used MODIS-derived vegetation parameters and snow phenology parameters to explore the interactions between snow cover and vegetation in the Qinghai-Tibetan Plateau during 2001 and 2010. We analyzed (1) the spatial patterns of snow phenology parameters (snow cover duration and snow melting date) and vegetation parameters (green-up date and greenness), (2) the relationships between snow melting date (SMD) and vegetation green-up date, and (3) the relationships between snow cover duration (SCD) and vegetation greenness.
2. Study area and data
2.1. Study area
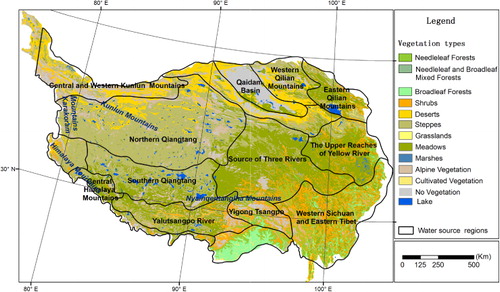
The Qinghai-Tibetan Plateau is located in southwestern China (74°E–104°E, 25°N–40°N), including Qinghai Province, Tibet Autonomous Region, and parts of Gansu, Xinjiang, Sichuan, and Yunnan provinces (). As the ‘roof of the world,’ the Qinghai-Tibetan Plateau has an average elevation over 4000 m and is the highest and largest plateau in the world. It has a well-developed network of watercourses, including the headwaters of the Yangtze River, the Yellow River, and the Lantsang River.
The Qinghai-Tibetan Plateau forms a unique climatic feature characterized by strong solar radiation, warm and humid summers, and cold and dry winters (Peng et al. Citation2012). In most parts of the plateau, the annual mean temperature is below 0°C. Summer precipitation follows a gradient from about 450 mm in the southeast to 800 mm in the northwest (Chen et al. Citation2012).
The vegetation on the Qinghai-Tibetan Plateau generally follows the moisture and temperature gradient. Based on the Vegetation Atlas of China (1:1,000,000) (Editorial Committee of Vegetation Altas of China, the Chinese Academy of Sciences, 2001), the vegetation includes meadows (26.2%), steppes (28.1%), grasslands (9.7%), forests (7.4%), and others (). Overall, 84.2% of the study area is covered by vegetation. The cold and dry northern plateau is covered by desert grasslands, the central area by meadows and steppes, and the southeastern plateau by shrubs and forests. The growing season over the plateau is May to September (Xu et al. Citation2005).
Snow phenology over the plateau is an indicator of the climate. Beginning in September, snow cover expands rapidly and reaches its peak in December to February, and then rapidly reduces and finally disappears in late May (Qin, Liu, and Li Citation2006). From May to September, the plateau is snow-free in most areas, except for a few locations in the mountain ranges. The duration of snow cover on the plateau varies with elevations (Pu, Xu, and Salomonson Citation2007; Pu and Xu Citation2009). Areas persistently covered by snow are primarily located in the Himalayas, the Kunlun Range, the Karakoram Range, and western part of the Yarlung Zangbo Valley, which include the most heavily glaciated regions in the world. The melt waters of the snow and glaciers are the main runoff sources of the upper reaches of many rivers (Zhu, Shi, and Wang Citation2012), such as the Yangtze River, the Yellow River, and the Lantsang River, and provide vital water source for most China.
2.2. Data
2.2.1. NDVI data
The normalized difference vegetation index (NDVI) has been used as a surrogate for photosynthetic capacity, because it is highly correlated to the absorbed fraction of photosynthetically active radiation and gross photosynthesis (Asrar et al. Citation1984; Myneni et al. Citation1995; Tucker et al. Citation2001; Zhou et al. Citation2001; Xiao and Moody Citation2005). The index is defined as the ratio of the difference between near-infrared reflectance (ρ nir) and red reflectance (ρ red) to their summation (EquationEquation 1) (Rouse et al. Citation1974).
2.2.2. Snow cover data
In comparison to other snow cover products (e.g. NOHRSC and SSM/I), the MODIS snow cover data MOD10A2 (500-m spatial resolution and 8-day interval) has higher spatial and temporal resolutions and higher measurement accuracy (Hall et al. Citation2002). In addition, MOD10A2 can effectively minimize the effect of cloud contamination in most cases (Hall and Riggs Citation2007) and has higher classification accuracy for both snow and land than another MODIS snow product (MOD10A1) that has 500-m resolution and daily interval (Zhou, Xie, and Hendrickx Citation2005). Previous studies have shown that the overall accuracy of MOD10A2 ranges between 84% and 91% (Wang, Xie, and Liang Citation2008; Pu, Xu, and Salomonson Citation2007; Pu and Xu Citation2009). Considering the relatively high accuracy, we adopted MOD10A2 from September 2000 to May 2010 to derive the snow phenology parameters in our study.
3. Methods
3.1. Derivation of snow phenology parameters
Two snow phenology parameters, SCD and SMD, were used to describe snow conditions in the Qinghai-Tibetan Plateau. The SCD is positively associated with soil moisture and improves vegetation growth (Chen et al. Citation2008). Variation in the snow melting date affects the timing of fresh water availability for vegetation activities (Wang and Xie Citation2009). In our study, a hydrological year is referred to as the period between 1 September of concurrent year to 31 August of the following years. SCD is defined as the total snow cover days in a hydrological year. The following EquationEquation (2) is used to calculate SCD:
Snow melting date (SMD) was calculated using EquationEquation (3) based on the method described by Wang and Xie (Citation2009):
3.2. Derivation of vegetation green-up date
Green-up date is a key phenology parameter, which indicates the time when vegetation begins to grow. Vegetation green-up date is considered as an important indicator of climate change. Changes in vegetation green-up date can alter the length of growing season and affect many properties of terrestrial ecosystems, such as carbon cycles, nitrogen cycles, and vegetation primary production (Walther et al. Citation2002; Carrara et al. Citation2003; Barr et al. Citation2007; Piao et al. Citation2007). TIMESAT is a software developed for analyzing time-series data to derive phenology parameters, such as green-up date, green-off date, and length of growing season (Jönsson and Eklundh Citation2004), and has been widely used in various studies (Boschetti et al. Citation2009; Wang et al. Citation2011). In this study, we employed the TIMESAT program to derive green-up date. The derivation of green-up date includes three steps: (1) The time-series NDVI data were smoothed using the Savitzky–Golay filtering method. Small moving windows in the Savitzky–Golay filter yielded results that are able to detect rapid changes, whereas increasing moving window leads to smoothed NDVI time-series data. To achieve a balance between responsiveness and smoothness, we used a window size of 2. (2) The filtered time series was fitted using an asymmetric Gaussian method. Those pixels that failed to return a valid result were set to ‘no data’. (3) The fitted NDVI time series was analyzed using the TIMESAT program. The time series at each pixel was analyzed to extract green-up date that represented the date when NDVI increased to 30% of the amplitude of the fitted Gaussian function.
3.3. Correlation analysis between snow cover and vegetation
To explore the sensitivity of vegetation activities to snow cover, two correlation analyses were performed at pixel level to examine the relationships between SMD and green-up date and between SCD and vegetation greenness (indicated by NDVI). All the variables were examined from 2001 to 2010, so the sample size of them was 10. Pearson correlation coefficients (r) were calculated, and the significance of the correlation coefficients (p) was estimated with two-tailed t-test at a significance level of 90%.
There are lag effects in the vegetation response to snow in alpine and arctic ecosystems (Buus-Hinkler et al. Citation2006; Peng et al. Citation2010). However, little is known about the lag effects of snow duration on vegetation growth in the Qinghai-Tibetan Plateau. In this study, we examined the lag effects of seasonal SCD on vegetation greenness using the cross-correlation method illustrated in . Because the period from September to May was usually dominated by snow cover (Qin, Liu, and Li Citation2006), we divided SCD into five periods:
September–November (fall) accumulation,
December–February (winter) accumulation,
March–May (spring) accumulation,
December–May accumulation, and
September–May accumulation.
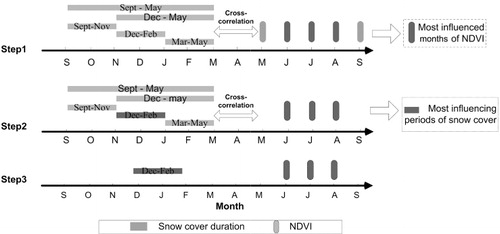
Step 1: Identification of most influenced months of NDVI. The correlations of all five SCDs (September–November, December–February, March–May, December–May, and September–May) with May NDVI were calculated and the maximum (positive and negative) values of the five correlation coefficients were obtained for each pixel. The same procedure was then performed for the NDVI of other four months (June, July, August, and September). The image that had the maximum (positive and negative) correlation coefficients was obtained for each month and the month that had largest number of pixels with significant correlation (p < 0.1) was regarded as the ‘most influenced month of NDVI’ by SCDs (, Step 1).
Step 2: Identification of most influencing periods of snow cover. The five SCD periods that was the most correlated with the NDVI in the most influenced months was regarded as the ‘most influencing period’ of snow cover for vegetation greenness (, Step 2).
Step 3: The interactions between the most influencing periods of SCDs and the most influenced months of NDVI were analyzed among different water source regions using correlation analysis to evaluate the effects of snow phenology on vegetation activities in the alpine ecosystem (, Step 3).
4. Results and discussion
4.1. Spatial distribution of snow cover and vegetation parameters
Snow cover in the Qinghai-Tibetan Plateau is very uneven in space (). The maps of SCD from 2001 to 2010 () show that the longest SCD (> 200 days) occurred in the Himalayas, Karakoram, Kunlun, and Nyainqentanglha Mountains, accounting for 4.3% of the plateau area. Areas with relatively shorter SCD (20 < days < 200) were located mostly in the central plateau, accounting for 71.3% of the plateau. This area is dominated by steppes and meadows where snow cover prevents the vegetation from photosynthesis and thus the conditions for vegetation growth. Due to large-scale shielding from the Himalaya and Karakoram Mountains, areas with short SCDs were located mainly in the southwestern and southeastern plateau, accounting for about 24.4% of the plateau.
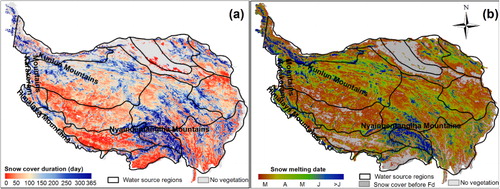
The pattern of SMD in the plateau is similar to SCD (). Relatively early SMD (March) was observed in the areas with shorter SCD scattering over the Qinghai-Tibetan Plateau. These areas cover 70% of the plateau, which are primarily distributed in the lower lands of the central and northeastern plateau. Areas with relatively late SMD (April and May or later) is mainly located in the areas with long SCD in the Himalaya, Karakoram, Kunlun, and Nyainqentanglha Mountains.
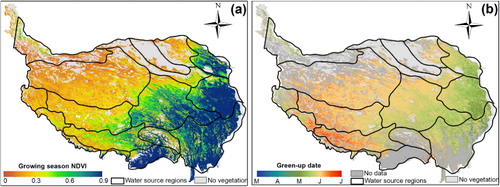
Overall, vegetation greenness on the Qinghai-Tibetan Plateau decreased from the southeast to the northwest (). The mean annual growing season (May–September) NDVI during 2001–2010 was highest in the southeastern Plateau (), which is dominated by forests. The mean annual growing season NDVI values decreased to 0.3–0.5 in the central plateau where the dominant vegetation is meadows, and reached the lowest in the northwest part where desert grasslands and steppes are the main vegetation types (). Green-up date shows a similar spatial pattern () as the growing season NDVI. The green-up date occurred between late April and early May in the eastern plateau and June in the western plateau.
Although alpine ecosystems are influenced by many environmental factors, snow phenology plays a key and complicated role in controlling the spatial pattern of vegetation parameters (Billings and Bliss Citation1959). The variations in SCD result in a snow melting gradient, which further affects the alternation between freezing and thawing in the eastern Qinghai-Tibetan Plateau (Chen et al. Citation2008). In the areas with early SMD, without the protection of snow cover, vegetation exposed to cold temperatures cannot grow well because of the harsh environment (Chen et al. Citation2008). In contrast, in the areas with late SMD, snow insulation protects vegetation from damage caused by freezing and thawing, but the short growing season constrains the vegetation growth (Benedict Citation1990; Galen and Stanton Citation1993, Citation1995; Totland and Alatalo Citation2002; Chen et al. Citation2008). Therefore, vegetation may grow better in those areas with intermediate SCD. The above findings explain the patterns for vegetation phenology that may have close relationship with SCDs and SMD.
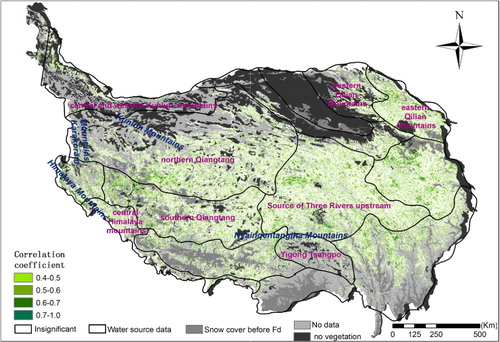
4.2. Effects of SMD on vegetation green-up date
shows the spatial distribution of correlation coefficients between snow melting date and green-up date in the Qinghai-Tibetan Plateau. Large areas in the southeastern and northwestern plateau have no data due to cloud contamination. We observed that 39.9% of the meadow areas (accounting for 26.2% of vegetated areas) and 36.7% of the steppe areas (28.1% of vegetated areas) had significant correlations (p < 0.1) between SMD and vegetation green-up date, mainly located in the central plateau. Snow cover blocks incoming photosynthetic active radiation (PAR), and thus, the late snowmelt date delays the green-up date (Belzile et al. Citation2001; Delbart et al. Citation2006; Buus-Hinkler et al. Citation2006). In addition, changes in SMD may alter the vegetation green-up date by influencing the temperature for vegetation growth (Grippa et al. Citation2005). During snow melting period, cold and wet air always takes away large amounts of heat from soil and sometimes leads to low temperature, which, in turn, is harmful for vegetation growth. The reactions of vegetation green-up date to SMD found in our study are similar to other regions of the northern hemisphere. For example, Knight et al. (Citation1979) found that vegetation green-up was delayed by about 7–9 days due to delayed SMD in subalpine meadows in Wyoming, U.S. Levis and Bonan (Citation2004) found a strong correlation between day of leaf emergence and SMD in northern Europe, central Canada, and eastern China.
4.3. Effects of SCDs on growing season NDVI
Snow cover could have both positive and negative impacts on vegetation. Snow promotes vegetation growth by providing water for vegetation growth and protecting soil from exposure to wind and low temperature. On the other hand, it may also negatively affect vegetation growth as it associates with low temperature and delays the snow melting date. We examined both positive and negative effects of snow on vegetation growth in the Qinghai-Tibetan Plateau. Lag effects existed in the correlation between SCDs and vegetation greenness. To determine the lag effect, we employed the cross-correlation method described in Section 3.3 and .
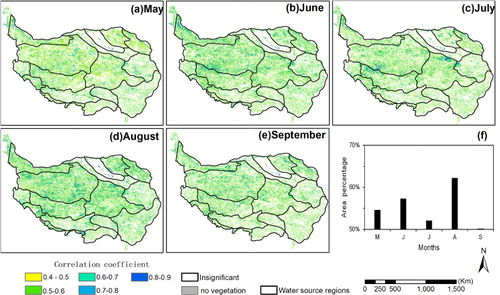
The highest positive correlation between SCDs and NDVI between May and September (, Step 1) occurred in June and August (). There was a significant correlation (p < 0.1) between SCD and NDVI for 57.6% of the vegetated areas in June (). In July, SCD and NDVI were significantly correlated for 52.1% of the vegetated area. The correlation between SCD and NDVI was significant (p < 0.1) for most area (62.2%) in August (). Fewer areas (54.6% of the vegetated areas) were significantly correlated with SCDs (p < 0.1) in May than in June and August. In May, the vegetation begins to grow in the Qinghai-Tibetan Plateau and vegetation conditions are poorer than those in other months. The poor vegetation conditions limit the identification of the relationships between SCD and NDVI (). The lowest percentage of significantly correlated pixels (accounting for 50.2% of the vegetated areas) was found in September. In the Qinghai-Tibetan Plateau, the vegetation begins to wither in September (Xu et al. Citation2005), and water availability is no longer the dominant factor affecting vegetation development. This may be the reason for the relatively weak correlation between SCD and NDVI in September ().
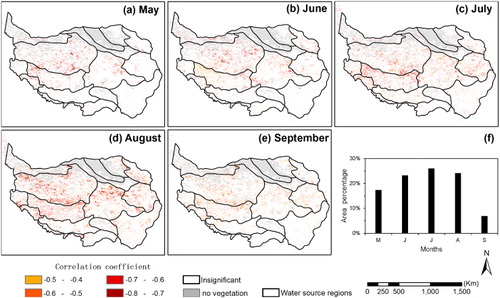
Similar to the distribution of positive correlation, the higher negative correlation between SCDs and May-September NDVI also occurred in June, July, and August (). There was a significant correlation (p < 0.1) between SCD and NDVI for 23.3% of the vegetated areas in June (). The correlation between SCD and NDVI was significant (p < 0.1) for 26.0% of the vegetated area in July (). In August, SCD and NDVI were significantly correlated for 24.2% of the vegetated area (). Fewer areas were found to be significantly correlated with SCDs (p < 0.1) in May and September than that in June, July, and August, with 19.4% and 6.9% of the vegetated areas, respectively. The reasons seem to be the same as we pointed out for the positive correlation. Overall, the positive impacts of snow cover on the Qinghai-Tibetan Plateau overweigh its negative impacts. Therefore, June, July, and August were regarded as the most influenced months of NDVI by snow cover durations in the Qinghai-Tibetan Plateau.
To further investigate the seasonal SCDs that had the dominant influence on vegetation growth, we examined the snow cover durations had the highest positive and negative correlations with NDVI in June, July, and August (). lists the percentages of vegetated areas with the significant correlations (p < 0.1) between different stages of snow cover durations and NDVI in June, July, and August. The most influencing period of SCD on June–August NDVI was from December to February for positive relationships and from March to May for negative relationships in the Qinghai-Tibetan Plateau.
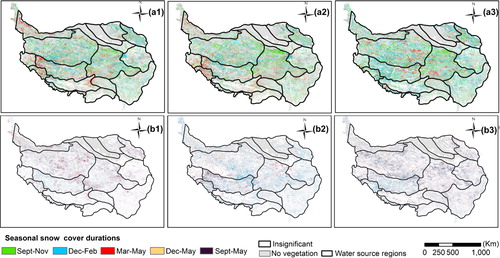
Table 1. Percentages of vegetated areas with significant correlation (p < 0.1) between different stages of snow cover duration and NDVI in June, July, and August.
The correlations between SCDs and NDVI vary among water source regions. In the southwest part of the study area (especially in the Southern Qiangtang and the Central Himalaya Mountains), snow cover in March–May had the most positive influence on NDVI in June and July (–), while snow cover in December–February had more positive impact on NDVI in August in these regions (). Similar phenomenon was found in the northern part of the Central and Western Kunlun Mountains, and the adjoining area of the Source of Three Rivers and Yigong Tsangpo. In contrast, the snow cover in March–May had most positive influence on NDVI in August and the snow cover in September–November and December–February mostly positively influenced NDVI in June and July in the Northern Qiangtang. In the northern part of the Source of Three Rivers, snow cover in September–November had the greatest positive impact on vegetation growth in June, July, and August. For those areas with longer SCDs, snow cover promotes the vegetation growth through increased water availability and the insulating effects of relatively deep snowpack on the soil (Grippa et al. Citation2005; Yan and Onipchenko Citation2006; Peng et al. Citation2010). In addition, longer SCDs usually indicate deeper snow depth that prevents both wind and low temperature from affecting soil temperature. Therefore, soil temperature below deep snow cover is generally higher than that in snow-free areas (Jones Citation1999; Walker et al. Citation1999; Groffman et al. Citation2001; Freppaz et al. Citation2008; Kaste et al. Citation2008), and thus, higher soil temperature could enhance the microbial activities that would benefit vegetation growth through increased soil respiration and nutrient availability (Monson et al. Citation2006) during the growing season. Moreover, deep snow cover protects vegetation against frost damage, dehydration, and physical damage from wind (Walker et al. Citation1999). Snow cover also moderates intensive and deep soil freezing and suppresses soil instability caused by frost and weathering.
Negative impacts of snow cover durations on vegetation in June, July, and August existed throughout the Qinghai-Tibetan Plateau. Snow cover in December–February and March–May mainly prevents vegetation growth (–). For vegetation in June and August, snow cover in March–May had more negative influence than that in December–February. Long duration of snow cover in March–May may lead to late snow melting date, which delays vegetation green-up and leads to low accumulated temperature in summer and decreased vegetation growth. For July, snow cover in December–February was the main seasonal SCD that negatively affected vegetation growth.
Overall, the seasonal SCDs with significant impacts on vegetation growth vary across different regions in the study area. When SCDs in different seasons are considered, the impacts could be positive or negative. Based on our analysis, the area with maximum positive correlation coefficient () is much larger than that of maximum negative correlation coefficient (). Therefore, the positive influence of SCDs on vegetation growth overweighs the negative influence in the plateau. However, when SCD is considered for the periods from December to May and from September to May, its impact on vegetation growth is offset due to both positive and negative impacts. The reason may be the opposite signs of the correlations for different seasonal SCDs. Another reason may be that only one or two specific seasonal SCDs have significant impact on vegetation growth for a certain pixel, but the relationship turns out to be insignificant when adding other seasonal SCDs.
5. Conclusion
Understanding the relationships between snow cover and vegetation activities is essential for estimating the potential effects of climate change in alpine regions. In this study, we examined the effects of snow phenology on vegetation phenology and greenness in the Qinghai-Tibetan Plateau. Our study shows that snow melting date is identified as an important factor affecting green-up date through its effect on PAR and temperature. Vegetation growth usually has strong responses to seasonal snow cover durations. Generally, the December–February and March–May SCDs play significantly roles in vegetation growth, both positively and negatively, depending on different water source regions. However, the positive influence overweighs the negative influence.
Acknowledgements
This work was supported by the National Natural Science Foundation of China (Grant 41271372) and the National Basic Research Program of China (973) (Grant No. 2009CB723906). The work by Lei Ji was performed under USGS contract G13PC00028. Any use of trade, firm, or product names is for descriptive purposes only and does not imply endorsement by the US Government. We would like to thank the anonymous reviewers for valuable comments and suggestions for revising and improving the article.
References
- Asrar, G., M. Fuchs, E. T. Kanemasu, and J. L. Hatfield. 1984. “Estimating Absorbed Photosynthetic Radiation and Leaf Area Index from Spectral Reflectance in Wheat.” Agronomy journal 76 (2): 300–306. doi:10.2134/agronj1984.00021962007600020029x.
- Barr, A. G., T. A. Black, E. H. Hogg, T. J. Griffis, K. Morgenstern, N. Kljun, A. Theede, and Z. Nesic. 2007. “Climate Controls on the Carbon and Water Balances of a Boreal Aspen Forest, 1994–2003.” Global Change Biology 13 (3): 561–576. doi:10.1111/j.1365-2486.2006.01220.x.
- Beck, P. S. A., and S. J. Goetz. 2011. “Satellite Observations of High Northern Latitude Vegetation Productivity Changes between 1982 and 2008: Ecological Variability and Regional Differences.” Environmental Research Letters 6 (4): 045501. doi:10.1088/1748-9326/6/4/045501.
- Beck, P. S. A., and S. J. Goetz. 2012. “Satellite Observations of High Northern Latitude Vegetation Productivity Changes between 1982 and 2008: Ecological Variability and Regional Differences.” Environmental Research Letters 7 (2): 029501. doi:10.1088/1748-9326/7/2/029501.
- Belzile, C., W. F. Vincent, J. A. Gibson, and P. V. Hove. 2001. “Bio-Optical Characteristics of the Snow, Ice, and Water Column of a Perennially Ice-Covered Lake in the High Arctic.” Canadian Journal of Fisheries and Aquatic Sciences 58 (12): 2405–2418. doi:10.1139/f01-187.
- Benedict, J. B. 1990. “Lichen Mortality Due to Late-Lying Snow: Results of a Transplant Study.” Arctic and Alpine Research 22 (1): 81–89. doi:10.2307/1551722.
- Beniston, M., H. F. Diaz, and R. S. Bradley. 1997. “Climatic Change at High Elevation Sites: An Overview.” Climatic Change 36 (3–4): 233–251. doi:10.1023/A:1005380714349.
- Billings, W. D., and L. C. Bliss. 1959. “An Alpine Snowbank Environment and its Effects on Vegetation, Plant Development, and Productivity.” Ecology 40 (3): 388–397. doi:10.2307/1929755.
- Boschetti, M., D. Stroppiana, P. A. Brivio, and S. Bocchi. 2009. “Multi-year Monitoring of Rice Crop Phenology through Time Series Analysis of MODIS Images.” International Journal of Remote Sensing 30 (18): 4643–4662. doi:10.1080/01431160802632249.
- Buus-Hinkler, J., B. U. Hansen, M. P. Tamstorf, and S. B. Pedersen. 2006. “Snow-Vegetation Relations in a High Arctic Ecosystem: Inter-Annual Variability Inferred from new Monitoring and Modeling Concepts.” Remote Sensing of Environment 105 (3): 237–247. doi:10.1016/j.rse.2006.06.016.
- Carrara, A., A. S. Kowalski, J. Neirynck, I. A. Janssens, J. C. Yuste, and R. Ceulemans. 2003. “Net Ecosystem CO2 Exchange of Mixed Forest in Belgium over 5 years.” Agricultural and Forest Meteorology 119 (34): 209–227. doi:10.1016/S0168-1923(03)00120-5.
- Chen, Z., Q. Shao, J. Liu, and J. Wang. 2012. “Analysis of Net Primary Productivity of Terrestrial Vegetation on the Qinghai-Tibetan Plateau, based on MODIS Remote Sensing Data.” Science China-Earth Sciences 55 (8): 1306–1312. doi:10.1007/s11430-012-4389-0.
- Chen, W., Y. Wu, N. Wu, and P. Luo. 2008. “Effect of Snow-Cover Duration on Plant Species Diversity of Alpine Meadows on the Eastern Qinghai-Tibetan Plateau.” Journal of Mountain Science 5 (4): 327–339. doi:10.1007/s11629-008-0182-0.
- De Jong, R., S. de Bruin, A. De Wit, M. E. Schaepman, and D. L. Dent. 2011. “Analysis of Monotonic Greening and Browning Trends from Global NDVI Time-Series.” Remote Sensing of Environment 115 (2): 692–702. doi:10.1016/j.rse.2010.10.011.
- Delbart, N., T. Le Toan, L. Kergoat, and V. Fedotova. 2006. “Remote Sensing of Spring Phenology in Boreal Regions: A Free of Snow-Effect Method Using NOAA-AVHRR and SPOT-VGT Data (1982–2004).” Remote Sensing of Environment 101 (1): 52–62. doi:10.1016/j.rse.2005.11.012.
- Dietz, A. J., C. Kuenzer, and C. Conrad. 2013. “Snow Cover Variability in Central Asia between 2000 and 2011 Derived from Improved MODIS Daily Snow Cover Products.” International Journal of Remote Sensing 34 (11): 3879–3902. doi:10.1080/01431161.2013.767480.
- Dorrepaal, E., R. Aerts, J. H. C. Cornelissen, T. V. Callaghan, and R. S. P. Van Logtestijn. 2004. “Summer Warming and Increased Winter Snow Cover Affect Sphagnum Fuscum Growth, Structure and Production in a Subarctic Bog.” Global Change Biology 10 (1): 93–104. doi:10.1111/j.1365-2486.2003.00718.x.
- Dye, D. G., and C. J. Tucker. 2003. “Seasonality and Trends of Snow-Cover, Vegetation Index, and Temperature in Northern Eurasia.” Geophysical Research Letters 30 (7): 1405. doi:10.1029/2002GL016384.
- Fahnestock, J. T., M. H. Jones, P. D. Brooks, D. A. Walker, and J. M. Welker. 1998. “Winter and Early Spring CO2 Efflux from Tundra Communities of Northern Alaska.” Journal of Geophysical Research: Atmospheres (1984–2012) 103 (D22): 29023–29027.
- Fensholt, R., T. Langanke, K. Rasmussen, A. Reenberg, S. D. Prince, C. Tucker, and R. J. Scholes. 2012. “Greenness in Semi-Arid Areas across the Globe 1981–2007 – An Earth Observing Satellite based Analysis of Trends and Drivers.” Remote Sensing of Environment 121: 144–158. doi:10.1016/j.rse.2012.01.017.
- Freppaz, M., L. Celi, M. Marchelli, and E. Zanini. 2008, “Snow Removal and its Influence on Temperature and N Dynamics in Alpine Soils (Vallee d'Aoste, northwest Italy).” Journal of Plant Nutrition and Soil Science 171 (5): 672–680. doi:10.1002/jpln.200700278.
- Galen, C., and M. L. Stanton. 1993. “Short-term Responses of Alpine Buttercups to Experimental Manipulations of Growing Season Length.” Ecology 74 (4): 1052–1058. doi:10.2307/1940475.
- Galen, C., and M. L. Stanton. 1995. “Responses of Snow Bed Plant Species to Changes in Growing-Season Length.” Ecology 76 (5): 1546–1557. doi:10.2307/1938156.
- Grippa, M., L. Kergoat, T. Le Toan, N. M. Mognard, N. Delbart, J. L'Hermitte, and S. M. Vicente-Serrano. 2005. “The Impact of Snow Depth and Snowmelt on the Vegetation Variability over Central Siberia.” Geophysical Research Letters 32 (21): L21412. doi:10.1029/2005GL024286.
- Groffman, P. M., C. T. Driscoll, T. J. Fahey, J. P. Hardy, R. D. Fitzhugh, and G. L. Tierney. 2001. “Colder Soils in a Warmer World: A Snow Manipulation Study in a Northern Hardwood Forest Ecosystem.” Biogeochemistry 56 (2): 135–150. doi:10.1023/A:1013039830323.
- Hall, D. K., R. E. J. Kelly, G. A. Riggs, A. T. C. Chang, and J. L. Foster. 2002. “Assessment of the Relative Accuracy of Hemispheric-scale Snow-cover Maps.” Annals of Glaciology 34 (1): 24–30. doi:10.3189/172756402781817770.
- Hall, D. K., and G. A. Riggs. 2007. “Accuracy Assessment of the MODIS Snow Products.” Hydrological Processes 21 (12): 1534–1547. doi:10.1002/hyp.6715.
- Hallinger, M., M. Manthey, and M. Wilmking. 2010. “Establishing a Missing Link: Warm Summers and Winter Snow Cover Promote Shrub Expansion into Alpine Tundra in Scandinavia.” New Phytologist 186 (4): 890–899. doi:10.1111/j.1469-8137.2010.03223.x.
- Ho, C.-H., E.-J. Lee, I. Lee, and S.-J. Jeong. 2006. “Earlier Spring in Seoul, Korea.” International Journal of Climatology 26 (14): 2117–2127. doi:10.1002/joc.1356.
- Ichii, K., A. Kawabata, and Y. Yamaguchi. 2002. “Global Correlation Analysis for NDVI and Climatic Variables and NDVI Trends: 1982–1990.” International Journal of Remote Sensing 23 (18): 3873–3878. doi:10.1080/01431160110119416.
- Jones, H. G. 1999. “The Ecology of Snow-covered Systems: A Brief Overview of Nutrient Cycling and Life in the Cold.” Hydrological Processes 13 (14–15): 2135–2147. doi:10.1002/(SICI)1099-1085(199910)13:14/15<3C2135::AID-HYP862>3.0.CO;2-Y.
- Jönsson, P., and L. Eklundh. 2004. “TIMESAT – A Program for Analyzing Time-series of Satellite Sensor Data.” Computers & Geosciences 30 (8): 833–845. doi:10.1016/j.cageo.2004.05.006.
- Kaste, Ø., K. Austnes, L. S. Vestgarden, and R. F. Wright. 2008. “Manipulation of Snow in Small Headwater Catchments at Storgama, Norway: Effects on Leaching of Inorganic Nitrogen.” AMBIO: A Journal of the Human Environment 37 (1): 29–37. doi:10.1579/0044-7447(2008)37[29:MOSISH]2.0.CO;2.
- Knight, D. H., S. W. Weaver, C. R. Starr, and W. H. Romme. 1979. “Differential Response of Subalpine Meadow Vegetation to Snow Augmentation.” Journal of Range Management 32 (5): 356–359. doi:10.2307/3898015.
- Levis, S., and G. B. Bonan. 2004. “Simulating Springtime Temperature Patterns in the Community Atmosphere Model Coupled to the Community Land Model Using Prognostic Leaf Area.” Journal of Climate 17 (23): 4531–4540. doi:10.1175/3218.1.
- Li, X., G. Cheng, H. Jin, E. Kang, T. Che, R. Jin, L. Z. Wu, Z. T. Nan, J. Wang, and Y. P. Shen. 2008. “Cryospheric Change in China.” Global and Planetary Change 62 (34): 210–218. doi:10.1016/j.gloplacha.2008.02.001.
- Li,Y., R. Zhang, X. Jia, G. Wang, L. Zhao, and Y. Ding. 2010. “Influence of Alpine Meadow Land Cover Differences on Precipitation-runoff Processes on the Qinghai-Tibetan Plateau, China.” Environmental Engineering Science 27 (2): 209–213. doi:10.1089/ees.2008.0325.
- Millett, B., W. C. Johnson, and G. Guntenspergen. 2009. “Climate Trends of the North American Prairie Pothole Region 1906–2000.” Climatic Change 93 (1–2): 243–267. doi:10.1007/s10584-008-9543-5.
- Monson, R. K., D. L. Lipson, S. P. Burns, A. A. Turnipseed, A. C. Delany, M. W. Williams, and S. K. Schmidt. 2006. “Winter Forest Soil Respiration Controlled by Climate and Microbial Community Composition.” Nature 439 (7077): 711–714. doi:10.1038/nature04555.
- Myneni, R. B., F. G. Hall, P. J. Sellers, and A. L. Marshak. 1995. “The Interpretation of Spectral Vegetation Indexes.” Geoscience and Remote Sensing, IEEE Transactions on 33 (2): 481–486. doi:10.1109/36.377948.
- Myneni, R. B., C. D. Keeling, C. J. Tucker, G. Asrar, and R. R. Nemani. 1997. “Increased Plant Growth in the Northern High Latitudes from 1981 to 1991.” Nature 386 (6626): 698–702. doi:10.1038/386698a0.
- Nemani, R., M. White, P. Thornton, K. Nishida, S. Reddy, J. Jenkins, and S. Running. 2002. “Recent Trends in Hydrologic Balance Have Enhanced the Terrestrial Carbon Sink in the United States.” Geophysical Research Letters 29 (10): 1468. doi:10.1029/2002GL014867.
- Nobrega, S., and P. Grogan. 2007. “Deeper Snow Enhances Winter Respiration from Both Plant Associated and Bulk Soil Carbon Pools in Birch Hummock Tundra.” Ecosystems 10 (3): 419–431. doi:10.1007/s10021-007-9033-z.
- Ozanne, C. M. P., D. Anhuf, S. L. Boulter, M. Keller, R. L. Kitching, C. Körner, and F. C. Meinzer, et al. 2003. “Biodiversity Meets the Atmosphere: A Global View of Forest Canopies.” Science 301 (5630): 183–186. doi:10.1126/science.1084507.
- Parent, M. B., and D. Verbyla. 2010. “The Browning of Alaska's Boreal Forest.” Remote Sensing 2 (12): 2729–2747. doi:10.3390/rs2122729.
- Peng, J., Z. Liu, Y. Liu, J. Wu, and Y. Han. 2012. “Trend Analysis of Vegetation Dynamics in Qinghai–Tibet Plateau using Hurst Exponent.” Ecological Indicators 14 (1): 28–39. doi:10.1016/j.ecolind.2011.08.011.
- Peng, S., S. Piao, P. Ciais, J. Fang, and X. Wang. 2010. “Change in Winter Snow Depth and its Impacts on Vegetation in China.” Global Change Biology 16 (11): 3004–3013.
- Piao, S., P. Friedlingstein, P. Ciais, N. Viovy, and J. Demarty. 2007. “Growing Season Extension and its Impact on Terrestrial Carbon Cycle in the Northern Hemisphere Over the last 2 Decades.” Global Biogeochemical Cycles 21 (3): GB3018. doi:10.1029/2006GB002888.
- Pu, Z., and L. Xu. 2009. “MODIS/Terra Observed Snow Cover over the Tibet Plateau: Distribution, Variation and Possible Connection with the East Asian Summer Monsoon (EASM).” Theoretical and Applied Climatology 97 (3–4): 265–278. doi:10.1007/s00704-008-0074-9.
- Pu, Z., L. Xu, and V. V. Salomonson. 2007. “MODIS/Terra Observed Seasonal Variations of Snow Cover over the Tibetan Plateau.” Geophysical Research Letters 34 (6): L06706. doi:10.1029/2007GL029262.
- Qin, D. H., S. Y. Liu, and P. J. Li. 2006. “Snow Cover Distribution, Variability, and Response to Climate Change in western China.” Journal of Climate 19 (9): 1820–1833. doi:10.1175/JCLI3694.1.
- Rouse, J. W., D. W. Deering, J. A. Schell, and J. C. Harlan. 1974. Monitoring the Vernal Advancement of Retrogradation (Green Wave Effect) of Natural Vegetation. Texas A & M University, Remote Sensing Center. http://ntrs.nasa.gov/archive/nasa/casi.ntrs.nasa.gov/19740004927_1974004927.pdf.
- Stockli, R., T. Rutishauser, I. Baker, M. A. Liniger, and A. S. Denning. 2011. “A Global Reanalysis of Vegetation Phenology.” Journal of Geophysical Research-Bio geosciences 116 (G3): G03020. doi:10.1029/2010JG001545.
- Thomey, M. L., S. L. Collins, R. Vargas, J. E. Johnson, R. F. Brown, D. O. Natvig, and M. T. Friggens. 2011. “Effect of Precipitation Variability on Net Primary Production and Soil Respiration in a Chihuahuan Desert grassland.” Global Change Biology 17 (4): 1505–1515. doi:10.1111/j.1365-2486.2010.02363.x.
- Totland, Ø., and J. M. Alatalo. 2002. “Effects of Temperature and Date of Snowmelt on Growth, Reproduction, and Flowering Phenology in the Arctic/Alpine Herb, Ranunculus Glacialis.” Oecologia 133 (2): 168–175. doi:10.1007/s00442-002-1028-z.
- Tucker, C. J., D. A. Slayback, J. E. Pinzon, S. O. Los, R. B. Myneni, and M. G. Taylor. 2001. “Higher Northern Latitude Normalized Difference Vegetation Index and Growing Season Trends from 1982 to 1999.” International Journal of Biometeorology 45 (4): 184–190. doi:10.1007/s00484-001-0109-8.
- Voronin, P. Y., L. A. Ivanova, D. A. Ronzhina, L. A. Ivanov, O. A. Anenkhonov, C. C. Black, P. D. Gunin, and V. I. P'yankov. 2003. “Structural and Functional Changes in the Leaves of Plants from Steppe Communities as Affected by Aridization of the Eurasian Climate.” Russian Journal of Plant Physiology 50 (5): 604–611. doi:10.1023/A:1025627805206.
- Walker, M. D., D. A. Walker, J. M. Welker, A. M. Arft, T. Bardsley, P. D. Brooks, and J. T. Fahnestock, et al. 1999. “Long-term Experimental Manipulation of Winter Snow Regime and Summer Temperature in Arctic and Alpine Tundra.” Hydrological Processes 13 (1415): 2315–2330. doi:10.1002/(SICI)1099-1085(199910)13:14/15%3C2315::AID-HYP888%3E3.0.CO;2-A.
- Walther, G. R., E. Post, P. Convey, A. Menzel, C. Parmesan, T. J. Beebee, J. M. Fromentin, O. H. Guldberg, and F. Bairlein. 2002. “Ecological Responses to Recent Climate Change. Nature 416 (6879): 389–395. doi:10.1038/416389a.
- Wang, C., F. B. Fritschi, G. Stacey, and Z. Yang. 2011. “Phenology-based Assessment of Perennial Energy Crops in North American Tallgrass Prairie.” Annals of the Association of American Geographers 101 (4): 742–751. doi:10.1080/00045608.2011.567934.
- Wang, X., and H. Xie. 2009. “New Methods for Studying the Spatiotemporal Variation of Snow Cover based on Combination Products of MODIS Terra and Aqua.” Journal of Hydrology 371 (14): 192–200. doi:10.1016/j.jhydrol.2009.03.028.
- Wang, X.W., H. J. Xie, and T. G. T. Liang. 2008. “Evaluation of MODIS Snow Cover and Cloud Mask and its Application in Northern Xinjiang, China.” Remote Sensing of Environment 112 (4): 1497–1513. doi:10.1016/j.rse.2007.05.016.
- Xiao, J., and A. Moody. 2005. “Geographical Distribution of Global Greening Trends and their Climatic Correlates: 1982–1998.” International Journal of Remote Sensing 26 (11): 2371–2390. doi:10.1080/01431160500033682.
- Xiao, X., B. Moore Iii, X. Qin, Z. Shen, and S. Boles. 2002. “Large-scale Observations of Alpine Snow and Ice cover in Asia: Using Multi-temporal Vegetation Sensor Data.” International Journal of Remote Sensing 23 (11): 2213–2228. doi:10.1080/01431160110076180.
- Xu, S.X., X. Q. Zhao, Y. L. Fu, L. Zhao, Y. N. Li, G. M. Gao, and S. Gu. 2005. “Characterizing CO2 Fluxes for Growing and Non-growing Seasons in a shrub Ecosystem on the Qinghai–Tibetan Plateau.” Science in China Series D-Earth Sciences 48 (z1): 133–140.
- Yan, W., and V. G. Onipchenko. 2006. “Relation of the Snow Cover to the Structure of Vegatation in the Alpine Communities of the Eastern Tsinghai-Tibet Plateau.” Zhurnal Obshchei Biologii 67 (6): 452–463.
- Ye, D. -Z., and G. -X. Wu. 1998. “The Role of the Heat Source of the Tibetan Plateau in the General Circulation.” Meteorology and Atmospheric Physics 67(1–4): 181–198. doi:10.1007/BF01277509.
- Yu, Z., G. X. Wang, and Y. B. Wang. 2010. “Response of Biomass Spatial Pattern of Alpine Vegetation to Climate Change in Permafrost Region of the Qinghai–Tibetan Plateau, China.” Journal of Mountain Science 7 (4): 301–314. doi:10.1007/s11629-010-2011-5.
- Zhang, L., H. D. Guo, L. Ji, L. P. Lei, C. Z. Wang, D. M. Yan, B. Li, and J. Li. 2013. “Vegetation Greenness Trend (2000–2009) and the Climate Controls in the Qinghai-Tibetan Plateau.” Journal of Applied Remote Sensing 7 (1): 73572. doi:10.1117/1.JRS.7.073572.
- Zhang, J., and J. E. Walsh. 2007. “Relative Impacts of Vegetation Coverage and Leaf Area Index on Climate Change in a Greener North.” Geophysical Research Letters 34 (15): L15703. doi:10.1029/2007GL030852.
- Zhou, L., C. J. Tucker, R. K. Kaufmann, D. Slayback, N. V. Shabanov, and R. B. Myneni. 2001. “Variations in Northern Vegetation Activity Inferred from Satellite data of Vegetation Index during 1981 to 1999.” Journal of Geophysical Research-Atmospheres 106 (D17): 20069–20083. doi:10.1029/2000JD000115.
- Zhou, X. B., H. J. Xie, and J. M. H. Hendrickx. 2005. “Statistical Evaluation of Remotely Sensed Snow-cover Products with Constraints from Stream Flow and SNOTEL Measurements.” Remote Sensing of Environment 94 (2): 214–231. doi:10.1016/j.rse.2004.10.007.
- Zhu, J., J. C. Shi, and Y. H. Wang. 2012. “Subpixel Snow Mapping of the Qinghai–Tibetan Plateau using MODIS data.” International Journal of Applied Earth Observation and Geoinformation 18: 251–226. doi:10.1016/j.jag.2012.02.001.