
Abstract
Volunteered data sources are readily available due to advances in electronic communications technology. For example, smartphones provide tools to collect ground-based observations over broad areas from a diverse set of data collectors, including people with, and without, extensive training. In this study, volunteers used a smartphone application to collect ground-based observations. Forest structural components were then estimated over a broader area using high spatial resolution RapidEye remote sensing imagery (5 spectral bands 440–850 nm, 5 m spatial resolution) and a digital elevation model following a three nearest neighbor approach (K-NN). Participants with professional forestry experience on average chose high-priority fuel load locations near buildings, while nonprofessional participants chose a broader range of conditions over a larger extent. When used together, the professional and nonprofessional observations provided a more complete assessment of forest conditions. A generalized framework is presented that utilizes K-NN imputation tools for estimating the distribution of forest fuels using remote sensing and topography variables, ensuring spatial representation, checking attribute accuracy, and evaluating predictor variables. Frameworks to integrate volunteered data from smartphone platforms with remote sensing may contribute toward more complete Earth observation for Digital Earth.
1. Introduction
Public participation in scientific research (PPSR; also called citizen science) includes projects where explicit scientific credentials are not required to take part in the research process (Bonney et al. Citation2009). Approaches inspired by PPSR can lead to a variety of outcomes, including advancement of science (by collecting new scientific data or performing an analysis that would be otherwise be prohibitively expensive), advances for the individuals who participate (e.g. opportunities to pursue interests, learn new skills or practice existing skills, provision of technical tools related to an interest and access to generated data, engagement with people with similar interests, and the potential to influence management decisions), and improved resource management (by providing more information for making decisions and by providing feedback for adaptive management; Shirk et al. Citation2012). For example, the North American Breeding Bird Survey (Sauer et al. Citation2005) and eBird (Sullivan et al. Citation2014) provide information about avian species distributions at a continental scale using data collected by volunteers. In return, volunteers receive access to tools illustrating sightings and maps that can be useful for birdwatching, prestige within the community by sharing lists of observations, and contribute to information that can help inform management strategies. In astronomy, volunteers have helped classify 100 millions of images of galaxies and engaged in discussions the findings (Raddick et al. Citation2010). More recently, there has been an increase in focus on activities collecting data to inform resource management decisions, since these processes are also informed by science.
PPSR may serve a variety of roles in the context of Earth observation. First, volunteers may help with data collection. Lillesand (Citation2002) utilized data collected by volunteers in combination with spectral remote sensing measurements to calibrate models of water clarity that were used by resource managers. Modern electronic communication devices, such as smartphones, provide increasing opportunities for volunteers to collect data, in particular because of the following factors: they are available to an increasing number of people; they are equipped with a touchscreen for delivering instructions and entering data; they are equipped with sensors such as a camera, accelerometer, gyrometer, and global positioning system (GPS); they have the ability to store data in memory and transfer them over a network; they have the ability provided by application stores to distribute an application to a wide audience for rapid installation; and they have the potential to engage broad audiences in collaborative projects and seek input and discussion (Ferster and Coops Citation2013). A small but growing number of remote sensing projects have used smartphones to collect data or PPSR inspired approaches. For example, Pratihast et al. (Citation2013) tested a smartphone application for inexperienced forestry workers to collect land cover and land cover change information. The study showed that inexperienced data collectors were able to collect data that were comparable to more highly trained workers. Additionally, more spatially extensive and temporally frequent measurements were provided using the application than a similar paper-based implementation (Pratihast et al. Citation2014). Gumley et al. (Citation2010) designed a smartphone application and distributed publicly to record atmospheric conditions and land cover coinciding with satellite overpasses. In the GeoWiki project, volunteers assessed land cover from remotely sensed imagery to help with model building and validation (See et al. Citation2013).
Major advances have also arisen in from the use of volunteered data available on the Internet in the field of volunteered geographic information (Goodchild Citation2007). For example, Bakillah et al. (Citation2014) utilized volunteered data to use as ancillary variables in fine-scale population mapping within cities, demonstrating that public amenities mapped by volunteers in the Open StreetMap (OSM) project (https://www.openstreetmap.org), including public transportation features, restaurants, and post office boxes (amongst others), were associated with areas of concentrations of urban population within cities. To map land use, Jokar Arsanjani et al. (Citation2013) used volunteered spatial data from OSM to map land cover in an urban environment and compared the resulting maps with official land cover maps prepared by government organizations. Jokar Arsanjani et al. (Citation2013) found that OSM data provided advantages in that it was suitable to map land cover in urban areas without using remote sensing or city administration data, was freely available online, and was an ‘alive’ and dynamic dataset that continuously evolved along with land use changes. However, the authors observed limitations in OSM data that were collected with unknown accuracy and not following official protocol, leaving some locations with incomplete data. Notably, the officially collected reference data also included errors. Finally, Jokar Arsanjani et al. (Citation2013) used OSM in combination with RapidEye satellite remote sensing data to perform a supervised maximum likelihood classification of urban land use. The volunteered OSM data were used in place of traditional in situ data collection for training and validation, and the land-use products had comparable accuracy to official land cover maps, thus demonstrating the potential of volunteered datasets to be used in combination with remote sensing for land use monitoring and mapping.
Volunteered data collection also fills an increasingly important role in Digital Earth, the three-dimensional, multi-scale digital representation of all geographic information (Gore Citation1998) as an avenue to generate ‘dynamic flows of social and environmental interactions by exploring new … opportunities provided by social networks and citizens'-contributed information’ (Craglia et al. Citation2012). Through citizen participation in Earth observation, there are opportunities to better connect scientists with citizens (and resource managers), opportunities to address societal challenges, and increase the capacity to observe, protect, and gain an understanding of and appreciation for the environment (Ehlers et al. Citation2014).
Approaches to involve citizens take a variety of forms. For example, Craglia et al. (Citation2012) developed a framework to detect forest fires using textual information from social media that addressed the challenges of (1) large volumes of data, (2) unstructured nature of the data, and (3) unknown quality of the data. Citizen data collection may also take the form of specialized applications to meet Earth observations needs (Ferster and Coops Citation2013). Further development of frameworks is needed to address the many different types of volunteer-generated information and integrate it with other data sources, so that it can be utilized within the context of Digital Earth, and to explore the potential roles of citizen data collection and interaction.
One natural resource research topic where there is potential to utilize field data collected by volunteers, in combination with data from satellite remote sensing, is the measurement of forest fuel loading. Forest fuels are forest structural components fuel wildfires that present hazards to communities (Hardy Citation2005). In wildland-urban interface (WUI) areas, where human development interfaces with wild areas, homes and other community infrastructure can be threatened by wildfire (Radeloff et al. Citation2005). In addition, policies of wildfire exclusion have led to an accumulation of fuels, resulting in more intense and severe wildfires, and therefore fuels reduction treatments aiming to reduce or modify the amount and arrangement of fuels at a location are necessary to mitigate hazards to communities where wildfire occurs (Agee and Skinner Citation2005). To identify fire hazards and coordinate fuels treatments, fire managers need data on fuels loading as an input to fire behavior models and geographic information systems (Arroyo, Pascual, and Manzanera Citation2008).
Several studies have utilized remote sensing approaches to estimate the spatial distribution of forest fuels. Falkowski et al. (Citation2005) employed a multifaceted approach including maximum likelihood classification of cover type and structural stage, potential vegetation type from the classification of edaphic conditions, and linear modeling of the forest canopy using multispectral remote sensing from the Advanced Spaceborne Thermal Emission and Reflection Radiometer sensor using bands with 15 m spatial resolution. High spatial resolution sensors such as airborne scanning lasers can provide detailed information about canopy fuel loading (e.g. Hermosilla et al. Citation2014). Peterson and Franklin (Citation2012) utilized topographic variables and multispectral remote sensing from Landsat Thematic Mapper and Enhanced Thematic Mapper to map forest fuels in Yosemite National Park. However, there remain challenges in measuring forest fuels using remote sensing from above-canopy platforms because many of the fuels components are located near the ground and can be obscured by overstory trees (Keane, Burgan, and Van Wagtendonk Citation2001). Therefore, collecting ground-based measurements is still essential to understanding the quantity, arrangement, and spatial distribution of forest fuels. While ground collection is thus necessary, collecting these measurements is also a major challenge given the broad areas that are influenced by wildfire, the large spatial variation within stands, and the rapid changes that can happen in fuel loadings (e.g. in areas where blowdown occurs following storms; Keane, Burgan, and Van Wagtendonk Citation2001).
The RapidEye remote sensing platform has potential to meet several of the challenges of remote sensing forest fuels because of its relatively fine spatial resolution, frequent temporal resolution, and the multi-spectral resolution of its bands. RapidEye provides imagery with a nominal spatial resolution of 5 m suitable for providing information about small vegetation patches and canopy patterns that may pose localized hazards in communities. Additionally, the data are provided by a constellation of five satellites equipped with push-broom scanners with a 77-km swath, providing a unique ability to acquire fine spatial resolution imagery with a relatively rapid 5.5 day revisit time, or less (1 day), if off-nadir imagery is used. RapidEye imagery has been used to track disturbance in near-real time with finer spatial resolution than is possible using other sensor (such as Landsat ETM or MODIS; Arnett et al. Citation2014). Therefore, methods that are developed for forest fuels mapping can be applied to monitoring for rapid changes in conditions. The sensor provides five bands (440–850 nm), including a ‘red-edge’ band (690–730 nm). In vegetation studies, the use of the RapidEye red-edge band and related indices have detected vegetation stress earlier than using the near-infrared bands (Eitel et al. Citation2011) and improved classification of open vegetation types such as bush vegetation and perennial herbs (Schuster, Förster, and Kleinschmit Citation2012). The ability to distinguish understory vegetation and the forest canopy is important for accurate mapping of fuels components (Falkowski et al. Citation2005; Riaño and Chuvieco Citation2002). In particular, the RapidEye red-edge band and derived indices may have utility for distinguishing the forest canopy from understory shrub and herb layers when they are in, or approaching, a senesced state.
Forest managers also run public outreach programs to encourage home owners to practice fire reducing landscaping (Cohen Citation2000) and to gain public support for treatment programs on public land (Harris, McGee, and McFarlane Citation2011). Public perceptions of trust in forest managers' actions have been related to knowledge of wildfire processes (Toman, Shindler, and Brunson Citation2006) and trustworthy relations over time (Shindler, Toman, and McCaffrey Citation2009). Utilizing PPSR inspired approaches may provide an opportunity to collect more information for wildfire managers, while concurrently increasing public knowledge and engagement related to wildfire issues and building citizen-agency trust. This theory was explored by Ferster et al. (Citation2013), wherein a smartphone application was developed to measure forest fuel loading by volunteers in a WUI area. Volunteers made observations about the quantity and arrangement of fuels based on reference images following the PhotoLoad and PhotoSeries approaches (Sikkink and Keane Citation2008) and collected images using the camera and location using the GPS. The observations were exported in tabular format and collected for analysis on a central server. The volunteers were given questionnaires before and after data collection to better understand their perspectives on the connectivity of new technology and forest management activities, including the volunteers' motivations for volunteering, previous experiences with wildfire, experiences using the application, and expectations of privacy and fairness of data use (Ferster et al. Citation2013). The volunteered measurement plots were revisited by the research team to collect reference measurements for comparison, and the quality of the data was assessed. Ferster and Coops (Citation2014) found that for many components (e.g. large woody debris, surface vegetation coverage, crown closure) the measurements by nonprofessionals were comparable to measurements by professionals. However, to gain a more complete picture of how data collection by volunteers using a smartphone application can fit into a forest management context, these data need to be integrated with data from other sources, such as remote sensing and topography, and used to estimate fuel loading over broader areas.
The purpose of this study is to identify and evaluate methods of integrating ground-based observations collected by volunteers using smartphones with remote sensing data to estimate forests fuels loading within a WUI area. Volunteers used the smartphone application designed by the research team to collect observations of forest fuels loading. The observations were used to perform a K-NN imputation of multiple forest fuels components using vegetation indices derived from multispectral RapidEye imagery (5 m spatial resolution). Geolocation was matched using imagery collected by the smartphone's camera and the RapidEye imagery to evaluate the differences in distance related to GPS precision. To provide practical insights into the professional and nonprofessional data, independent subsets were selected and modeled, to evaluate the effects of different levels of volunteer experience. Lastly, based on the experience from this project, a framework is developed and presented to help coordinate future volunteer efforts when considering use of these types of data in Earth observation studies. The integration of citizen generated environmental content with remotely sensed and other geospatial data is applicable to a wide range of applications, and as a result the methods developed in this paper have relevance beyond forest fuel assessment. This work therefore demonstrates important first steps for integrating smartphone measurements and multispectral remote sensing for a broad range of topics.
2. Methods
The study area was located in Kelowna, British Columbia, Canada. In this region, there is substantial development in WUI areas in the Ponderosa Pine biogeoclimatic zone, which is characterized by a mix of grassland and forest with vegetation that is adapted to wildfire (Hope et al. Citation1991). The vegetation at the site corresponded with the mature and immature lodgepole pine fuel types (C3 and C4 respectively) in the Canadian Fire Behaviour Prediction System (Taylor, Pike, and Alexander Citation1997). These fuels models are characterized by dense lodgepole pine (Pinus contorta sub sp. latifolia), continuous moss or needle little coverage on the forest floor, low shrub and herb cover, low numbers of understory stems in mature stands and high numbers in younger stands, dry soil, and a range of woody debris loadings (at the study site woody debris loading was mainly related to stand treatments related to a recent mountain pine beetle Dendroctonus ponderosae epidemic in the region; Taylor, Pike, and Alexander Citation1997). A study area boundary was delimited to include publicly accessible forested areas covering 52 ha within comfortable walking distance of the study meeting point, and approximately 1 hour was allocated to each participant. The study start point was accessible by car, bicycle, or public transportation. Details of recruitment strategy to obtain volunteers, the smart phone application, and the experiment are provided in Ferster et al. (Citation2013) and Ferster and Coops (Citation2014), and a short summary follows. Volunteers were recruited by contacting nearby neighborhood associations, outdoors clubs, and through placement of posters, classified advertisements, and local media coverage. A substantial proportion (50 %) of the participants indicated that they had extensive working experience in forestry including operational foresters, wildfire specialists, and community foresters (the separation was based on statement of experience rather than professional title). To simulate an opportunistic dataset, volunteers were directed to collect data in publicly accessible areas of interest.
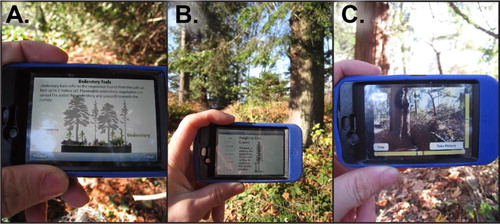
Volunteers collected observations of forest fuels loading and arrangement using the ForestFuels smartphone application (). The ForestFuels application was implemented for iOS 6.1 and can be implemented for any smartphone platform that features a touch screen (for displaying instructions and recording observations by selecting buttons, menus, or entering free-form text), data storage (to store the observations and collected imagery), GPS (to measure location), compass (to measure direction), accelerometer (to measure slope and to ensure the device is correctly oriented and level while collecting images of site conditions), and a camera (to record imagery of the site conditions). The application has three parts: (1) introductory slides that provide an overview of forest fuels management topics and activities (); (2) recording observations of forest fuels loading and arrangement by selecting components from menus and selecting buttons next to descriptive images and measurement of slope and aspect using the compass and inclinometer (); (3) collecting imagery of site conditions and measurement of spatial location using the GPS (). Compared to a paper-based approach, the smartphone application provides potential for distribution to large audiences of volunteers using application stores; the ability to recruit participants and facilitate collaboration between participants such as discussion, dissemination, and action upon results using social media tools (Dickinson and Crain Citation2014; Erickson, Kellogg, and Watson Citation2000); in situ observation of forest structural components under dense forest canopies, complementing constellations of Earth observing satellites; and higher levels of engagement in community forest data collection activities (Pratihast et al. Citation2014).
While collecting data, participants were accompanied by at least one member of the research team. A flagging tape marker was placed, and the research team revisited the volunteered plot following the volunteer measurements to collect reference measurements for comparison (see Ferster and Coops Citation2014 for details). The forest fuels components and data collection tasks are given in . The procedures and generated output were designed to be compatible with regional protocols (Morrow, Johnston, and Davies Citation2008) so that the data may be used with other previously collected sources. Following a Forest Fuels PhotoSeries inspired approach (originally developed by Maxwell and Ward Citation1976), the participants made visual estimations based on reference diagrams and estimated the appropriate fuels loading category. Sikkink and Keane (Citation2008) compared a variety of forest fuels measurement and estimation techniques and found that ocular estimation methods, such as the Forest Fuels PhotoSeries approach, could provide data of sufficient accuracy for forest fuels management, while requiring less time to complete an assessment than direct measurement approaches, providing that adequate training is provided. In the case of the Forest Fuels Application, training was provided by the application. Ferster and Coops (Citation2014) evaluated attribute accuracy using the ForestFuels application by comparing measurements made by volunteers with and without working experience in forestry. For many components, the estimations were comparable, while nonprofessional volunteers provided more consistent observations of height-to-live crown, professional volunteers had greater skill at measuring slope and aspect, and few volunteers provided accurate estimations of understory stem estimations. In this study, models of site-level estimations were made using both the raw volunteered data and the reference data. For this analysis, the quantitative mid-point of each category was assigned to the observation.
Table 1. Forest fuel components and procedures measured by volunteers using the smartphone application and reference measurements collected by the research team.
RapidEye multispectral imagery with 5-m spatial resolution was acquired on 28 July 2013, coincident with the field program. The image was orthorectified by the vendor using nearest neighbor resampling. A dark object subtraction was applied to correct for atmospheric scattering using ENVI 5.0 (Exelis Visual Information Solutions, Boulder, CO; Chavez Citation1996), and vegetation indices were calculated (). Additionally, a digital elevation model was used with a 30-m spatial resolution (CDED Citation2014).
Table 2. Calculation of indices and variables.
To understand the potential errors in horizontal positional accuracy using the smartphone GPS measurements and to ensure that the volunteered smartphone measurements were reasonably matched in location with the RapidEye imagery, several steps were taken. First, the GPS coordinates were compared between those collected by the participants and those collected by the research team. From the two sets of measurements, the set with the lowest device reported error was used to position the measurement on the map. Second, the Event Visualization Tool (eVis) version 1.2.0 software (Ersts, Horning, and Koy Citation2013) was used to review the five site photographs of each plot and compare them with vegetation patterns visible in the RapidEye imagery. The eVis tool was used to review the collected data, captured images, and geolocation within a GIS environment and to compare with remote sensing imagery. Where volunteered measurements were observed in locations very different than the canopy cover or landcover observed in the RapidEye scene, the plot was moved to the location that best represented the vegetation patterns visible in the site pictures. Finally, the distance moved was calculated as the Euclidian distance from the original volunteered location to the location that was determined to be the best match for the remote sensing imagery.
To estimate the spatial distribution of forest fuels at the study site, a K-NN (K = 3) imputation was performed using R version 3.0.3 (R Development Core Team Citation2011) and the yaImpute package version 1.0–20 (Crookston and Finley Citation2008). K-NN is a classification technique that uses predictor variables that are available for a wide area (such as remote sensing or topography cover ages) to estimate the quantity of an unknown target variable that was measured at a subset of the locations (in this case, forest fuels loading). A distance measure is used to calculate similarity between the targets and the predictors, and the attributes can be calculated as an inverse distance weighted mean of the K nearest neighbors. For this study, the Mahalanobis distance (Mahalanobis Citation1936) was used for a number of reasons, including its demonstrated ability to predict forest attributes (Hudak et al. Citation2008), scale invariance, consideration of correlation between predictor variables (Chirici Citation2012), intuitive interpretation, and since the distances are calculated using only to the predictor variables, it allows direct comparison of distances for models that were built with different training data. This latter point allows, in our application, utility for directing future sampling efforts. All predictor variables were used in the imputation; however, as more data are collected and the relationships between predictor and response variables are better understood, building more specific models may result in more reliable and powerful predictions (see Section 4.4). A canonical correlation analysis (using procedure in Sherry and Henson (Citation2005)) was undertaken using SAS 9.3 (SAS Institute, Cary, NC) to understand the relationship between the predictor variables and the targets (as suggested by Packalen, Temesgen, and Maltamo Citation2012). In addition, the Mahalanobis distance was mapped to see how well areas were represented by the reference observations. Finally, the imputed surfaces for the entire extent and distance maps were used with an orthorectified aerial photograph acquired in 2012 for presentation (Open Data Catalogue Citation2014).
An initial examination of the distribution of the volunteered plots indicated that almost all of the plots were collected in closed-canopy forested areas. Even in relatively open areas of forest, the volunteered plots were located in small isolated patches of closed canopy, indicating potential for significant underrepresentation of open-canopied forested areas. As a result, to augment the volunteer observations four additional image-based plots were established in more open areas, directly adjacent to existing plots by experts where it was possible to observe site conditions from site photos from the adjacent observations (not more than 20 m distance and a clear line of sight).
To evaluate the K-NN models, the root mean squared difference (RMSD) was calculated using a leave-one-out cross-validation (LOOCV) approach for the data used to build the model augmented with the RMSD between imputed and measured values for all of the reference data collected by the research team. LOOCV techniques are commonly employed to evaluate the accuracy and reliability of nearest neighbor imputations (Mullin Citation1997; Packalen, Temesgen, and Maltamo Citation2012; Ver Hoef and Temesgen Citation2013). Since the RMSD of K-NN models is sensitive to the number of near neighbors in a dataset (Stage and Crookston Citation2007), using LOOCV, provides a more manageable number of near neighbors when working with smaller datasets compared with retaining an independent sample. Three models were built with subsets of the data (using all observations, only observations by forest professionals, and only observations by nonforest professionals), and the RMSD was calculated using the reference observations collected by the research team (including the data used to build the model following a LOOCV approach, augmented with all other available reference data using the RMSD between the imputed value and the reference measurement). As described by Stage and Crookston (Citation2007), the RMSD contains error from the following sources of error: (1) measurement error, (2) pure error (due to the predictor variables not representing the pattern or error in the spatial resolution), (3) the availability of observations to act as a surrogate for the target (related to the spatial representativeness of the training data), and (4) the choice of K (the number of near neighbors used in the imputation), number of reference observations, and the relative weights. By evaluating these sources of error, it is possible to evaluate the ‘relative gains of reducing measurement error versus increasing the density of sampled observation units’ (Stage and Crookston Citation2007). In this study, all of the sources of error were evaluated using K-NN imputation as a tool to integrate the remote sensing, topography, and volunteered smartphone data sources for larger area predictions and to evaluate sources of error to improve future volunteered-data collection efforts. In order to assess the predictive capacity of the RapidEye spectral bands and the additional elevation data to the dependent variables, a canonical correlation analysis was then conducted. Finally, the K-NN model was performed and evaluated with different combinations of professional and nonprofessional volunteers. Random combinations of volunteers were selected from 0 to 9 of the professionals and nonprofessionals, each repeated 10 times. These comparisons were evaluated by calculating the RMSD using the full suite of reference observations.
3. Results
3.1. Spatial registration
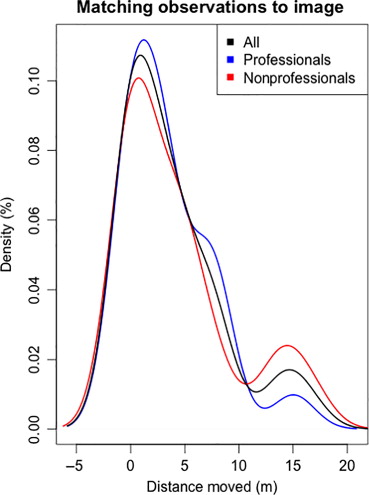
The median distance needed to match the location of the smartphone data with the RapidEye imagery was 3.0 m, which was slightly further for forestry professionals (3.6 m) and slightly closer for nonprofessionals (2.9 m; and ). The mean differences were much larger than the medians due to a small number of observations which required very large positional shifts (one for a forest professional at 209 m and one for a nonprofessional at 564 m). The positional shift had a week positive correlation with canopy cover (Pearson's r = 0.18).
Table 3. Amount observations were moved to match the image.
3.2. Field data
Several patterns were evident in the forest fuels observations. High canopy closure was associated with high amounts of woody debris, higher understory stem densities, and lesser amounts of understory vegetation. Locations with high amounts of large woody debris also had high understory stem densities. The previous two conditions may be related to the woody debris increasing soil moisture, which in turn promotes tree growth that restricts light for understory vegetation. Locations with high amounts of understory vegetation also had lower amounts of fine woody debris, likely due to the presence of more open canopies, and less literfall. Sites at higher elevations typically had lower canopy closure and high amounts of fine woody debris and only moderate amounts of large woody debris. These sites were typically very dry with relatively small trees and little understory growth. Low elevation sites typically had higher amounts of understory conifers, high amounts of understory vegetation, and abundant large woody debris.
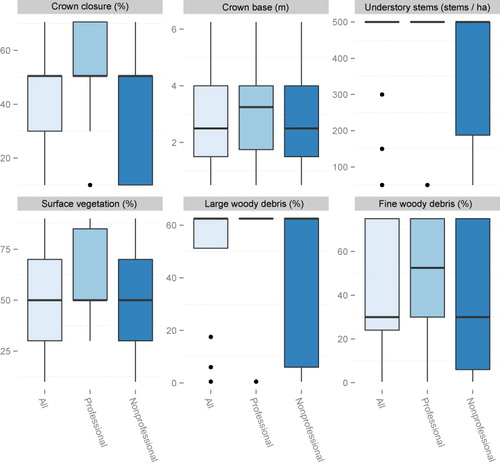
In general, the volunteers with professional forestry experience more frequently chose sites with high levels of fuel loading, and nonprofessionals chose sites with a broader range of conditions, and were more evenly spread across these conditions, including some with lower levels of loading (). In particular, the volunteers with professional forestry experience chose very few sites with lower levels of conifer crown closure, large woody debris, surface vegetation coverage, and understory stems. The combined pool of observations included a wider range of conditions. Notably, nonprofessionals collected observations at sites with steeper slopes and higher elevations. Nonprofessionals on average collected measurements that were further away from the starting point (mean = 548 m for nonforestry professional vs. 382 m for forestry professionals). However, the assets at highest risk from wildfire (e.g. buildings) were closer to the starting point, and the volunteers with professional experience collected their measurements closer to these high priority locations.
3.3. K-NN models
The K-NN model was built for the full set of measurements, measurements by forest professionals, and measurements by nonprofessionals using the validation data () and the raw volunteered data and the reference data (). For most of the dependent variables, the pool of all observations had a lower RMSD error than the observations by professionals or nonprofessionals alone. This was expected because in these cases only a subset of the measurements was used to generate the model while all observations were used to test it, increasing the number of similar neighbors. For most of the other dependent variables, the measurements by professionals and nonprofessionals were similar, with the RMSD of models built by data from professionals being slightly lower.
Table 4. RMSD for Mahalanobis model with reference data.
Table 5. RMSD for Mahalanobis model with raw, uncorrected data.
Comparing the RMSD for the raw, uncorrected data and the reference data showed larger RMSD values for the uncorrected data with the exception of conifer crown closure for professional participants. The raw data were closely examined to explore why the model built with uncorrected professional measurements was closer to the reference measurements than the model built using the reference measurements themselves. The data points where the raw model outperformed the corrected model had relatively high Mahalanobis distances to the most similar neighboring smartphone observations (75th percentile and higher; in other words, they were dissimilar to other observations collected where there were similar remote sensing and topography indices). Therefore, the larger distances to other similar observations indicated lower confidence in these observations; it was likely by chance that the uncorrected canopy closures more closely matched the reference measurements. Another of the most notable differences between the volunteered and the measured observations was for suppressed and understory conifers, due to lower levels of visual observation accuracy and an overestimation of the number of stems (Ferster and Coops Citation2014), the model using the reference data showed considerably lower counts. Using the procedures recommended in Ferster and Coops (Citation2014) would substantially increase the accuracy of these estimations.
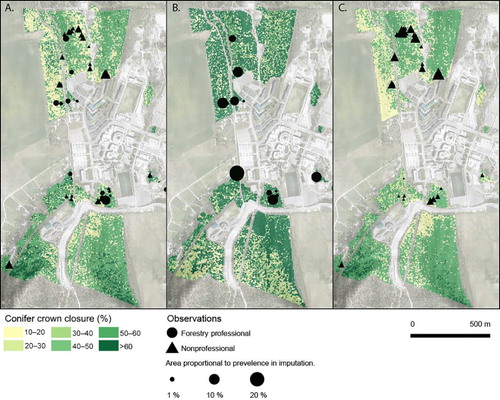
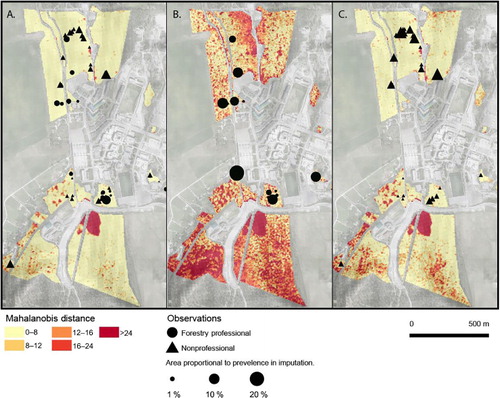
Using the imputation of conifer crown closure as an example, the estimation based on observations by forest professionals shows higher conifer crown closure near the buildings than the imputation from nonprofessional observations (). However, some areas that had been treated for fuels, including thinning of the canopy, such as the linear segment of forest at the Northwest of the study area had conifer crown closure over-estimated by the professional's observations. There were also large differences in the southern section of the image, where the nonprofessional's estimate showed higher conifer crown closure. Evaluating the map made by nonprofessional participants shows lower canopy closure in the center parts of the study area, nearest buildings. The imputation based on the combination of professional and nonprofessional observations shows the greatest variation in canopy closure throughout the scene, including areas with high amounts of canopy closure and areas with lower levels of canopy closure.
Examining the map of Mahalnobis distances shows larger distances for the professional observations mostly in open parts of the stand, since there were fewer observations representing open canopy conditions (). For the combined measurements, areas with large Mahalanobis distances included patches in the lower center of the study area, near the edges of stands. Additionally, the estimates by professionals had larger Mahalanobis distances further away from the center of the study area. To improve the spatial representation of the volunteered observations, areas with large Mahalanobis distances could be targeted.
3.4. Evaluating relationships between the target and predictor variables
A canonical correlation analysis was conducted using the 14 environmental predictor variables and the 6 dependent variables (). Considered together, the full model across all dimensions (1–6) was statistically significant (F = 2.77 and p < 0.001), with a Wilk's lambda = 0.007, indicating a strong effect size and confirming the model explained a large amount of the observed variance. Functions 2–6, 3–6, and 4–6 were also significant at α = 0.05. The first four functions representing canonical correlations of 0.89, 0.83, 0.76, and 0.72 were chosen for interpretation.
Table 6. Tests of canonical dimensions.
Considering the scaled loadings for the canonical functions (), in the first dimension, low green irradiances with high GNDVI, RSR, and elevation were associated with greater amounts of suppressed and understory conifers, understory vegetation, and large woody debris. This implies that understory conifers and vegetation play a large role in driving visible reflectance (darker greens) and were associated with large woody debris, especially at relatively higher landscape positions. In the second function, low irradiance in all bands except the near-infrared, high SR, GNDVI, NDVI, and certain aspect orientations was related to greater amounts of crown closure, understory conifers, and large woody debris, with lower amounts of understory vegetation. This relationship shows that areas with high amounts of canopy closure and high amounts of understory conifers were associated with plentiful large woody debris, less understory vegetation, and the best predictors for these types of conditions were spectral vegetation indices (such as GNDVI), and reduced visible and red-edge reflectance, with aspect. In the third function, increasing elevation was associated with lower amounts of canopy closure and higher amounts of woody debris and suppressed and understory conifers. In the fourth function, higher NDRE and GNDVI were associated with higher conifer crown closure and higher amounts of fine woody debris (likely windfall from these very dense canopies). Similarly, Falkowski et al. (Citation2005) found that high GNDVI was an effective estimator of canopy fuels components, due to its ability to distinguish between the canopy and senesced vegetation. Evaluating the h2 coefficients, the predictors with the highest capabilities were the visible and red-edge remote sensing bands, GNDVI, NDRE, and Elevation. In terms of the target variables, the strongest relationships were for suppressed and understory conifers, conifer crown closure, and surface vegetation, with lower amounts for fine and large woody debris. For conifer crown base height, there was very low potential for making the estimation using the predictor variables, so other methods using different predictors or considering other methods of analysis may be more effective.
Table 7. Standardized canonical coefficients.
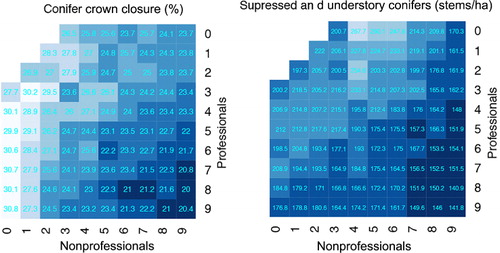
Evaluating the random combinations of volunteers () reveals several patterns in the way that professionals and nonprofessionals collected the data. Because the models were built with the data from the reference measurements, the RMSD should mostly be due to the location of the plots; however, these values likely still contain some measurement error, and this is indicated that in some cases models made with less than the full set of measurements had a slightly lower RMSD. This indicates that as a filtering step, plots with very large distances to their neighbors should be examined and either removed from the model if they are determined to contain a large amount of measurement error, or retained and more plots could be directed toward similar conditions if they were determined to be a valid representation. Second, as the number of nonprofessionals increased, the RMSDs decreased in a more linear manner than for professionals – indicating that the nonprofessionals collected data in more random fashion compared to the professionals who followed a more similar method. In some cases, combinations of volunteers less than the full set were able to make estimations with RMSDs close to the full set of volunteers. This indicates that given the knowledge gained from the exploratory analysis future sampling could be directed more efficiently.
4. Discussion
Several studies have used smartphones (e.g. Pratihast et al. Citation2013) or public participation to collect data used in remote sensing analysis (e.g. See et al. Citation2013). In this study, volunteered observations of forest fuels were collected using a smartphone application and extrapolations over broader areas made by combining the smartphone data with predictor variables from remote sensing and topography. As a result of performing this exploratory analysis, insight can be provided into how to direct and analyze future volunteer efforts.
4.1. GPS accuracy
GPS accuracy of smartphone devices was tested extensively by Zandbergen (Citation2009) and Zandbergen and Barbeau (Citation2011), who found a median error of 8 m; however, very few measurements with large differences (greater than 30 m) were found in a predominately urban setting. In contrast, the present study was undertaken in a forested environment, and survey benchmarks were not available to test the locational accuracy with as much certainty. As a result, patterns of vegetation visible in imagery were used to match the two sources as closely as practically possible. The distance moved was weakly positively correlated with canopy closure, indicating that this factor may warrant further investigation; however, given the weak correlation, there may be other factors to consider. For example, the application was designed to continuously acquire GPS positioning information while observations of the forest components were being collected, and locational information was recorded as one of the last steps of the process. As a result, nonprofessional participants had a lower median error, who were observed to take more time to complete each assessment, compared to professional participants who were already familiar with the protocols and terms used in the application and took less time to complete an assessment at each location and therefore, less time to secure a positive GPS signal. Several very large distances (>100 m) were submitted, and the secondary manual-screening phase was important for identifying these locations. More error checking could be built into the application, for example where a participant compares the reported GPS location against a map and confirms whether it is reasonable or not. Finally, more work is needed following Zandbergen (Citation2009) and Zandbergen and Barbeau (Citation2011) at known locations (e.g. cadastral survey markers) under forest canopies to better understand what the performance of smartphone GPS devices is in field conditions, and this may help researchers understand what spatial resolution of imagery is appropriate to compare with smartphone-collected measurements (Hengl Citation2006).
4.2. Experience
In previous work by Pratihast et al. (Citation2013), nonexperts hired to collect forest data using smartphones were able to collect data that were nearly equivalent to data collected by experts, but at considerably less cost. Additionally, people from local communities were more effective at monitoring local forest degradation from fuel wood collection than from remote sensing or aerial monitoring approaches. Similarly, See et al. (Citation2013) found that data collected by nonexperts for validating remote sensing models were very close to measurements acquired by experts; however, there were some tasks where experts outperformed nonexperts. In the present study, a volunteered and opportunistic dataset was analyzed to give insight on where forestry professionals and nonprofessionals chose to collect data. Participants with professional forestry experience were found to submit observations in higher priority areas with higher fuels loading, while nonprofessionals covered a broader range of conditions and collected observations over a wider area. Models built with the professional's observations alone indicated higher fuel loadings across the landscape. Considering that an overestimation of the fuels load may lead to fuels reduction or modification treatments, while an underestimation may lead to a stand with high fuels loading not being treated, the overestimation is a more conservative outcome. These trends point to a complimentary relationship between the observations submitted by users of different expertise, where professional measurements are collected in high priority areas, and nonprofessionals explore a broader range of conditions that may make more subtle trends apparent. For both professionals and nonprofessionals, very few observations were submitted from open areas. This likely could be improved by simply providing instructions to collect observations in both open and closed canopy conditions. The six images acquired in a consistent manner at each site made it possible to add additional locations using photo-interpretive methods.
4.3. Remote sensing of fuels loading
Similar to Falkowski et al. (Citation2005), indices such as GNDVI were associated with increasing canopy closure. However, in the present study, understory vegetation had a strong signal and similar response, indicating that canopy classification could have been more accurate if the remote sensing imagery were acquired when the vegetation was in a further senesced state. Using the NDRE, derived from the red-edge and red bands available in RapidEye imagery was useful to distinguish conifer crown closure and suppressed and understory conifers from surface vegetation. Riaño and Chuvieco (Citation2002) used imagery collected in two phenological states to map forest fuels using remote sensing, leading to a significant improvement in the ability to classify fuels types, especially for classifying different understory vegetation compositions under deciduous forest canopies. In future work, our approach could be adapted to incorporate satellite images taken in different phenological states, which may help obtain both more accurate crown and understory vegetation estimates. The multivariate canonical correlation analysis provided insight into complex relationships between site conditions and forest fuel variables. While the study area contained a large amount of variation in forest structure in a small area, species composition was very similar throughout the site. Future work may test this approach over areas with greater variation in species composition, possibly adding a classification or stratification step.
4.4. A framework for integrating volunteered smartphone data and multispectral remote sensing data
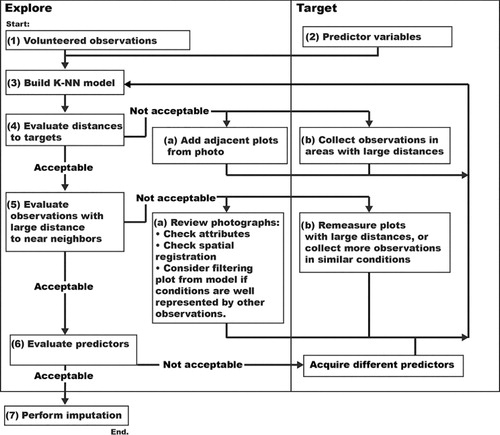
The K-NN approach used in this study provided tools for the simultaneous imputation of multiple forest fuels components and also for coordinating volunteer efforts. Future efforts can be directed to maximize the efficiency of the volunteers to cover the entire area and collect remeasurements as conditions change due to forest growth and disturbance. Based on this exploratory analysis, we present one possible framework for starting with a volunteered, opportunistic data source and directing future efforts (). The framework starts with a body of volunteered observations from opportunistic sources and with unknown error. In the second step, predictor variables are collected that are related to the targets (the order of the first two steps are interchangeable). In the third step, the predictors and targets are used together to build a K-NN model, and the following steps assess the model for three of the types of error described by Stage and Crookston (Citation2007) including measurement error, pure error, and similarity of the reference observations, as described in the following steps. In the fourth step, the spatial representation of the observations is examined using the Mahalanobis distance approach to assess the spatial representation of the sample, which is related to similarity of reference observations. If there are large areas that do not have similar observations, they are unrepresented, and future sampling should be directed to those areas. Alternatively, the analysis can be focused to exclude areas with large distances and, as a result, low confidence in the estimations. In the fifth step, the distance of each observation to the other nearest neighboring observations is considered. If observations are collected under similar conditions and have inconsistent measurements, they will be flagged for error checking. This step assesses the measurement error of the observations and the GPS measurement of spatial registration. Finding this source of error requires the assumption that the dataset includes valid measurements (early evaluation of attribute quality of the dataset by Ferster and Coops (Citation2014) indicated that a majority of the volunteered observations were within an expected boundary of the reference measurements). In the sixth step, the predictor variables are assessed to better understand the capability of the model. This step is related to pure error in the model and may help managers choose and test more effective predictors. In the final step, the final K-NN imputation is performed for the study area.
Aspects of the framework are iterative and scalable, allowing them to be completed automatically in real time – for example, Mahalanobis distance for the target pixels across the study area could be calculated and displayed as each additional observation is collected and presented to participants to show where volunteered observations are most beneficial. Additional research is needed to see if this could be a motivating approach for participants, possibly combined with game elements such as awarding points for collecting observations in high-distance areas (Iacovides et al. Citation2013). Additionally, applying this framework measure changes over time also requires addition research.
Nonparametric K-NN models with Mahalanobis distance were chosen for this analysis because they make few assumptions about the collection of the data and have an ability to simultaneously predict multiple variables. As larger datasets are collected and more is understood about the relationships between predictor and target variables, an important future step is to develop more specific models that may provide more predictive power and more reliable results. For example, reducing the set of predictor variables used in the model may improve predictive power and reduce the risk of over-fitting the models to local noise in the data; however, variable reduction strategies must be well-implemented or they may degrade model performance (Packalen, Temesgen, and Maltamo Citation2012). Using models that include spatial terms, such as spatial linear prediction may provide smaller prediction errors, more robust estimation for spatially imbalanced samples, and allow estimation of prediction standard errors (Ver Hoef and Temesgen Citation2013).
The North American Breading Bird Survey (BBS) is a citizen science project that utilizes a strategic sampling design (along major roads once a year during breeding season) and, similar to this study, includes many volunteers with considerable expertise (Sauer, Hines, and Fallon Citation2008). In contrast to the BBS, this study presents a more flexible and scalable framework incorporating opportunistic data. One possibility is to incorporate design ideas from the BBS. For example, data collection could take part of a prefire season spring-clean-up campaign led by local fire managers. Additionally, strategic sample points could be established as a starting point if these efforts were coordinated from the beginning.
4.5. Limitations
This study includes exploratory work, conducted over a limited area and timeframe under controlled conditions. In particular, due to practical factors in application testing, the study was conducted over a relatively small area, and in the future a wider area should be utilized to better understand how well the technique works over a broader range of conditions, for example a wider range of elevations and ecosystem types. The analysis presented in this paper is exploratory and is intended to describe the data collected in this study and to inform the initial development of frameworks that inspire future research effort and topics. More research over broader areas with more participants is required to draw broader conclusions. If these frameworks are implemented over broader areas with more users, revisions and adjustments will certainly be necessary as experience is gained. Additionally, implementation to a wider audience would require careful consideration of risk and liability, which are inherent in wildfire issues. Therefore, caution is warranted in applying these new techniques.
5. Conclusion
Utilizing volunteered environmental information provides the potential to collect a more complete set of Earth observation measurements, provides opportunities for citizens to work together with resource managers to address community issues, and provides learning opportunities from Digital Earth. This study analyzed forest fuels loading data collected by volunteers using a smartphone application and made estimations over broader areas using remote sensing and topography predictor variables. Professional volunteers collected observations in high priority areas and with lower measurement error, while nonprofessional volunteers collected measurements over a broader range of conditions and over a physically larger area. These trends suggest that the data collected by participants with and without professional forest experience can be used in a complementary manner. A framework was presented to utilize observations by both professionals and nonprofessionals and coordinate future volunteer efforts in an efficient manner. The use of volunteer data collection and opportunistic datasets holds potential to advance the state of Digital Earth, provided that methods are used to ensure spatial representation and attribute accuracy.
Acknowledgments
We extend our utmost gratitude to each of the volunteers for their efforts. We hope that their efforts will lead to more effective wildfire management in the WUI. We are grateful to John Davies, Andrew Hunsberger, and Jordan Carter of Valhalla Consulting for their input and help designing the application, and Raphael Roy-Jauvin for assistance in development. Thank you to Rob Kozak, Howie Harshaw, and Mike Meitner for their contributions to the project. Thank you to John Arnett, Vanessa Mascorro, Wiebe Nijland, and Doug Bolton for meeting with volunteers. Thank you to Mitchell Vartanian for his help editing the manuscript. Thank you to the anonymous reviewers for their constructive criticism and feedback on the manuscript.
Disclosure statement
No potential conflict of interest was reported by the authors.
Additional information
Funding
References
- Agee, J. K., and C. N. Skinner. 2005. “Basic Principles of Forest Fuel Reduction Treatments.” Forest Ecology and Management 211 (12): 83–96. doi:10.1016/j.foreco.2005.01.034.
- Arnett, J., N. C. Coops, S. E. Gergel, R. W. Falls, and R. Baker. 2014. “Detecting Stand Replacing Disturbance Using RapidEye Imagery : A Tasseled Cap Transformation and Modified Disturbance Index.” Canadian Journal of Remote Sensing 40 (1): 1–37. doi:10.1080/07038992.2014.899878.
- Arroyo, L. A., C. Pascual, and J. Manzanera. 2008. “Fire Models and Methods to Map Fuel Types: The Role of Remote Sensing.” Forest Ecology and Management 256 (6): 1239–1252. doi:10.1016/j.foreco.2008.06.048.
- Bakillah, M., S. Liang, A. Mobasheri, J. Jokar Arsanjani, and A. Zipf. 2014. “Fine-resolution Population Mapping Using OpenStreetMap Points-of-Interest.” International Journal of Geographical Information Science October (April): 1–22. doi:10.1080/13658816.2014.964247.
- Barnes, E. M., T. R. Clarke, and S. E. Richards. 2000. “Coincident Detection of Crop Water Stress, Nitrogen Status and Canopy Density Using Ground-based Multispectral Data.” In Proceedings of the Fifth International Conference on Precision Agriculture, edited by P. C. Robert, R. H. Rust, and W. E. Larson, 16–19. Bloomington, MN: American Society of Agronomy, Crop Science Society of America, Soil Science Society of America. http://ddr.nal.usda.gov/bitstream/10113/4190/1/IND43939070.pdf.
- Bonney, R., H. Ballard, R. Jordan, and E. McCallie. 2009. “Public Participation in Scientific Research: Defining the Field and Assessing Its Potential for Informal Science Education. A CAISE Inquiry Group Report.” Online Submission, July. http://eric.ed.gov/?id=ED519688.
- CDED (Canadian Digital Elevation Data). 2014. Geobase.ca. http://www.geobase.ca/geobase/en/data/cded/description.html.
- Chavez, P. S. 1996. “Image-based Atmospheric Corrections-revisited and Improved.” Photogrammetric Engineering and Remote Sensing 62 (9): 1025–1035. http://www.unc.edu/courses/2008spring/geog/577/001/www/Chavez96-PERS.pdf.
- Chirici, G. 2012. “K-NN FOREST: A Software for the Non-parametric Prediction and Mapping of Environmental Variables by the K-nearest Neighbors Algorithm.” European Journal of Remote Sensing November: 433–442. doi:10.5721/EuJRS20124536.
- Cohen, J. 2000. “Preventing Disaster: Home Ignitability in the Wildland-urban Interface.” Journal of Forestry 98 (3): 15–21. http://www.ingentaconnect.com/content/saf/jof/2000/00000098/00000003/art00008.
- Craglia, M., K. de Bie, D. Jackson, M. Pesaresi, G. Remetey-Fülöpp, C. Wang, A. Annoni et al. 2012. “Digital Earth 2020: Towards the Vision for the Next Decade.” International Journal of Digital Earth 5 (1): 4–21. doi:10.1080/17538947.2011.638500.
- Crookston, N. L., and A. O. Finley. 2008. “yaImpute: An R Package for kNN Imputation.” Journal of Statistical Software 23 (10). http://ddr.nal.usda.gov/handle/10113/16688.
- Dickinson, J. L., and R. L. Crain. 2014. “Socially Networked Citizen Science and the Crowd-sourcing of Pro-environmental Collective Actions.” In Online Collective Action, edited by N. Agarwal, M. Lim, and R. T. Wigand, 133–152. Lecture Notes in Social Networks. Vienna: Springer.
- Ehlers, M., P. Woodgate, A. Annoni, and S. Schade. 2014. “Advancing Digital Earth: Beyond the Next Generation.” International Journal of Digital Earth 7 (1): 3–16. doi:10.1080/17538947.2013.814449.
- Eitel, J. U. H., L. A. Vierling, M. E. Litvak, D. S. Long, U. Schulthess, A. A. Ager, D. J. Krofcheck, and L. Stoscheck. 2011. “Broadband, Red-Edge Information from Satellites Improves Early Stress Detection in a New Mexico Conifer Woodland.” Remote Sensing of Environment 115 (12): 3640–3646. doi:10.1016/j.rse.2011.09.002.
- Erickson, T., W. A. Kellogg, and I. B. M. T. J. Watson. 2000. “Social Translucence : An Approach to Designing Systems That Support Social Processes.” ACM Transactions on Computer-Human Interaction 7 (1): 59–83.
- Ersts, P. J., N. Horning, and K. Koy. 2013. Event Visualization Tool (eVis). New York: Center for Biodiversity and Conservation's Biodiversity Informtics Facility at the American Museum of Natural History; QGIS Project.
- Falkowski, M. J., P. E. Gessler, P. Morgan, A. T. Hudak, and A. M. S. Smith. 2005. “Characterizing and Mapping Forest Fire Fuels Using ASTER Imagery and Gradient Modeling.” Forest Ecology and Management 217: 129–146. doi:10.1016/j.foreco.2005.06.013.
- Ferster, C. J., and N. C. Coops. 2013. “A Review of Earth Observation Using Mobile Personal Communication Devices.” Computers & Geosciences 51 (February): 339–349. doi:10.1016/j.cageo.2012.09.009.
- Ferster, C. J., and N. C. Coops. 2014. “Assessing the Quality of Forest Fuel Loading Data Collected Using Public Participation Methods and Smartphones.” International Journal of Wildland Fire 23 (4): 585–590. doi:10.1071/WF13173.
- Ferster, C. J., N. C. Coops, H. W. Harshaw, R. A. Kozak, and M. J. Meitner. 2013. “An Exploratory Assessment of a Smartphone Application for Public Participation in Forest Fuels Measurement in the Wildland-urban Interface.” Forests 4 (4): 1199–1219. doi:10.3390/f4041199.
- Gitelson, A. A., M. N. Merzlyak, and H. K. Lichtenthaler. 1996. “Detection of Red Edge Position and Chlorophyll Content by Reflectance Measurements Near 700 Nm.” Journal of Plant Physiology 148 (3–4): 501–508. doi:10.1016/S0176-1617(96)80285-9.
- Goodchild, M. F. 2007. “Citizens as Sensors: The World of Volunteered Geography.” GeoJournal 69 (4): 211–221. doi:10.1007/s10708-007-9111-y.
- Gore, A. 1998. “The Digital Earth.” Australian Surveyor 43 (2): 89–91. doi:10.1080/00050326.1998.10441850.
- Gumley, L., R. Holz, D. Parker, B. Flynn, and B. Bellon. 2010. “SatCam: An iPhone Application for Community Participation in Satellite Cloud Product Validation.” In International Geoscience and Remote Sensing Symposium (IGARSS). Honolulu, HI. http://www.igarss2010.org/Papers/ViewPapers_MS.asp?PaperNum=3926.
- Hardy, C. 2005. “Wildland Fire Hazard and Risk: Problems, Definitions, and Context.” Forest Ecology and Management 211 (1–2): 73–82. doi:10.1016/j.foreco.2005.01.029.
- Harris, L. M., T. K. McGee, and B. L. McFarlane. 2011. “Implementation of Wildfire Risk Management by Local Governments in Alberta, Canada.” Journal of Environmental Planning and Management 54 (4): 457–475. doi:10.1080/09640568.2010.515881.
- Hengl, T. 2006. “Finding the Right Pixel Size.” Computers & Geosciences 32 (9): 1283–1298. doi:10.1016/j.cageo.2005.11.008.
- Hermosilla, T., L. A. Ruiz, A. N. Kazakova, N. C. Coops, and L. Monika Moskal. 2014. “Estimation of Forest Structure and Canopy Fuel Parameters from Small-footprint Full-waveform LiDAR Data.” International Journal of Wildland Fire 23 (2): 224. doi:10.1071/WF13086.
- Hope, G. D., D. A. Lloyd, W. R. Mitchell, W. R. Erickson, W. L. Harper, and B. M. Wikeem. 1991. “Ponderosa Pine Zone.” In Ecosystems of British Columbia, edited by D. V. Meidinger and J. Pojar, BC Special, 139–151. Victoria: Research Branch, BC Ministry of Forests.
- Hudak, A., N. Crookston, J. Evans, D. Hall, and M. Falkowski. 2008. “Nearest Neighbor Imputation of Species-level, Plot-Scale Forest Structure Attributes from LiDAR Data.” Remote Sensing of Environment 112 (5): 2232–2245. doi:10.1016/j.rse.2007.10.009.
- Iacovides, I., C. Jennett, C. Cornish-Trestrail, and A. L. Cox. 2013. “Do Games Attract or Sustain Engagement in Citizen Science?” In CHI ’13 Extended Abstracts on Human Factors in Computing Systems on – CHI EA'13, edited by W. E. Mackay, S. A. Brewster, and S. Bødker, 1101. New York: ACM Press.
- Jokar Arsanjani, J., M. Helbich, M. Bakillah, J. Hagenauer, and A. Zipf. 2013. “Toward Mapping Land-use Patterns from Volunteered Geographic Information.” International Journal of Geographical Information Science 27 (12): 2264–2278. doi:10.1080/13658816.2013.800871.
- Keane, R. E., R. Burgan, and J. W. Van Wagtendonk. 2001. “Mapping Wildland Fuels for Fire Management Across Multiple Scales: Integrating Remote Sensing, GIS, and Biophysical Modeling.” International Journal of Wildland Fire 10 (4): 301–319. doi:10.1071/WF01028.
- Lillesand, T. M. 2002. “Combining Satellite Remote Sensing and Volunteer Secchi Disk Measurement for Lake Transparency Monitoring.” In Proceedings: National Monitoring Conference, National Water Quality Monitoring Council, 1–11. Madison, WI: University of Wisconsin. http://acwi.gov/monitoring/conference/2002/Papers-AlphabeticalbyFirstName/ThomasLillesand-Satellite.pdf.
- Mahalanobis, P. C. 1936. “On the Generalized Distance in Statistics.” Proceedings of the National Institute of Sciences 12: 49–55.
- Maxwell, W. G., and F. R. Ward. 1976. Photo Series for Quantifying Forest Residues in the Coastal Douglas-Fir--Hemlock Type, Coastal Douglas-Fir--Hardwood Type. Portland, OR. http://library.wur.nl/WebQuery/clc/330741.
- Morrow, B., K. Johnston, and J. Davies. 2008. Rating Interface Wildfire Threats in British Columbia. Fuel. Victoria, BC: Ministry of Forests and Range Protection Branch.
- Mullin, M. D., and R. Sukthankar. 2000. “Complete Cross-validation for Nearest Neighbor Classifiers.” In International Conference on Machine Learning (ICML), 639–646. San Francisco, CA: Morgan Kaufmann. http://www.cs.cmu.edu/~rahuls/pub/icml2000-rahuls.pdf.
- Open Data Catalogue. 2014. City of Kelowna. http://www.kelowna.ca/CM/Page3936.aspx.
- Packalen, P., H. Temesgen, and M. Maltamo. 2012. “Variable Selection Strategies for Nearest Neighbor Imputation Methods Used in Remote Sensing Based Forest Inventory.” Journal of Remote Sensing 38 (5): 557–569. http://pubs.casi.ca/doi/abs/10.5589/m12-046.
- Peterson, S. H., and J. Franklin. 2012. “Mapping Fuels in Yosemite National Park.” Canadian Journal of Forest Research 17 ( November 2012): 7–17. http://www.nrcresearchpress.com/doi/full/10.1139/cjfr-2012-0213.
- Pratihast, A., B. DeVries, V. Avitabile, S. de Bruin, L. Kooistra, M. Tekle, and M. Herold. 2014. “Combining Satellite Data and Community-based Observations for Forest Monitoring.” Forests 5 (10): 2464–2489. doi:10.3390/f5102464.
- Pratihast, A. K., M. Herold, V. Avitabile, S. de Bruin, H. Bartholomeus, C. M. Souza, and L. Ribbe. 2013. “Mobile Devices for Community-based REDD+ Monitoring: A Case Study for Central Vietnam.” Sensors (Basel, Switzerland) 13 (1): 21–38. doi:10.3390/s130100021.
- Raddick, M. J., G. Bracey, P. L. Gay, C. J. Lintott, P. Murray, K. Schawinski, A. S. Szalay, and J. Vandenberg. 2010. “Galaxy Zoo: Exploring the Motivations of Citizen Science Volunteers.” Astronomy Education Review 9 (1): 010103. doi:10.3847/AER2009036.
- Radeloff, V. C., R. B. Hammer, S. I. Stewart, J. S. Fried, S. S. Holcomb, and J. F. McKeefry. 2005. “The Wildland–urban Interface in the United States.” Ecological Applications 15 (3): 799–805. doi:10.1890/04-1413.
- R Development Core Team. 2011. R: A Language and Environment for Statistical Computing. Vienna: R Foundation for Statistical Computing. http://www.r-project.org/.
- Riaño, D., and E. Chuvieco. 2002. “Generation of Fuel Type Maps from Landsat TM Images and Ancillary Data in Mediterranean Ecosystems.” Canadian Journal of Forest Research 1315: 1301–1315. doi:10.1139/X02-052.
- Sauer, J. R., J. E. Hines, and J. Fallon. 2008. The North American Breeding Bird Survey, Results and Analysis 1966-2007. Version. Laurel, MD. http://scholar.google.com/scholar?hl=en&btnG=Search&q=intitle:The+North+American+breeding+bird+survey,+results+and+analysis+1966-2007#0.
- Sauer, J. R., W. A. Link, J. D. Nichols, and J. A. Royle. 2005. “Using the North American Breeding Bird Survey as a Tool for Conservation: A Critique of Bart et al. (2004).” Journal of Wildlife Management 69 (4): 1321–1326. doi:10.2193/0022-541X(2005)69[1321:UTNABB]2.0.CO;2.
- Schuster, C., M. Förster, and B. Kleinschmit. 2012. “Testing the Red Edge Channel for Improving Land-use Classifications Based on High-resolution Multi-spectral Satellite Data.” International Journal of Remote Sensing 33 (17): 5583–5599. doi:10.1080/01431161.2012.666812.
- See, L., A. Comber, C. Salk, S. Fritz, M. van der Velde, C. Perger, C. Schill, I. McCallum, F. Kraxner, and M. Obersteiner. 2013. “Comparing the Quality of Crowdsourced Data Contributed by Expert and Non-experts.” Edited by T. Preis. PLoS One 8 (7): e69958. doi:10.1371/journal.pone.0069958.
- Sherry, A., and R. K. Henson. 2005. “Conducting and Interpreting Canonical Correlation Analysis in Personality Research: A User-friendly Primer.” Journal of Personality Assessment 84 (1): 37–48. doi:10.1207/s15327752jpa8401_09.
- Shindler, B. A., E. Toman, and S. M. McCaffrey. 2009. “Public Perspectives of Fire, Fuels and the Forest Service in the Great Lakes Region: A Survey of Citizen–agency Communication and Trust.” International Journal of Wildland Fire 18 (2): 157. doi:10.1071/WF07135.
- Shirk, J. L., H. L. Ballard, C. C. Wilderman, T. Phillips, A. Wiggins, R. Jordan. 2012. “Public Participation in Scientific Research: A Framework for Deliberate Design.” Ecology and Society 17 (2): 29–48. doi:10.5751/ES-04705-170229.
- Sikkink, P. G., and R. E. Keane. 2008. “A Comparison of Five Sampling Techniques to Estimate Surface Fuel Loading in Montane Forests.” International Journal of Wildland Fire 17 (3): 363. doi:10.1071/WF07003.
- Stage, A. R., and N. L. Crookston. 2007. “Partitioning Error Components for Accuracy-assessment of Near-neighbor Methods of Imputation.” Forest Science 53 (1): 62–72. http://www.ingentaconnect.com/content/saf/fs/2007/00000053/00000001/art00007.
- Sullivan, B. L., J. L. Aycrigg, J. H. Barry, R. E. Bonney, N. Bruns, C. B. Cooper, T. Damoulas et al. 2014. “The eBird Enterprise: An Integrated Approach to Development and Application of Citizen Science.” Biological Conservation 169 (January): 31–40. doi:10.1016/j.biocon.2013.11.003.
- Taylor, S. W., R. G. Pike, and M. E. Alexander. 1997. Field Guide to the Canadian Forest Fire Behavior Prediction (FBP) System. 1st ed. Victoria, BC: Natural Resources Canada, Canadian Forest Service, Pacific Forestry Centre. FRDA Handbook 012. http://www.cfs.nrcan.gc.ca/publications?id=25139.
- Toman, E., B. Shindler, and M. Brunson. 2006. “Fire and Fuel Management Communication Strategies: Citizen Evaluations of Agency Outreach Activities.” Society & Natural Resources 19 (4): 321–336. doi:10.1080/08941920500519206.
- Tucker, C. J. 1979. “Red and Photographic Infrared Linear Combinations for Monitoring Vegetation.” Remote Sensing of Environment 8: 127–150. http://linkinghub.elsevier.com/retrieve/pii/0034425779900130.
- Ver Hoef, J. M., and H. Temesgen. 2013. “A Comparison of the Spatial Linear Model to Nearest Neighbor (k-NN) Methods for Forestry Applications.” PLoS One 8 (3): e59129. doi:10.1371/journal.pone.0059129.
- Zandbergen, P. A. 2009. “Accuracy of iPhone Locations: A Comparison of Assisted GPS, WiFi and Cellular Positioning.” Transactions in GIS 13 (June): 5–25. doi:10.1111/j.1467-9671.2009.01152.x.
- Zandbergen, P. A., and S. J. Barbeau. 2011. “Positional Accuracy of Assisted GPS Data from High-sensitivity GPS-enabled Mobile Phones.” Journal of Navigation 64 (3): 381–399. doi:10.1017/S0373463311000051.