
Abstract
The 3D Water Chemistry Atlas is an intuitive, open source, Web-based system that enables the three-dimensional (3D) sub-surface visualization of ground water monitoring data, overlaid on the local geological model (formation and aquifer strata). This paper firstly describes the results of evaluating existing virtual globe technologies, which led to the decision to use the Cesium open source WebGL Virtual Globe and Map Engine as the underlying platform. Next it describes the backend database and search, filtering, browse and analysis tools that were developed to enable users to interactively explore the groundwater monitoring data and interpret it spatially and temporally relative to the local geological formations and aquifers via the Cesium interface. The result is an integrated 3D visualization system that enables environmental managers and regulators to assess groundwater conditions, identify inconsistencies in the data, manage impacts and risks and make more informed decisions about coal seam gas extraction, waste water extraction, and water reuse.
1. Introduction
The rapid expansion of the Coal Seam Gas (CSG) industry in Australia over the past 5–10 years has been accompanied by government and community concerns about the potential risks of CSG extraction on the environment, particularly surface and ground water (Williams, Stubbs, and Milligan Citation2012). Concerns associated with CSG operations include the potential risks to ground and surface water supplies from fugitive gas emissions, recovered frack fluids, or co-produced water extracted from coal seams (NSW Government 2014). For example, the water produced during CSG operations is typically quite saline, large in volume, and may contain heavy metals and other trace elements of concern (Nghiem et al. Citation2011; Kinnon et al. Citation2010; Van Voast Citation2003).
To assess and minimize the risks that CSG operations pose to aquifer water quality, groundwater monitoring is employed to establish the water quality status before mining and CSG activities and to assess trends in groundwater quality during and after these activities. It involves accessing existing wells or installing new monitoring wells to periodically collect groundwater samples across the site and undertake chemical analyses on the samples (Barcelona et al. Citation1985; Queensland Water Commission Citation2012).
To minimize potential risks and adverse impacts from CSG exploration and extraction in Australia, extensive regulatory frameworks have been established by both the Commonwealth and the States (Australian Government Citation1999; Thompson and Loeliger Citation2013; SCER Citation2013). For example, in Queensland, the Queensland Water Act 2000 (Queensland Government Citation2000) requires companies to undertake baseline assessments for water bores in areas where petroleum and gas production or testing is planned or under way. The Office of Groundwater Impact Assessment (OGIA) stores the baseline assessment information (which includes bore registration, aquifer, casing, stratigraphy, and water analysis records) in its Bore Baseline Assessment Database (BBAD) and uses it to produce groundwater impact reports (Queensland Water Commission Citation2012). In addition, a number of other sources of groundwater and geological information (e.g. the Groundwater Database [GWDB] maintained by the State Government) provide complementary data for assessing the impact of CSG extraction on groundwater. However the GWDB comprises mainly historical data, collected over decades from bores established for agricultural purposes, long before the CSG industry became active – so the data may not accurately reflect the current situation.
Interpretation of spatial and temporal changes in groundwater attributes presents a significant data management challenge because it requires the integration and analysis of hydrological, chemical, mineralogical and geological data, typically held, in disparate databases in heterogeneous formats, accessible only via commercial software. Within Queensland, integrating data from the GWDB and the BBAD with the geological strata data (including aquifer layers), and enabling access via a single unified Web portal would provide industry, research, and government stakeholders with a more reliable and comprehensive foundation for decision-making, provide source material for the media and help to allay public concerns. Moreover, companies could combine their own confidential datasets with the cleaned, aggregated public datasets, to derive new knowledge. Hence a primary aim of this project is to develop a single, high quality source of data and information about ground water quality.
A second challenge that the CSG industry and environmental managers face is the lack of freely available Web-based visualization interfaces and interpretive tools to enable companies, government, and environmental agencies to monitor groundwater chemistry trends over space and time. Improved understanding of the spatial distribution of water chemistry and aquifer connectivity will allow better estimation and optimization of water management (including infrastructure, water treatment costs, water reuse, and re-injection options). Better understanding of the factors and processes (geology, water rock interaction, recharge quantities, and quality) leading to water chemistry variations can be used to forecast likely water chemistry outcomes as new fields are developed. Better analysis tools will lead to reduced uncertainty in groundwater impact models for use in regional planning processes and policies for industry regulation and development.
To summarize, interpreting the cumulative impacts of CSG or other industrial activities on groundwater systems requires: improved data collation across multiple organizations and monitoring programs; more streamlined quality assurance (QA)/quality control (QC) procedures; and readily accessible easy-to-use tools for evaluating changes in chemistry due to analytical, environmental, or geological factors (Howe et al. Citation2010; Baldwin et al. Citation2012).
2. Objectives
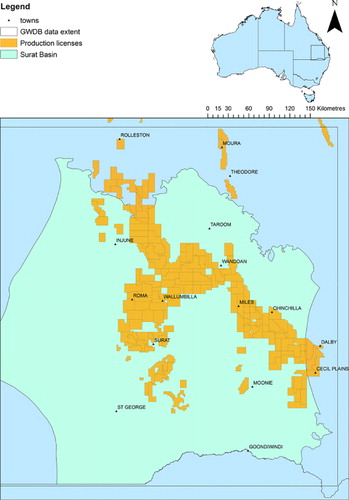
To achieve the aims outlined above, the 3D Water Chemistry Atlas project was established through a collaboration between the University of Queensland's Centre for Coal Seam Gas (CCSG), the Centre for Water in the Minerals Industry (CWIMI), the School of Earth Sciences and the School of Information Technology and Electrical Engineering (ITEE). Phase 1 of the 3D Water Atlas project involved a one year feasibility study that focused on a specific region (the Surat Basin in central Queensland) and had the following objectives:
To develop a unified, quality controlled database of groundwater chemistry data that is integrated with a reliable and consistent geological model, together with other freely available and relevant geospatial layers (e.g. satellite imagery, road networks, property boundaries, and mining lease boundaries).
To develop new visualization and analysis tools which take advantage of the super-position of water chemistry data and three-dimensional (3D) geological data.
To develop a Web interface that enables spatial and timeline access to water chemistry data and increases public awareness of water chemistry trends whilst protecting commercially sensitive data.
To provide regional interpretations of spatial and temporal water chemistry trends, including outputs from multivariate statistical analyses and reactive geochemical modeling.
To identify existing gaps in data and knowledge, that can be used to guide future monitoring practices.
The remainder of this paper describes the design and development of the system and the feedback from stakeholders, to date. It is structured as follows: Section 2 provides an evaluation of existing potential 3D groundwater visualization and analysis platforms and an overview of the chosen virtual globe software, Cesium; Section 3 provides a description of the technical architecture; Section 4 describes the dataset integration and database implementation; Section 5 describes the user interface and functionality of the analytical services; Section 6 describes the stakeholder feedback; and finally Section 7 provides some concluding remarks and outlines plans for future research and development.
3. Review of existing 3D visualization systems
One of the first tasks undertaken in developing the 3D CSG Water Atlas was to evaluate existing 3D visualization platforms to determine the most appropriate platform for displaying and exploring both groundwater chemistry data with borehole data (e.g. geological and geophysical log data) and geological/hydrogeological stratigraphic models through a single Web interface (accessible to the public, researchers, and industry).
Although there are a plethora of ‘virtual globe’ software systems available, they mostly support spatial information layers displayed above the earth's surface (e.g. street maps, digital elevation models, satellite imagery, and even meteorological models (Wang, Huynh, and Williamson Citation2013). Generally, they do not support 3D subsurface data or strata visualization.
There are also some research efforts, such as SolidEarth (Zhu, Sun, Li, and Zhang Citation2014), which enables 3D subsurface visualization and support for overlaying geological structures and boreholes, but SolidEarth is still under development, is not open source and does not appear to currently support X3D format or WebGL.
A review of existing products enabled a short-list of five candidate systems, with the greatest potential to provide the necessary visualization and other capabilities required for the 3D Water Chemistry Atlas, to be compiled:
NASA World Wind (NASA Citation2014), including Geoscience Australia's World Wind Suite (Geoscience Australia Citation2014a) and EarthSci (Geoscience Australia Citation2014b);
Google Earth (Google Citation2014);
ParaViewGeo (ParaViewGeo Citation2014);
QUT's Groundwater Visualisation System (GVS; Cox et al. Citation2013); and
Cesium (Analytical Graphics, Inc. Citation2013)
Speed/efficiency;
Scalability;
Open source;
Free;
Easy to install;
Cross-platform (Windows, Mac, Linux);
Usability and interactivity (simple intuitive user interface);
Compatibility with common formats;
Visualization richness (ability to turn layers on and off, specify colors and styles);
Customisability – how easy is it to customize/tailor; and
Web Browser support – software should not require downloads but should work in commonly used Web browsers (Chrome, Firefox, Internet Explorer).
Table 1. Survey of 3D globe-based visualization platforms.
3.1. NASA World Wind
The primary advantages of NASA World Wind (NASA Citation2014) and the GA Suite (Geoscience Australia Citation2014a, Citation2014b) include that: they are free, open-source, and extensible; they support Open Geospatial Consortium standards (WMS/WFS) and they support temporal data and animations.
The main disadvantages of NASA World Wind and the GA Suite include: they are not browser plug-ins. Software needs to be downloaded and installed and the subsurface visualization appears to be less reliable and inferior to Cesium's ‘ground push’ capability.
3.2. Google Earth
The principal advantages of Google Earth (Google Citation2014) are that: it is freely available for Windows, Mac, Linux; it is very easy to install; it uses a familiar intuitive user interface; and it is already widely adopted.
The main disadvantages of Google Earth are: it does not yet support subsurface visualization; there is limited (but non-interactive) support for 3D geometries on the surface using Collada; it is closed-source software, so cannot be extended; and it does not support GOCAD models.
Recent research has demonstrated the effective use of Keyhole Markup Language to model and visualize borehole data on Google Earth (Zhu, Wang, and Zhang, Citation2014). However this work did not support 3D sub-surface visualization or the overlay of hydrogeological stratigraphic models.
3.3. ParaViewGeo
The main advantages of ParaViewGeo (ParaViewGeo Citation2014) are: it is free and open source (based on ParaView) and it claims to support a broad range of file formats. (VTK, ARC, GOCAD, VRML, PLY, DEM, ESRI Shape files).
The main disadvantages of ParaViewGeo are: it does not support a ‘virtual globe’ view of the data; it is not a Web Browser product so software/plug-ins need to be downloaded and installed. We were also unable to get our GOCAD/TSurf models to load into ParaViewGeo, possibly due to format version incompatibilities.
3.4. QUT's Groundwater Visualization System
The advantages of GVS (Cox et al. Citation2013) include that: it is a commercial product that has been developed over past 5–10 years and is currently used by a number of CSG companies for internal use. It has a rich visualization and browsing interface.
The disadvantages of GVS (at the time of our assessment) are: it is not open source, so there is no community of developers and it cannot be easily customized without additional costs. Because it is a commercial product, users need to purchase a license. It does not currently have a Web browser version (however, at the time of our evaluation, one was believed to be under development). Input files (e.g. GOCAD, GMS, LeapFrog models) also require conversion into GVS's proprietary format prior to uploading.
3.5. Cesium
The advantages of Cesium (Analytical Graphics, Inc. Citation2013) include: it is free and open source, with an active development community associated with it; it is customizable and easy to program (based on HTML, Javascript, CSS, WebGL); the use of WebGL hardware acceleration means rendering and exploring is fast; it can quickly load and visualize both GOCAD models and OGIA data; it supports Open Geospatial Consortium OGC standards, temporal data, and animations. Finally, the availability of a ‘ground-push’ plug-in enables sub-surface visualization of bore data and hydro-geological stratigraphy.
The main disadvantages of Cesium are: a Chrome Frame plug-in may be required to run Cesium on early versions of Internet Explorer and Cesium does not allow polygons to have vertices with different heights (hence additional development was necessary to support GOCAD TSurf models).
3.6. Results of virtual globe software evaluation
The results of the evaluation process described above, indicated that Cesium (Analytical Graphics, Inc. Citation2013) is the optimum approach for implementing the 3D Water Chemistry Atlas.
The key strengths of Cesium compared to the other four systems are that: it is free and open-source; it is Web-browser based, cross-platform and does not require any downloads; it is fast and scalable; it is readily customisable/extensible and is supported by an active international community of developers; it supports parsing of GOCAD models and other GIS standards; it supports subsurface 3D data display and interactivity. It is also based on WebGL (Khronos Group Citation2013) – a JavaScript API which has been adopted by most modern browsers for rendering 3D graphics on the Web. Cesium is also able to visualize data from the Open Geospatial Consortium's Web Map Service or OpenStreetMap, and to draw vector data stored in Esri Shapefile format. It also supports visualization of time series data through animations.
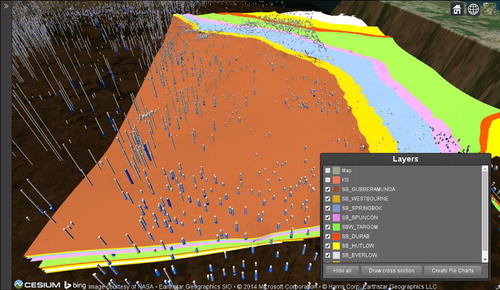
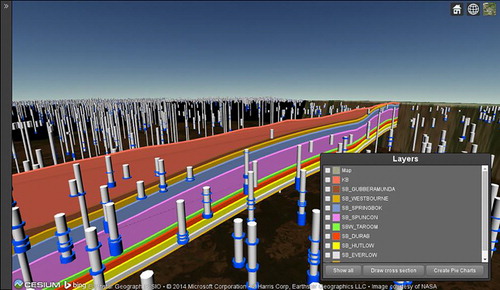
One of the greatest advantages of Cesium is its unique ability to support ‘ground-push.’ Cesium's ground-push plug-in (NICTA Citation2014) enables ‘excavation’ of the terrain within a user-defined rectangle and texturing of the region with a different terrain tile, to visualize geospatial data or a subsurface context. This feature is employed by NICTA in the Subspace project for 3D geospatial visualization and modeling of groundwater reservoirs as they change over time (NICTA Citation2013) and is a key factor in our decision to adopt Cesium ().
4. System design and implementation
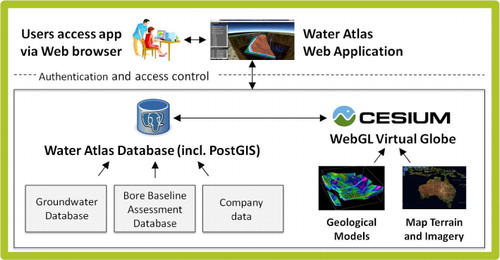
Following the selection of the underlying visualization platform (Cesium), the next step involved the design of the back-end database and overall system architecture. A high-level view of the system architecture is provided in . It comprises three key components:
A PostGreSQL database with (PostGIS Citation2014) indexing for storing the Groundwater and Baseline Assessment datasets and the CSG companies' borehole datasets.
Cesium – the 3D visualization platform that enables 3D sub-surface visualization of groundwater chemistry data and geological strata using ‘ground push’ and runs on WebGL compatible browsers, including current versions of Chrome or Firefox.
Geological Models, Map data and Digital Terrain models (acquired from the UQ School of Earth Sciences) that are loaded into Cesium on-the-fly.
5. Database establishment and functionality
The process for establishing the database comprised the following steps:
Identify and acquire the relevant datasets;
Perform QA/QC on the datasets;
Develop a common data model and map the datasets to the common data model;
Develop scripts to upload the data into the database; and
Implement search/filter of the datasets and the retrieval/presentation of results.
5.1. Selection and acquisition of relevant datasets
The following datasets were identified as the most relevant and critical for integration in the first phase of the project:
The State Government GWDB (Queensland Government Citation2014) – a publically available database maintained by the State government (Department of Natural Resources and Mines) that contains information about all registered water bores in Queensland, including: stratigraphy, water chemistry, water levels, bore casing information, screen/perforation depth.
The BBAD – hosted by the OGIA, this comprises data collected by CSG companies during the approval (and baseline monitoring) process. Companies are typically assigned a set of existing registered bores (already in the GWDB) as well as new monitoring bores that they have to establish. They are required to provide data that verifies location, casing information, water chemistry, water levels, and the formation at each depth from which water is drawn. The BBAD data should be consistent with the GWDB (but it frequently is not) and should extend the GWDB with more recent and detailed analyses and geological information.
CSG well data (water level and chemistry data) collected by CSG companies from their gas-producing wells and provided to OGIA as part of the ongoing monitoring and compliance checking process.
The geological (or lithostratigraphic) model being used is the Surat Supermodel developed for OGIA by Hamilton, Esterle, and Sliwa (Citation2014) and Tyson et al. (Citation2014). This model was developed using well data, wireline logs, and stratigraphic horizon markers interpreted within wells (core logs) using the workflow described in Office of Ground Water Impact Assessment (Citation2014). The resulting Geological Model is imported from a SKUA/GOCAD TSurf file and exported to: a JSON file on the Web server, designed for efficient transfer and uploading by the Cesium Web client; and PostGIS tables in the database, enabling use of server-side geospatial queries to compute user-defined cross sections of the geological model.
5.2. Performing QA/QC on the data
QC was essential to filter erroneous data generated due to poor sampling methods, equipment failure, or varying threshold detection limits amongst different laboratories. below, which has been informed by previous work (Grigorescu Citation2011; Hodgkinson and Grigorescu Citation2013), lists the filtering criteria applied to the datasets to flag erroneous/dubious data prior to uploading to the integrated database. Currently this is performed manually but automating the QA/QC process is a high-priority, future objective.
Table 2. Data rejection/filtering criteria applied during QA/QC processing.
5.3. Mapping to a common data model
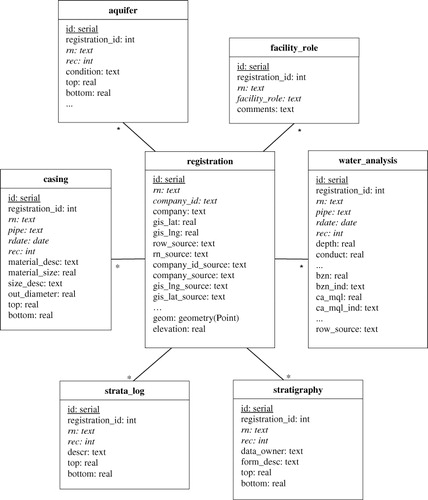
For the common data model, we adopted a subset of the GWDB schema and extended this with additional fields required to describe additional data recorded in the Bore Baseline Assessment Database. The GWDB contains details for all registered bores in Queensland, including: registration (registration and facility role), aquifers, casings, stratigraphy (stratigraphy, strata_log), and water analyses. These are illustrated in the database schema diagram () below. For a complete description of fields in the GWDB, see the Groundwater Database Data Dictionary and Standards document (Queensland Government Citation2011).
In addition, the 3D CSG Water Chemistry Atlas has been designed to support uploading of additional monitoring data generated by company partners. These data include: bore details (Company ID, Registered Number, Company, Longitude, Latitude, and Sampling type [‘Baseline’ or ‘CSG well’]) and water analysis records (Bore ID, RN, Sample date, and 54 analysis parameters [e.g. ‘Al_dis_mg/L,’ ‘Ca_mql,’ ‘Charge balance error’]). For an explanation of the abbreviations used for analysis parameters (e.g. bzn for Benzene, mql for milliequivalents per liter), see the Bore Baseline Assessment Database Data Dictionary (Queensland Water Commission Citation2011).
Two additional fields were added to the registration table to support geospatial operations: geom, which encodes a bore's longitude/latitude in WGS 84 coordinates; and elevation, which represents the height of the top of each well above mean sea level.
provides a graphical overview of the common data model (tables, variable names, value types) used to map and aggregate the GWDB, BBAD, and company datasets. PHP scripts were written to map and upload the GWDB, BBAD, and company datasets into the corresponding PosteGreSQL database tables. In addition, the Geological ‘Surat Supermodel’ was imported from a GOCAD TSurf file and exported to: a JSON file on the Web server, designed for efficient transfer and loading by the Cesium Web client; and PostGIS tables in the database, enabling use of server-side geospatial queries to compute user-defined cross sections of the geological model.
5.4. Web portal and search interface
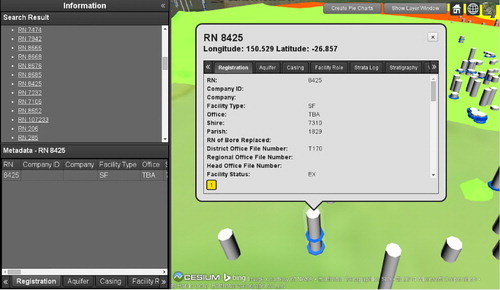
Access to the 3D CSG Water Atlas Portal is via a secure login interface on the project's Web site (The University of Queensland Citation2014). The user interface currently supports the following capabilities:
Ability to search/filter and retrieve datasets based on specific spatial regions, well/bore numbers, time periods or company/organization bore data;
Ability to visualize bore data superimposed on geological strata, in 3D.
Ability to export subsets of the data
Users can execute search and retrieval of wells based on well properties, including:
Registration Number (RN) or Company ID
Company Name
Sample type: ‘Baseline,’ ‘CSG well,’ GWDB’
Record source: ‘GWDB’
Facility type, Office, Shire.
A formation filter can be applied across the database by clicking the ‘Filter formations’ button at the top of the 3D scene. This restricts the wells displayed to those that take in water from at least one aquifer having a formation assignment that matches the formations specified in the filter.
6. Analytical services
The 3D CSG Water Atlas currently supports three categories of analysis tools:
Groundwater analysis charts (e.g. Piper diagrams, Stiff diagrams, line charts, and pie charts);
Geological model cross-sections;
Comparison of formation assignments from different sources.
6.1. Groundwater analysis charts
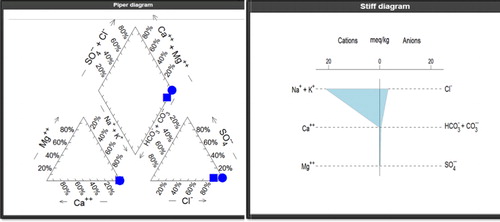
Standard geochemical analysis tools such as Piper diagrams and Stiff diagrams, which provide graphical representations of the chemistry of a water sample (i.e. relative milliequivalent concentrations of anions and cations), can be dynamically generated from the database for individual or selected wells (e.g. in a given region; see ).
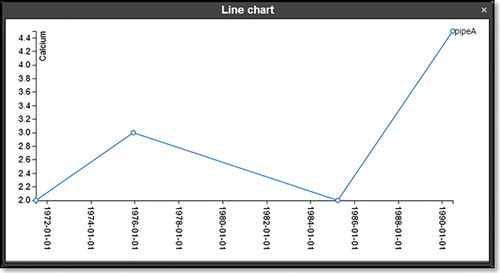
The 3D CSG Water Atlas also supports the rendering of line charts that show temporal trends in water quality parameters. below shows Calcium concentrations at a particular well depth over time. These charts are implemented in JavaScript using the Data-Driven Documents (D3) open-source library (Bostock Citation2014).
Water quality parameters for wells/bores can also be plotted against trigger values specified by environmental authorities or recommended guidelines – to enable users to determine whether the water quality meets recommended guidelines or its suitability for reuse (e.g. drinking water, stock watering, irrigation).
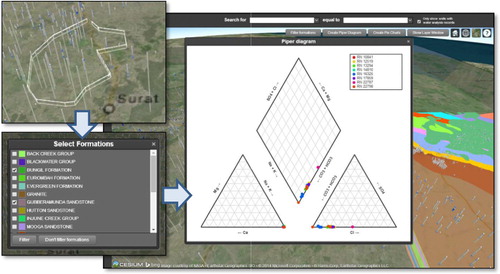
Support has also been added for regional Piper diagrams that aggregate ion concentrations from all water analysis records within user-specified geographic areas or geological formations (). The constraint is specified by the user drawing a polygonal boundary within the 3D scene or by selecting one or more formations.
6.2. Geological cross-sections
Users are also able to interactively specify cross-sections (by drawing a line between two points). Using the ST_Intersection PostGIS operation, the Cesium prototype is able to dynamically generate model layer cross-sections (as shown in below).
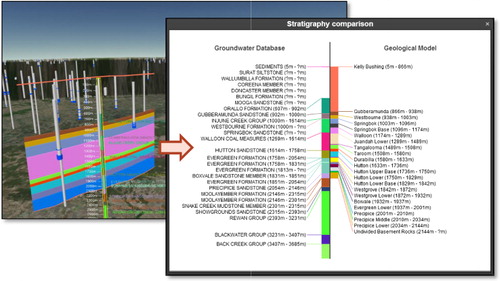
6.3. Comparing and checking formation assignments
The geological model data loaded into PostGIS can also be used to check historical formation assignments at different depths for each well. This is achieved by matching the geographic coordinates (latitude/longitude) of each well with a series of points intersecting the layers in the model. The automatically determined formation assignments can then be compared to the GWDB's stratigraphy records (or aquifer formation assignments) using the ‘Stratigraphy comparison chart,’ as shown below in . This streamlines the updating of formation assignment records as new geological interpretations become available.
7. Stakeholder feedback
The 3D CSG Water Atlas has established a robust, extensible, interoperable platform that is designed to support future scaling up of datasets, analytical services, and users. The response to-date from both government agencies and CSG companies has been positive. However several common requests have emerged from user feedback meetings that provide valuable direction for future development. This feedback has included requests for the following features:
The ability to improve the consistency of formation and aquifer assignments in the Groundwater and BBADs and in the company datasets by automatically detecting and highlighting outliers or inconsistencies; Visualization of data in relation to percentile values for water quality parameters or in relation to ANZECC Water Quality guidelines (Agriculture and Resource Management Council of Australia and New Zealand Citation2000). For example: ‘show me all wells that lie outside 80 percentile for Na (P80) in the Hutton layer’;
Visualizations that show temporal trends in groundwater chemistry (i.e. support for 4D). For example, users have requested support for 2D/3D contour maps that show how the distributions of specific ionic constituents change spatio-temporally (e.g. show me an ‘animated contour map of TDS (salinity) on the Springbok geological layer for the selected region and time period’);
The ability to upload, overlay, and compare different geological models;
Interactive selection of regions, time periods, and formations to display geochemistry using standard tools (e.g. Piper diagrams, Stiff diagrams; pie charts, scatter plots);
Incorporation of new datasets including: property boundaries, mining lease boundaries, road networks;
More sophisticated authentication and access control mechanisms that support restricted access to certain datasets, models, services;
The incorporation of predictive models that enable users to choose different scenarios or input parameters and to visualize modeled outcomes in terms of impact on both water quality and quantity.
8. Conclusion
By combining the open source Cesium virtual globe platform with a common data model and PostGreSQL database, we have been able to rapidly develop a rich 3D sub-surface visualization interface to an integrated knowledge-base that provides an effective communication tool for CSG stakeholders (industry, government, and community groups), project partners and the general public.
In the process we have also produced a system with some highly innovative features including: enhancements to the Cesium open source software tool to support 3D sub-surface visualization of both geology and groundwater chemistry through ‘ground-push’; a common data model for integrating ground water chemistry datasets; an automatable QA/QC workflow for improving the quality of the ground water chemistry data and improving the assignment of water chemistry data to aquifers; and new analytical services that can dynamically generate water chemistry analysis graphs (including Piper diagrams, Stiff diagrams, trend graphs) for user-defined regions.
The resulting availability of a common Web-based portal to multiple integrated datasets that have undergone rigorous QA/QC will facilitate greater sharing and reuse of data and knowledge, encourage engagement between stakeholders and streamline interpretations of the monitoring data, ultimately improving our ability to assess the potential impact of human activities (CSG extraction, agriculture, coal mining) on ground water chemistry.
Acknowledgments
We would like to acknowledge funding from the CCSG, as well as the valuable contributions to the project from the other team members: Chih-hao Yu (School of ITEE), Joan Esterle (School of Earth Sciences), Alex Wolhuter and Jiajia Zheng (CWIMI) and Jim Underschultz (Sustainable Minerals Institute ).
Disclosure statement
No potential conflict of interest was reported by the authors.
Additional information
Funding
References
- Agriculture and Resource Management Council of Australia and New Zealand and the Australian and New Zealand Environment and Conservation Council 2000. “Australian and New Zealand Guidelines for Fresh and Marine Water Quality: Volume 1 – The Guidelines.” http://www.environment.gov.au/resource/australian-and-new-zealand-guidelines-fresh-and-marine-water-quality-volume-1-guidelines.
- Analytical Graphics, Inc. 2013. “Cesium – WebGL Virtual Globe and Map Engine.” http://cesiumjs.org.
- Australian Government. 1999. “The Environmental Protection and Biodiversity Conservation Act 1999 (EPBC).”
- Baldwin, C., P.-L. Tan, I. White, S. Hoverman, and K. Burry. 2012. “How Scientific Knowledge Informs Community Understanding of Groundwater.” Journal of Hydrology 474 (2012): 74–83. doi:10.1016/j.jhydrol.2012.06.006.
- Barcelona, M. J., J. P. Gibb, J. A. Hellfrich, and E. E. Garske. 1985. Practical Guide for Ground-Water Sampling, 169. U.S. Environmental Protection Agency, EPA/600/2-85/104.
- Bostock, M. 2014. “D3 – Data Driven Documents”. http://d3js.org/.
- Cox, M. E., A. James, A. Hawke, M. Raiber. 2013. “Groundwater Visualisation System (GVS): A Software Framework for Integrated Display and Interrogation of Conceptual Hydrogeological Models, Data and Time-series Animation.” Journal of Hydrology 491: 56–72. doi:10.1016/j.jhydrol.2013.03.023.
- Dafny, E., and D. M. Silburn. 2014. “The Hydrogeology of the Condamine River Alluvial Aquifer, Australia: A Critical Assessment.” Hydrogeology Journal 22: 705–727.
- Geoscience Australia. 2014a. “World Wind Suite.” https://github.com/ga-m3dv/ga-worldwind-suite.
- Geoscience Australia. 2014b. “EarthSci.” https://github.com/GeoscienceAustralia/earthsci.
- Google. 2014. “Google Earth.” http://www.google.com/earth/.
- Grigorescu, M. 2011. Jurassic Groundwater Hydrochemical Types, Surat Basin, Queensland — A Carbon Geostorage Perspective. Brisbane: Geological Survey of Queensland. http://trove.nla.gov.au/work/150968507?q&versionId=164587995.
- Hamilton, S. K., J. S. Esterle, and R. Sliwa. 2014. “Stratigraphic and Depositional Framework of the Walloon Subgroup, Eastern Surat Basin, Queensland.” Australian Journal of Earth Sciences 61 (8): 1061–1080. doi:10.1080/08120099.2014.960000.
- Hodgkinson, J., and M.Grigorescu. 2013. “Background Research for Selection of Potential Geostorage Targets—Case Studies from the Surat Basin, Queensland.” Australian Journal of Earth Sciences 60 (1): 71–89. doi:10.1080/08120099.2012.662913.
- Howe, P., C. Moran, and S. Vink. June 9–11, 2010. “Framework for Assessing Cumulative Effects of Mining Operations on Groundwater Systems.” Proceedings of the 2nd International Congress on Water Management in the Mining Industry, Santiago, June 9–11.
- Khronos Group. 2013. “WebGL – OpenGL ES 2.0 for the Web.” http://www.khronos.org/webgl/.
- Kinnon, E. C. P., S. D. Golding, C. J. Boreham, K. A. Baublys, and J. S. Esterle. 2010. “Stable Isotope and Water Quality Analysis of Coal Bed Methane Production Waters and Gases from the Bowen Basin, Australia.” International Journal of Coal Geology 82 (3–4): 219–231. doi:10.1016/j.coal.2009.10.014.
- NASA. 2014. “NASA World Wind Java SDK.” http://worldwind.arc.nasa.gov/java/.
- Nghiem, L. D., T. Ren, N. Aziz, I. Porter, and G. Regmi. 2011. “Treatment of Coal Seam Gas Produced Water for Beneficial Use in Australia: A Review of Best Practices.” Desalination and Water Treatment 32 (1–3): 316–323. doi:10.5004/dwt.2011.2716.
- NICTA. 2013. “Subspace Project.” http://cesiumjs.org/demos/subspace.html.
- NICTA. 2014. “Cesium Ground-Push Plugin.” https://github.com/NICTA/cesium-groundpush-plugin.
- NSW Government Chief Scientist and Engineer. 2014. “Independent Review of Coal Seam Gas Activities in NSW. Managing Environmental and Human Health Risks from CSG Activities.” September. http://www.chiefscientist.nsw.gov.au/__data/assets/pdf_file/0006/56922/140930-Final-Managing-Environmental-and-Human-Health-Risks.pdf.
- Office of Ground Water Impact Assessment (OGIA). 2014. Queensland Government Department of Natural Resources and Mines3. Brisbane, Queensland.
- ParaViewGeo. 2014. “Open Source Visualization for Geoscience.” http://paraviewgeo.objectivity.ca/.
- PostGIS. 2014. “Spatial and Geographic objects for PostgreSQL.” http://postgis.net/.
- Queensland Government. 2000. “Queensland Water Act 2000.” https://www.legislation.qld.gov.au/LEGISLTN/CURRENT/W/WaterA00.pdf.
- Queensland Government. 2011. “Groundwater Database Data Dictionary & Standards.” Version 7. Accessed December 13.
- Queensland Government. 2014. “Queensland Groundwater Database.” https://data.qld.gov.au/dataset/groundwater-database-queensland.
- Queensland Water Commission. 2011. “Bore Baseline Assessment Database Data Dictionary.” Version 0.7, December 2013. https://www.dnrm.qld.gov.au/__data/assets/pdf_file/0015/31317/bore-baseline-assessment-dictionary.pdf.
- Queensland Water Commission. 2012. “Underground Water Impact Report for the Surat Cumulative Management Area.” http://www.dnrm.qld.gov.au/__data/assets/pdf_file/0016/31327/underground-water-impact-report.pdf.
- SCER. 2013. The National Harmonised Regulatory Framework for Natural Gas from Coal Seams 2013. Canberra: Standing Council on Energy and Resources. http://scer.govspace.gov.au/files/2013/06/National-Harmonised-Regulatory-Framework-for-Natural-Gas-from-Coal-Seams.pdf.
- The University of Queensland. 2014. “3D Coal Seam Gas Water Atlas Portal.” http://3dwa.metadata.net/?page=Portal.
- Thompson, S., and J. Loeliger. 2013. “Australia: Coal Seam Gas (CSG) – National Regulatory Update.” Holding Redlich. http://www.mondaq.com/australia/x/274750/.
- Tyson, S., J. Esterle, D. Shields, M. Reilly, M. McKillop, and A. Roslin. 2014. Geological Modelling Approach for the Eastern Surat Basin (Priority Model Area). Report to OGIA. Brisbane, Queensland: Office of Ground Water Impact Assessment (OGIA), Queensland Government Department of Natural Resources and Mines.
- Van Voast, W. A. 2003. “Geochemical Signature of Formation Waters Associated with Coalbed Methane.” AAPG Bulletin-American Association of Petroleum Geologists 87: 667–676.
- Wang, Y., G. Huynh, and C. Williamson. 2013. “Integration of Google Maps/Earth with Microscale Meteorology Models and Data Visualization.” Computers & Geosciences 61: 23–31.
- Williams, J., T. Stubbs, and A. Milligan. 2012. “An Analysis of Coal Seam Gas Production and Natural Resource Management in Australia.” A report prepared for the Australian Council of Environmental Deans and Directors by John Williams Scientific Services Pty Ltd, Canberra.
- Zhu, L.-F., X.-F. Wang, and B. Zhang. 2014. “Modeling and Visualizing Borehole Information on Virtual Globes Using KML.” Computers & Geosciences 62: 62–70. doi:10.1016/j.cageo.2013.09.016.
- Zhu, L., J. Sun, C. Li, and B. Zhang. December, 2014. “SolidEarth: A New Digital Earth System for the Modeling and Visualization of the Whole Earth Space.” Frontiers of Earth Science 8 (4): 524–539.