
Abstract
Due to advances in satellite and sensor technology, the number and size of Remote Sensing (RS) images continue to grow at a rapid pace. The continuous stream of sensor data from satellites poses major challenges for the retrieval of relevant information from those satellite datastreams. The Bag-of-Words (BoW) framework is a leading image search approach and has been successfully applied in a broad range of computer vision problems and hence has received much attention from the RS community. However, the recognition performance of a typical BoW framework becomes very poor when the framework is applied to application scenarios where the appearance and texture of images are very similar. In this paper, we propose a simple method to improve recognition performance of a typical BoW framework by representing images with local features extracted from base images. In addition, we propose a similarity measure for RS images by counting the number of same words assigned to images. We compare the performance of these methods with a typical BoW framework. Our experiments show that the proposed method has better recognition performance than that of the BoW and requires less storage space for saving local invariant features.
1. Introduction
The volume of Remote Sensing (RS) imagery continues to grown at an enormous rate due to advances in sensor technology particularly high spatial resolution systems. Traditional textual metadata such as geographic coverage, time of acquisition, sensor parameters and manual annotation for example are now insufficient to efficiently retrieve images of interest from large-scale image databases. Textual metadata have proved to be insufficient (Chawla et al. Citation2001) for articulating interesting content included in geospatial images. Consider a situation where a user wants to retrieve an image within a Region Of Interest (ROI) from a large-scale RS image database. Even if the accurate latitude and longitude ranges of the ROI image were given, traditional image retrieval systems might not be able to retrieve the correct image because some returned images may be covered by cloud. In order to provide a better service, new methodologies and prototype systems for visual selection and query by example are needed to assist image information mining. Such systems can search a large data-set to find visually similar matches to a given query – be it a full image, an image patch or a ROI image.
Recently, a Bag-of-Words (BoW) framework which was initially proposed for text categorization has been introduced for image retrieval and object-based classification. Several BoW image retrieval systems were developed and used in the field of computer vision – these included the Non-Parametric Object and Scene Recognition System (Torralba, Fergus, and Freeman Citation2008), the Automatic Target Detection System (Hao et al. Citation2012) and the Urban Area Segmentation System (Weizman and Goldberger Citation2009). Given a query image, the above systems can return images that have similar objects or similar texture patterns. An element common to all the above systems is that local regions of images are characterized using ‘visual words’ selected from a discrete vocabulary. The function that maps an image patch descriptor into this vocabulary is an active area of research, but most approaches all perform some form of clustering using example images as a training data-set. This visual word assignment method is likely to produce misclassification. During the process of visual word assignment, two features that are separated by a very small distance may be assigned to different visual words and two features that are relatively far apart may be considered to be identical. As a result the recognition performance of a typical BoW framework becomes very poor when the approach is applied to RS image retrieval application scenarios where the appearance and texture of RS images are very similar.
In this paper, an improved BoW framework for RS image retrieval is presented. This image retrieval approach differs from a traditional BoW framework in the two following respects. Firstly, in traditional BoW frameworks the codebook is created using clustering algorithms. These algorithms include hierarchical k-means (Nister and Stewenius Citation2006), approximate flat k-means (Lepetit, Lagger, and Fua Citation2005) and others. Our approach, described in section 3, does not use a cluster method to generate the codebook. We take some RS images as base images and the codebook is generated by local features from these base images. Base images play the role of a standard template image in our approach. Secondly, in traditional BoW frameworks, descriptors extracted from images are quantized by assigning the label of the closest codeword. In our approach, a geometric verification process is introduced to improve recognition performance.
This paper presents our method for efficiently querying a particular object from a large-scale RS image database as follows. Section 2 outlines related work that has been done in the field of RS image retrieval. Section 3 presents in detail our method for implementing the representation of images with features extracted from base images. The image similarity computation procedure is also introduced in section 3. The evaluation procedure and an analysis of the results are provided in section 4. Section 5 concludes with a discussion.
2. Related work
In general, image retrieval approaches can be classified into two classes: approximate matching and exact matching.
2.1. Approximate matching
The task of approximate matching is finding ‘visually similar’ images to a query image. In approximate matching, the database images and the query images do not necessarily represent objects with the same identity, but they are of the same category. For example, the query images for the object category ‘airport’ can represent Beijing airport, while there might not be an image of such an object in the database. The goal of such systems is to identify the semantic-category of the object, for example, a river versus a road, rather than identifying the exact same physical object. These kinds of systems are highly related to the vast field of Content-Based Image Retrieval (CBIR).
In recent years, the RS community has begun to realize the proficiency of CBIR systems in RS imagery retrieval and in RS image information mining. A number of Content-Based RS Image Retrieval (CBRSIR) systems have been proposed and implemented with varying degrees of success during the last decade. The following systems are typical CBRSIR systems. PicSOM (Molinier, Laaksonen, and Hame Citation2007) is a CBRSIR system. The system can query by visual examples with a relevance feedback loop for the interactive learning of user-level semantics. ICAMS (Samal et al. Citation2009) was developed to provide scientists with a tool to visualize, characterize, and analyze RS image from NASA's Earth Observing System (EOS) (Quattrochi et al. Citation1997). It receives its input from the user in the form of a query image and a ROI within this image using a graphical interface. ICAMS identifies regions in an image that are of interest to the user and finds similar occurrences of those regions of interest in a database of RS images. GeoIRIS (Shyu et al. Citation2007) also supports query by example; furthermore, it supports query by object and multiobject spatial relationship queries, as well as semantic queries, to answer information needs such as ‘given a query image, show me a set of satellite images that depict objects and spatial relationships that are similar to those in the query and that are located within a certain radius of a landmark.’ The above systems have investigated spectral features, shape features, structure features, and texture features. Some other researchers investigate local invariant features for RS image retrieval. Yang and Newsam (Citation2013) performed a thorough evaluation on local invariant features for RS image retrieval. Their experiment demonstrated that local invariant features were more effective than color and texture features for RS image retrieval.
2.2. Exact matching
In exact matching, the goal is to retrieve the correct identity of the object. In other words, given a query image, in which a particular object has been selected, the system can return from the image database a set of representative images in which that object exists. This is a harder problem than whole-image retrieval, since the query object may be across different illuminations, different seasons, and different sensors, or seen from different viewpoints.
Full Representation (FR) and BoW are two approaches for building such exact image matching systems. FR stores individual local descriptors for each image and searches directly for nearest neighbors in full features. Then, it formulates a ranking function and applies this to every image in the data-set before returning a ranked list. The FR method has better recognition performance than BoW, but larger memory requirements (Aly, Munich, and Perona Citation2011). When the number of images rises into the millions, it is very difficult for a FR approach to build index-trees for searching nearest neighbors in a feature space. For this reason, FR approaches are not suitable for image retrieval in large databases. The BoW framework, on the other hand, uses the k-means algorithm to cluster feature descriptors into ‘visual words’ and represent an image using visual word occurrences. In BoW frameworks, all descriptors from image are quantized and discarded. This significantly reduces the storage requirements for features.
As the BoW approach is suitable for image retrieval in a large-scale image database, it has been widely used in the field of computer vision. However, the recognition performance of a typical BoW framework becomes very poor when the framework is applied to application scenarios where the appearance and texture of images are very similar. In order to improve the performance of the BoW framework, some researchers focus on employing various image representations that aim to capture the important parts of the image. They include the Histogram of Gradients (HoG) descriptor (Shu et al. Citation2012) and the spatial pyramid of visual words (Dong et al. Citation2010). Some other researchers focus on improving the precision of visual words assignment. Philbin et al. (Citation2008) proposed the concept of soft word assignment, which made use of multiple word assignment to reduce the quantization error in large vocabularies. Herve, Matthijs, and Schmid (Citation2008) proposed a hamming embedding algorithm in which the location within a visual word was encoded to allow for improved accuracy using smaller vocabularies.
Although the above methods improve the recognition performance of the BoW framework, the recognition performance of the BoW framework cannot match that of the FR model. This is because the BoW framework was first designed for solving the Object Category Recognition (OCR) problem. Many methods used in BoW belong to standard classification methods. For example, visual words in the codebook are clustered from many image features: they do not represent any specific object but a kind of class center. Feature assignment is also implemented by searching for the nearest class centers. So, OCR is a problem of pattern classification in nature. Therefore, further improvements should be made so that the BoW framework can better solve the Specific Object Recognition problem.
In this paper, we propose an improved BoW framework for RS image retrieval in large-scale image databases. The novelty of our approach is that we generate a visual word codebook with features extracted from base images. These base images play the role of standard template images and are high-quality images selected from RS data-sets. The similarity between two images is obtained through computing the distance between each of the two images and a template image. In our experiment, we achieve improved performance and a low-memory requirement.
3. Image query framework
In this section, our RS Image Retrieval (RSIR) Framework, which is tuned specifically for RS imagery, will be described.
The challenge of specific-object retrieval for RS images is hard compared to that for ordinary images, due to the characteristics of RS images. First, RS images have varying numbers of bands or channels depending on the sensors carried on the satellite. Sometimes the images may need to be radiometrically corrected across all channels before the feature extraction process is carried out. Secondly, the size of RS images is very large. For example, a full TM image contains 6920 pixels in each of 5728 lines. Therefore, RS images produce a large number of local features. The amount of data may even exceed what can be stored in the available memory. Thirdly, the difference between the appearances of different RS images is small. This means there can be many RS images with similar textures in the database, and target recognition accuracy can be seriously decreased.
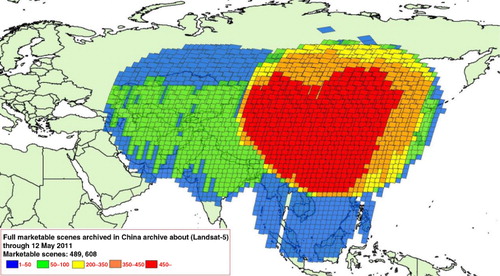
Many RS images in image databases are repeatedly taken at the same ground area at different times. These images are near-duplicate images which have almost the same appearance and texture pattern. Features extracted from these images contain a lot of redundant information. Here, we take the Landsat-5 Earth observation satellite as an example to explain the above concept.
shows a map of Landsat-5 TM archive coverage. The images within the red region were acquired at the Beijing ground station. Data within the blue and green regions were acquired by the Sanya and Kashi ground stations, respectively. There are over 450 real Landsat scenes in each frame that is colored red. Because a strong correlation exists between the images in the large archive of historical images of the same area, the features extracted from these images have a strong correlation between them too. In other words, most of the local invariant features extracted from RS images of the same area are similar. Therefore, long-term RS images sequences of the same area can be represented by the features contained in just one image of the sequence. In this paper, we select a few base images, also called template images, from RS images sequences of the same area. Visual words in the codebook are extracted from these base images.
The RSIR framework used in this study is shown in .
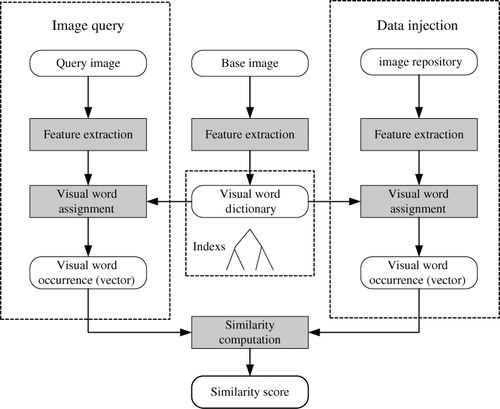
Our RSIR framework contains three modules: Feature Extraction (FE), Visual Word Assignment (VWA) and Similarity Computation (SC). For offline injection, all database images are processed in the FE and VWA module. Next, these images are represented with visual words from base images. At the RS image retrieval stage, the query image is converted into a feature vector. The most similar RS images are then obtained by the SC module.
3.1. The base image selection method
According to the characteristics of RS images, two rules for selecting base images from RS image archives were set up.
First, the base images should be totally cloud-free. This is because cloud may cover some areas that are of interest to the user. Cloudless RS images ensure that the object of interest is fully visible.
Secondly, for long-term RS image time series, we select images that are located near the middle of the data acquisition period as the base images. The appearance of RS images in long-term historical image archives can change greatly due to environmental change and human activities. The longer the time interval is between the acquisitions of images, the greater will be the difference in the appearances of the images. The difference between two images located at different ends of the temporal series could be very large and there may not even be enough similar local features to perform the geometric verification process.
3.2. Method for extracting local invariant features from RS images
3.2.1. Detector selection for RS images
There are two steps in using local invariant features for image retrieval. First, a detection step identifies interesting locations in the image and then a descriptor is computed for each of the image patches centered at the points of interest.
The first major consideration in the development of our RSIR framework is the determination of which feature detector will be used.
In this study, Lower's (Citation2004) Scale Invariant Feature Transform (SIFT) was used for the feature extraction stage. The SIFT descriptor is extracted from the image patch center at each point of interest. Although there are other detectors, such as the Hessian-Laplace/Affine, that can better handle affine distortion, they are not suitable for application to RS images. First of all, the SIFT detector is translation-, rotation- and scale-invariant, which is the level of invariance needed for RS image retrieval. An RS image is acquired from a relatively fixed viewpoint (overhead) which limits the amount of non-uniform scaling and shearing, so affine distortion generally is not an issue for RS images. Secondly, affine-invariant detectors have also been shown to perform worse than similarity-invariant descriptors when the transformation is restricted to translation, rotation, and uniform scaling (Mikolajczyk and Schmid Citation2004). Thirdly, an extensive comparison with other local descriptors found that the SIFT descriptor performed the best in an RS image matching task (Lindeberg Citation1998). Using SIFT, RS images with different ground resolutions, acquired by different satellites, can achieve a correct match.
3.2.2. Preprocessing
Before feature extraction, multiband RS images should be converted to grayscale images. Remote imagery data are available in multiple bands. Each band captures a different wavelength range that has different properties and is used for specific purposes. For example, some bands enable water bodies to be distinguished while others are favored for the detection of vegetation. Multiband data provide more information than single band data and multiband data provide valuable information for the object description and matching tasks. Take Landsat-5 TM data as an example: the generated grayscale image is a monochrome intensity image computed from bands 5, 4 and 3.
Band 5 is a mid-infrared image and contains the most abundant ground information. Band 4 is a near-infrared image and has a very low correlation with other bands. Band 3 corresponds to the red part of the visible spectrum. The combination of bands 5, 4, and 3 is also used for Landsat-5 browse images. The combination is performed using the following equation.
3.2.3. Distinctive feature selection
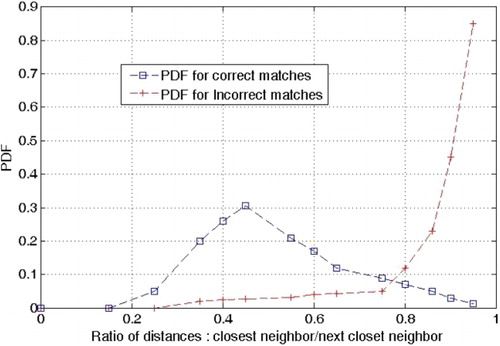
The number of local invariant features extracted from an RS image is quite large. Too many features will significantly increase the burden of subsequent processing; for example, it will enlarge the index size during image retrieval. This means that it is worth selecting informative features from the whole feature set. In general, features which are extracted from similar local structures are likely to be mismatched in the image database. Therefore, it would be useful to have a way to discard non-distinctive features. In general the distance between distinctive features and other features is large, and the distance between non-distinctive features and other features is small. If, for a given feature, the ratio of the distance to the closest neighbor to that to the second-closest neighbor is larger than a global threshold, then the feature is considered to be a non-distinctive feature. The non-distinctive feature is filtered out using EquationEquation (2):
3.3. Representation of RS image with visual words from base images
The process of image representation has two steps. The first step is visual word assignment and the second step is feature arrangement.
3.3.1. Visual word assignment
In typical BoW frameworks, the assignment of features to a visual word is performed using the search for the nearest word (Turcot and Lower Citation2009). A visual word is generated by using a clustering algorithm such as hierarchical k-means. This visual word assignment method is likely to produce misclassification. During the process of visual word assignment, two features that are separated by a very small distance may be assigned to different visual words and two features that are relatively far apart may be considered to be identical.
In our approach, visual words in the codebook are the features extracted from base images. The process of visual word assignment is converted to a feature matching process. This process is shown in .
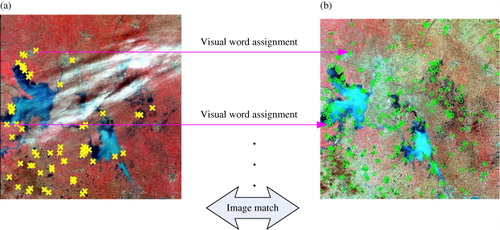
Given an image I, we first find the candidate match point pairs for each feature of the image by identifying its nearest neighbor in the visual word codebook. Two features, A and B, are matched if DA–B/DA–C < t, where A is the feature in image I, and B and C are visual words in the codebook. B is the nearest neighbor of A, and C is the second nearest neighbor of A. DA–C is the Euclidean distance between A and C. t is the threshold, which lies in the range [0, 1]. We reject all matches in which the Euclidean distance ratio of the descriptors is greater than 0.6.
After selecting the candidate matches, a geometric verification method is introduced to remove more false matches. We applied the Random Sample Consensus algorithm (RANSAC) to achieve geometric verification. RANSAC estimates the fundamental matrix of the transformation between images and it can handle rigid transformations very effectively. The following is an overview of the geometric verification process.
We randomly selected four matched pair points from the candidate point pairs. The coefficients of similarity transformation were calculated by using the coordinates of these point pairs.
The similarity transformation model was used to determine the subset of points that were within some error tolerance – these points were named ‘inliers’.
The process and model with the largest number of inliers was selected. The inliers were the final matching point pairs.
3.4. Feature arrangement
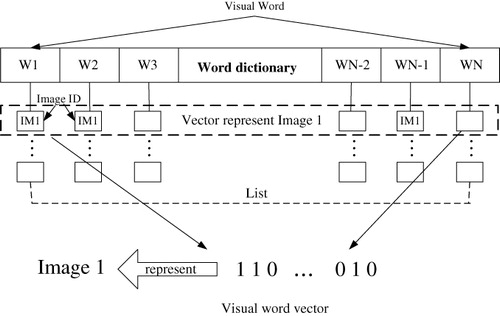
After visual word assignment, the images are represented by vectors of the occurrence of visual words. These vectors are stored in a kind of queue structure, as shown in . We created a list for each visual word in the codebook. These lists are used for saving the image ID. If an image has a feature which is assigned to a visual word, the image ID should be recorded in the corresponding list of the visual word.
3.5. Similarity computation
In the approach described here each image in the database is represented by a multidimensional visual word vector. The similarity between two images is determined by comparing their signatures, as represented by the visual word vectors. Because the visual word vectors used in this approach are sparse vectors, the direct distance calculation method, which calculates the Euclidean distance between the feature vectors of the two images, is not able to achieve a good performance. We computed the similarity between two images by counting the number of visual words assigned to the two images that were the same. Then, we use the computed similarity to derive a ranked list of images that were ordered according to their distances from the query image. An overview of the similarity calculation process is presented in .
In our approach, an image is represented by a visual word occurrence vector. This means that in the visual word codebook, some visual words are assigned to the features of the image. Then the size of the projected region of an image in the codebook is defined as the number of assigned visual words for the image.
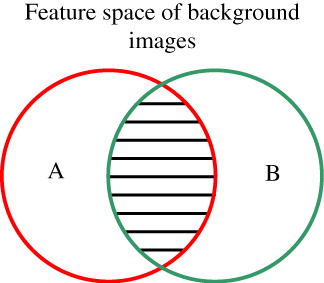
In , the whole rectangular region represents the whole visual word codebook. Circle A is the projected region of image A; circle B is the projected region of image B. The region of overlap for images A and B can be calculated using EquationEquation (3).
The similarity values’ range is between 0 and 1. A large similarity value means that the compared images are similar and the overlapping regions comprise a large proportion of the images. When the similarity value equals 1, the compared images are exactly the same; a value equal to 0 means that the images being compared are completely different. The geographical region of overlap and the appearance of the compared images have an influence on the similarity value. A high similarity value can be obtained when two compared images contain high percentages of areas of geographical overlap and are similar in appearance at the same time. If one of the compared images is covered by cloud, however, even if the images are of the same area, the similarity value will be low.
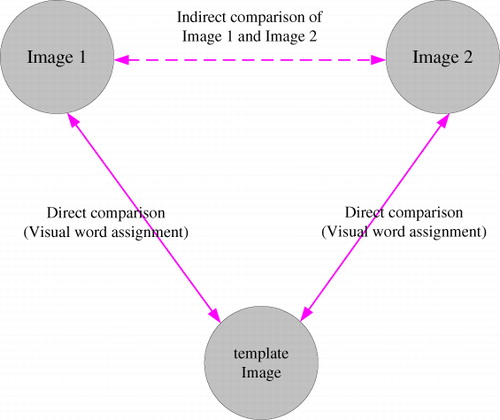
Our image representation and similarity computation method is different from that of the typical BoW framework. Although there are some formal resemblances between our approach and the typical BoW framework, they are different in nature. In a BoW framework, visual words from many different image features are clustered and they do not represent any specific image patch. Visual word assignment, either hard assignment or soft assignment, is essentially a classification of training vectors. In our approach, each visual word has a geographical position. The process of visual word assignment, in fact, is converted to an image matching process that matches individual local descriptors for the compared images. When the similarity between two images is then computed, the distance between the two images is not directly calculated. In fact, an indirect comparison is performed. The base images in our approach play the role of template images. A schematic diagram for the indirect comparison process is shown in . In , I1 and I2 are two images. Images similar to both I1 and I2 are searched for separately in the database of base images. If I1 and I2 have a common similar image in the set of base images then I1 and I2 are similar images. The comparison between I1 and the base image is performed by searching for the nearest features in a feature database.
3.6. Analysis of storage requirements
In both the typical BoW framework and our approach, the visual word occurrence is stored as an inverted file. For every visual word, the inverted file stores the list of images that contain it. At run time, only images with overlapping words are processed – this saves a lot of time and provides exact search results.
The storage requirements for our approach consist of two parts:
In the first term, s1 is the number of bytes per feature dimension, d is the number of dimensions in the feature vector, N is the number of base images, and F is the average number of features per image.
In the second term I is the number of images in the database, F is the average number of features per image, s2 is the number of bytes per image ID, and r is the ratio of the number of correctly matched features to the total number of features in an image. In general, only 10% of the features in an image matching process are correctly matched. We set r to 0.1.
The storage requirement for the typical Bow Framework also consists of two parts:
The storage for both the typical BoW framework and our approach contain two parts: the visual word storage and the storage for the image lists. In general, the size of the codebook in our approach is larger than that for the BoW framework. However, when the number of images is large, the second term plays a more important role than the first term. That is to say, in large-scale image databases, our RSIR framework needs less storage than the typical BoW framework.
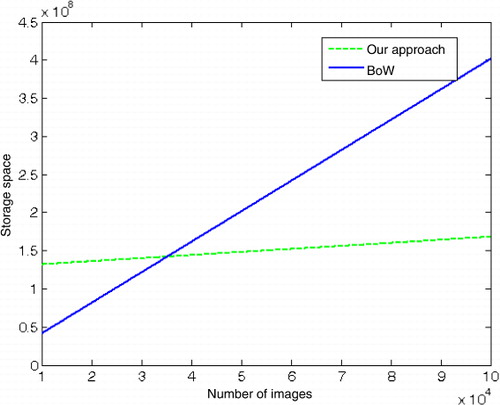
shows a theoretical comparison of the storage requirements of the two methods. We supposed that there were 1000 base images, which would be enough to cover the whole of China. Each image has about 1000 local invariant features. We used a SIFT descriptor with 128 dimensions, so s1 is 1 and d is128. The image ID is an integer, so s2 is 4. Under these conditions, when the number of images is over 35,000, the BoW solution will occupy more space than our approach.
4. Experiment and analysis
We used the typical BoW (Sivic and Zisserman Citation2003) framework as the baseline to evaluate the recognition performance of our approach.
4.1. Experimental data-set
The data-set used for evaluating the performance consisted of Landsat-5 TM data. This data-set contained 8223 RS images of size 512 × 512 pixels. These images were taken at 20 different locations. The range of Worldwide Reference System (WRS) indexes for these images were 121 to 132 for the orbits (path) and 39 to 40 for the centers (row). Because these images were acquired at different times, many kinds of image distortion existed in the data-set, including changes in lighting, occlusion by clouds. This data-set, therefore, provided a comprehensive image transformation situation to evaluate the image recognition performance.
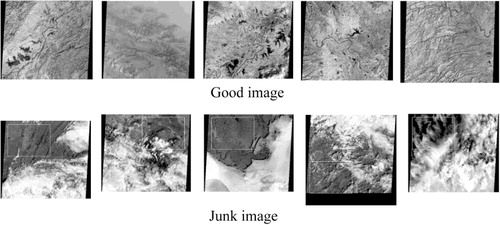
shows some example images from the data-set. Some images in the data-set are cloud-free images and some are junk images, meaning that most of the images are covered with cloud. Junk images can also be used as query images in our approach because some parts of the images may be region of interest.
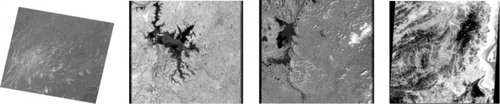
Sixty RS images acquired by the HJ-1A, SPOT4 and Landsat-7 satellites were used as query images. These images are of the same region as the data-set but with different ground resolutions and different orientations.
A sample of a few query images is shown in .
Base images were manually selected from the data-set according to the rules described in section 3.1. We evaluated the effect on the retrieval performance of using different numbers of base images. We selected 1 to 4 RS image scenes for each WRS region in our experiment.
In the typical BoW framework, the codebook size has an obvious influence on the retrieval performance. In general a larger vocabulary size will produce higher retrieval performance. However, the benefit of using large vocabularies will become very small when the codebook size is very large. In our experiment, we generated a visual vocabulary of 10, 100 and 200K words from our data-set using an approximate k-means cluster method (Philbin et al. Citation2007). At the visual word assignment stage, both hard assignment and the soft assignment methods were applied in the BoW framework. In soft-assignment, a descriptor is mapped to a weighted combination of visual words, rather than ‘hard-assigned’ to a single word. The motivation for using the soft assignment method was to compare our approach with some state-of-the-art image retrieval systems.
4.2. Recognition performance
The basic function provided by our system is the specific object query. Given a query image, the system should return images of the same region. We used two methods to evaluate the query results.
The Average Precision (AP) score was used to evaluate the recognition performance. AP is the mean of the image precision across all recall rates and provides a single numerical metric for the overall recognition performance of an algorithm. The AP value can be visually interpreted as the area under a precision recall curve.
In a real system, the user is always only concerned about the Top N returned images. So, we evaluated the results using a so-called Top N method. This method counts the number of positive results and calculates the accuracy rate for the first N returned images. Top N = Npositive/N. In our experiment, we set N to be 20. When the number of returned images is lesser than 20, we set N to the number of returned images.
4.3. Test results
4.3.1. Amount of storage space requirement
In section 3.5, we compared the storage occupation of our approach and that of the BoW framework in theory. We further evaluated the storage occupation of our approach through the following experiment. The total number of features in the whole data-set was 12.3 million. These features occupied 1.5 gigabytes of storage space. In the BoW framework, the histograms of visual words are stored in an inverted file. Each image in the BoW framework needs about 4kb of storage space. Our approach also uses inverted files to store visual words. However, only about 10% of features are assigned visual words. One image needs about 0.4k bytes of storage space in our approach.
The amount of storage for a typical BoW framework and for our RSIR framework is summarized in . In , 1BI means there is one base image per WRS area.
Table 1. Comparison of occupied storage space for FR, BoW, and our approach.
In , the total occupied storage space for our approach is smaller than that for the BoW framework. This result shows that our earlier analysis was correct.
In practical application, a system must meet the requirement of high-resolution RS images retrieval. If we used high-resolution RS images as base images, there would be too much visual words in a codebook. The location metadata contained in RS images can be used to reduce codebook size during the generation of a codebook. A large codebook can be divided into many small codebooks according to the location information of visual words. When retrieving RS images, our system will first determine which small codebook should be used. Further visual assignment processes are performed within the small codebook.
4.3.2. Recognition performance
The result of the Top N and the AP for a typical BoW framework and our approach are summarized in and . It can be seen from that, in most cases, the query performance of our approach is better than that of the BoW framework.
Table 2. Comparison of the performance of the Top 20 scores for BoW framework and the RSIR framework.
Table 3. Comparison between the AP scores of the BoW framework and the approach used in this study.
Because the geometric verification process is performed during the visual word assignment, the probability of two unrelated features being assigned to the same visual word is very small. If two images have no common visual words in the codebook, the similarity between the two images will be zero. So the Top N value of our approach is 1. In the typical BoW framework, similar features can map to different visual words, particularly if the textures of the compared images are similar and so the returned image list may contain some irrelevant images in the typical framework.
shows a comparison of the query results for the BoW framework and our approach.
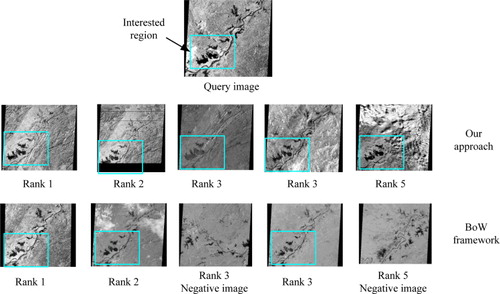
The WRS path/row of the query image was 121/39. The image in the second line gives the results returned using our approach. The query image is the ROI within the blue rectangle in the image. All the returned images for our approach were positive answers. The third line shows the results retrieved using the BoW framework. Rank 3 and rank 5 in this line are negative answers.
Our approach achieved the best AP performance when four base images in one WRS area were used. Compared to the hard assignment, the soft assignment method slightly improved AP performance. But the performance improvement is not obvious. In the 1BI case, some images may have not enough assigned visual words due to severe image distortions. Using more base images means there is a higher probability that more matched point pairs exist. However, using a very large number of base images requires a large amount of storage space to the preserve codebook and also increases the computational complexity of the visual word assignment process. The experimental results also show that the AP scores grow slowly when the number of base image exceeds three per area. Overall, in this experiment, the AP score obtained using our approach was better than that obtained using the BoW framework.
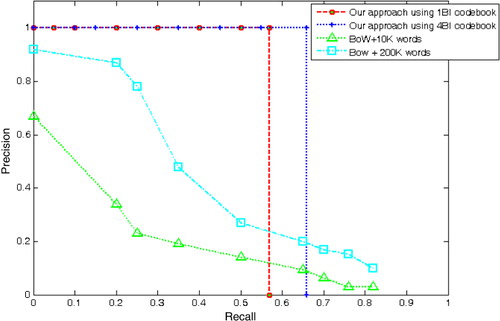
is the Recall-Precision Curve (RPC) for the comparison of the AP performance of the BoW framework and our approach. It can be seen that the performance of our approach is better than that of the BoW framework. Although the BoW framework can achieve a high recall rate, the corresponding precision is too low to be of any practical use.
5. Conclusion
The retrieval of a specific object from an RS image database is a challenging task. In this paper, we have presented a framework that can efficiently query RS images from a large-scale image database based on the features of base images. The proposed approach is especially designed to solve the problem of specific-object recognition in RS image databases. We feel that our study will be of interest to the RS community.
The focus in this paper was on the method of generating a visual word codebook from base images. In our approach, only features that have correct matching pairs in the codebook are preserved and can affect the query result. This means that the visual word assignment is reliable. This significantly improves recognition performance in the image retrieval process and reduces the burden of building the image index. We analyzed the characteristics of RS image and presented a method of filtering out non-distinctive features from the whole set of features.
The experiment described in this paper showed that the proposed method can significantly improve recognition performance for RS images while reducing storage requirements for image features.
While the focus is on RS image retrieval, the RSIR framework can be used in other fields, such as image mosaic applications in which the embedded data is selected automatically. We also hope our research can be integrated into practical RS image retrieval systems.
Acknowledgments
The authors would like to thank the support of 135 Strategy Planning of Institute of Remote Sensing and Digital Earth, CAS.
Reference
- Aly, M., M. Munich, and P. Perona. 2011. “Indexing in Large Scale Image Collections: Scaling Properties and Benchmark.” In 2011 IEEE Workshop on Application of Computer Vision. Rio de Janeiro, Brazil, October 14–20. doi:10.1109/WACV.2011.5711534.
- Chawla, S., S. Shekhar, W. L. Wu, and U. Ozesmi. 2001. Modeling Spatial Dependencies for Mining Geospatial Data: An Introduction, in Geographic Data Mining and Knowledge Discovery. New York: Taylor & Francis.
- Dong, X., J. C. Tat, Y. Shuicheng, D. Lixin, and F. C. Shih. 2010. “Near Duplicate Identification with Spatially Aligned Pyramid Matching.” IEEE Transaction on Circuits and Systems for Video Technology 20: 1068–1079. doi:10.1109/TCSVT.2010.2051286.
- Hao, S., S. Xian, W. Hongqi, L. Yu, and L. Xiangjuan. 2012. “Automatic Target Detection in High-resolution Remote Sensing Images Using Spatial Sparse Coding Bag-of-Words Model.” IEEE Geoscience and Remote Sensing Letters 9 (1): 109–113. doi:10.1109/LGRS.2011.2161569.
- Herve, J., D. Matthijs, and C. Schmid. 2008. “Hamming Embedding and Weak Geometric Consistency for Large Scale Image Search.” Proceedings of the 10th European Conference on Computer Vision. Marseille, France, October 12–18.
- Lepetit, V., P. Lagger, and P. Fua. 2005. “Randomized Trees for Real Time Keypoint Recognition.” In Proceedings of IEEE Computer Society Conference on Computer Vision and Pattern Recognition, San Diego, CA, June 20–25.
- Lindeberg, T. 1998. “Feature Detection with Automatic Scale Selection.” International Journal of Computer Vision 30 (2): 79–116. doi:10.1023/A:1008045108935.
- Lower, D. G. 2004. “Distinctive Image Features from Scale-invariant Key Points.” International Journal of Computer Vision 2 (60): 91–110. doi:10.1023/B:VISI.0000029664.99615.94.
- Mikolajczyk, K., and C. Schmid. 2004. “Scale and Affine Invariant Interest Point Detectors.” International Journal of Computer Vision 60 (1): 63–86. doi:10.1023/B:VISI.0000027790.02288.f2.
- Molinier, M., J. Laaksonen, and T. Hame. 2007. “Detecting Man-made Structures and Changes in Satellite Imagery with a Content-based Information Retrieval System Built on Self-organizing Maps.” IEEE Transactions on Geoscience and Remote Sensing 45 (4): 861–874. doi:10.1109/TGRS.2006.890580.
- Nister, D., and H. Stewenius. 2006. “Scalable Recognition with a Vocabulary Tree.” In Proceedings of the 2006 IEEE Computer Society Conference on Computer Vision and Pattern Recognition, Washington, DC, June 17–22.
- Philbin, J., O. Chum, M. Isard, J. Sivic, and A. Zisserman. 2007. “Object Retrieval with Large Vocabularies and Fast Spatial Matching.” In Proceedings of IEEE Conference on Computer Vision and Pattern Recognition, Minneapolis, MN, USA, June 17–22.
- Philbin, J., O. Chum, M. Isard, J. Sivic, and A. Zisserman. 2008. “Lost in Quantization: Improving Particular Object Retrieval in Large Scale Image Databases.” In IEEE Conference on Computer Vision and Pattern Recognition, Anchorage, Alaska, June 23–28.
- Quattrochi, D. A., N. Lam, H. Qiu, and W. Zhao. 1997. Scale in Remote Sensing and GIS: Image Characterization and Modeling System (ICAMS): A Geographic Information System for the Characterization and Modeling of Multiscale Remote Sensing Data. Cambridge: Cambridge University Press, 295–307.
- Samal, A., S. Bhatia, P. Vadlamani, and D. Marx. 2009. “Searching Satellite Imagery with Integrated Measures.” Pattern Recognition 42 (11): 2502–2513. doi:10.1016/j.patcog.2009.01.035.
- Shu, C., X. Q. Ding, and C. Fang. 2012. “Histogram of Oriented Gradient for Face Recognition.” Tsinghua Science and Technology 16: 216–224. doi:10.1016/S1007-0214(11)70032-3.
- Shyu, C.-R., M. Klaric, G. J. Scott, A. S. Barb, C. H. Davis, and K. Palaniappan. 2007. “GeoIris: Geospatial Information Retrieval and Indexing System – Content Mining, Semantics Modeling, and Complex Queries.” IEEE Transactions on Geoscience and Remote Sensing 45 (4): 839–852. doi:10.1109/TGRS.2006.890579.
- Sivic, J., and A. Zisserman. 2003. “Video Google: A Text Retrieval Approach to Object Matching in Videos.” In Proceedings Ninth IEEE International Conference on Computer Vision, Nice, France, October 13–16.
- Torralba, A., R. Fergus, and W. T. Freeman. 2008. “80 Million Tiny Images: A Large Data Set for Nonparametric Object and Scene Recognition.” IEEE Transactions on Pattern Analysis and Machine Intelligence 30: 1958–1970. doi:10.1109/TPAMI.2008.128.
- Turcot, P., and D. G. Lower. 2009. “Better Matching with Fewer Features: The Selection of Useful Features in Large Database Recognition Problems.” In IEEE 12th International Conference on Computer Vision Workshop, Kyoto, Japan, September 27–October 4.
- Weizman, L., and J. Goldberger. 2009. “Urban-area Segmentation Using Visual Words.” IEEE Geoscience and Remote Sensing Letter 6 (3): 388–392. doi:10.1109/LGRS.2009.2014400.
- Yang, Y., and S. Newsam. 2013. “Geographic Image Retrieval Using Local Invariant Features.” IEEE Transactions on Geoscience and Remote Sensing 51: 818–832. doi:10.1109/TGRS.2012.2205158.