
Abstract
Driven by the rise of Web 2.0 and the non-stop spread of mobile device sensors, the concept of Public Participation GIS (PPGIS) is knowing a revolutionary era which perfectly fits the new vision of Digital Earth (DE). This research investigates the opportunity to build up a PPGIS prototype with completely Free and Open Source Software (FOSS) architecture, in which data directly come from field surveys carried out by users. A sample application related to urban monitoring is addressed, which concentrates on user field-collected data concerning reports of road pavement damages. Open Data Kit suite allows users to collect geotagged multimedia information using mobile devices with onboard location sensors (e.g. a Global Positioning System receiver). On field-captured data are sent to a server and stored into a PostgreSQL database with PostGIS spatial extension. GeoServer then disseminates data on the Web. On the client-side, different solutions allow data visualization on both desktop computers and mobile devices. The designed architecture provided support for FOSS usage in the process of gathering, uploading, and Web publishing information collected in situ. The implementation of the developed PPGIS could thus substantially increase public active participation in data creation and sharing, besides enlarging DE knowledge up to the local level.
Keywords:
1. Introduction
One of the most cited definitions conceives geographic information systems (GIS) as a combination of hardware, software, data, people, organizations and institutional arrangements for collecting, storing, analyzing, and disseminating spatial information (Dueker and Kjerne Citation1989). This early statement was already provided with a non-secondary social component, insofar as reference is made to the involvement of multiple actors. The GIS participative aspect was bound to become successful, as the term Public Participation GIS (PPGIS) was coined in the mid-1990s to highlight the use of GIS as a tool for promoting community intervention in policy decision-making. In a somehow similar way the concept of Digital Earth (DE), envisioned 15 years ago by the US Vice President Al Gore (Citation1998), had later to be updated in light of the recent developments which recognize participation as a key element.
Not surprisingly, the best conditions for an initial, effective accomplishment of PPGIS paradigm would have come about a decade after its first definition with the advent of Web 2.0, a concept coined by O'Reilly (Citation2005) to denote the new, interactive nature of the Web allowing users to share and disseminate contents as never before. This bidirectional approach, as opposed to the traditional one-directional one (Goodchild Citation2007a) and based on user-generated content (Rinner, Keßler, and Andrulis Citation2008), was then naturally extended to the Geospatial Web, which denotes the collection of services and data supporting the use of geographic information over the Internet (Scharl and Tochtermann Citation2007). Participation in the so-called GeoWeb 2.0, defined by Maguire (Citation2007) as ‘the geographic embodiment of O'Reilly's ideas for the general Web,’ was recently pushed by the massive proliferation of mobile devices, which are equipped with sensors (e.g. cameras) to get georeferenced data and network connection to transmit it in real time on the Web. Proliferation of wireless sensors and broadband Internet connection, which allows a constantly updated observation of the planet, are fundamental components in shaping the future vision of DE (Craglia et al. Citation2008).
While research has been extensively conducted on the social and critical role of PPGIS (Sieber Citation2006; Elwood Citation2006), on GIS applications somehow promoting public participation (e.g. Brown, Montag, and Lyon Citation2012) and field-data collection through mobile devices (Burke et al. Citation2006), little attention has been given to the implementation of architectures capable of entirely managing data from its gathering in situ to its publishing on the Web. Furthermore, whilst the effort of the open source community was recognized as a source of the technological innovations needed to achieve the new vision of DE (Craglia et al. Citation2012), literature on PPGIS mainly attests the use of proprietary software (e.g. Simão, Densham, and Haklay Citation2009; Bugs et al. Citation2010).
Against this background, the purpose of the study is to test the use of Free and Open Source Software (FOSS) to conceive a participative system able to: (1) allow citizens to perform field surveys using common mobile devices, compiling and submitting ad hoc questionnaires together with multimedia data, that are registered through the mobile device sensors (e.g. the camera), and georeferenced through a mobile device positioning service (e.g. the Global Positioning System [GPS]); (2) automatically store and manage data into a spatial database through an authentication mechanism and provide Web publication using standard protocols; and (3) build up Web interfaces for visualizing data on both desktop computers and mobile devices.
The results of the experimentations, which have been carried out in relation to a local urban monitoring issue (i.e. road pavement damages), should provide support for the usage of the FOSS-based developed architecture in both similar monitoring-related situations and, potentially, in circumstances characterized by the need of real-time availability of data collected on the field (e.g. emergency management).
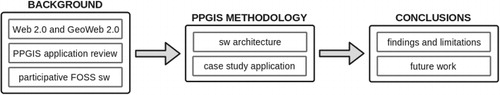
The remainder of the paper is structured as follows (see ). First, a deeper description of PPGIS development related to the Web evolution, a literature review of PPGIS applications and a glance on current FOSS tools useful to achieve participative and collaborative GIS systems are proposed. This is followed by a description of the implemented architecture and a presentation of its usage. The paper concludes with a summary of the research findings and limitations and offers directions for future research.
2. Background
2.1. GeoWeb revolution as a consequence of Web 2.0 era
This section focuses on the tremendous change of Internet mapping technologies occurred after the dawn of Web 2.0, which justified the consequent technical innovations in PPGIS applications described later.
The delivering of geographic information over the Web started in the early 1990s with the development of the Xerox PARC Map Viewer (Putz Citation1994), which showed all the limitations connected to the first epoch of the Geospatial Web or GeoWeb 1.0. As it was for the whole Web 1.0, interaction was quite poor and user experience proved to be not particularly pleasurable (Haklay, Singleton, and Parker Citation2008). According to Plewe (Citation2007), this first stage of Web mapping was characterized by an access to spatial information through public mapping agencies, using a paradigm qualified by Goodchild (Citation2007a) as ‘top-down, authoritarian, centrist.’ A first, notable step toward collaboration in spatial data management took origin at about the end of last century thanks to the Open Geospatial Consortium (OGC), which began to establish standards for Web mapping interoperability (Peng and Tsou Citation2003).
The evolution of Internet applications was officially accomplished with Web 2.0 (O'Reilly Citation2005), a term used to point out the generational change affecting World Wide Web. First shift happened in the used technologies, where Asynchronous JavaScript and XML (AJAX) allowed the development of rich Web applications, which became more and more similar to the desktop ones (Graham Citation2005) by strongly enhancing user interaction (Zucker Citation2007). As a consequence, Web communication paradigm turned into a bidirectional collaboration model, where users were no longer mere consumers but could generate and share their own contents, for example, into wikis, blogs, social networks, and media sharing sites.
As an increasing proportion of Web information could be indexed through a spatial component, this revolution was immediately absorbed within Geospatial Web and gave rise to GeoWeb 2.0 (Maguire Citation2007) or Web Mapping 2.0 (Haklay, Singleton, and Parker Citation2008). AJAX technology allowed the birth of many mapping application programming interfaces (APIs), for example, Google Maps and Yahoo Maps, which provided advanced functionalities and high-resolution data. By means of APIs, Web mapping applications were turned from being static, complex to use and restricted to a small public, to become dynamic, easier to use, and more accessible also for nonexpert people. APIs greatly enriched user interaction thanks also to neogeography, a term attributed to Eisnor (Citation2006) and explained by Turner (Citation2006) as the ‘new geography’ in which even nonexpert users could easily create their own Web mapping applications, for example, by mashing up two or more sources of spatial information to create customized maps. Annoni et al. (Citation2011) recognized the importance of APIs, as they first allowed users to become contributors in the development of DE. With the same philosophy of Web 2.0, users could share their own geographic contents by geotagging them, that is, providing their metadata with spatial coordinates (Rinner, Keßler, and Andrulis Citation2008).
Another concept born in the frame of GeoWeb 2.0 is volunteered geographic information (VGI), introduced by Goodchild (Citation2007b) to promote human beings as sensors able to voluntarily register and publish geographic data from the ground. As last, one of the most important results of GeoWeb 2.0 was crowdsourcing (Howe Citation2006), whose major example is still today OpenStreetMap (Haklay and Weber Citation2008). Highlighting the contribution of individuals as providers of geospatial data, VGI and crowdsourcing were recognized as an opportunity for supporting the new vision of DE (Annoni et al. Citation2011).
Non-stop technological enhancements and OGC standards proliferation over the years have made advanced Web mapping applications of DE quite commonplace. Current available data have incredibly increased not just because more and more people, organizations, and entities decided to publish it on the Web, but also because a notable stack of geographic information is registered by the sensors installed on today's mobile devices. The ubiquitous network formed by these Web-enabled wireless sensors, able to capture and transmit geotagged data, has led to the definition of participatory sensing (Burke et al. Citation2006). The continuous flow of information from physical as well as human sensors will more and more allow a representation of DE which, from purely static, can become dynamic and interactive (Craglia et al. Citation2012).
All these premises allow to better understand the panorama of PPGIS applications discussed in the next section.
2.2. PPGIS as shaped by Web 2.0
The term PPGIS appeared for the first time in 1996 at the meeting of the National Center for Geographic Information and Analysis. PPGIS is focused on the need to exploit GIS technology in order to empower the public and broaden its involvement in policy decision-making (Schroeder Citation1996; Brown Citation2012). The term Participatory GIS (PGIS), sometimes used as a renaming of PPGIS (Sieber Citation2006), denotes instead a rather different concept. Resulting from the merger of Participatory Learning and Action with GIS, PGIS is the practice of promoting the knowledge and the goals of underprivileged groups through GIS tools and methods (Rambaldi et al. Citation2006). Whilst PPGIS specifically addresses public participation in developed countries and is focused on the outcome of the decision-making process, PGIS specially pertains to the rights of nongovernmental organizations and grassroots groups in developing countries, being more focused on the collaborative process of teaching, and sharing geographic knowledge. Howsoever, both PPGIS and PGIS denoted a shift into GIS perception from the purely technical aspect to the institutional and societal one, with a special stress on the issue of democracy (Obermeyer Citation1998).
It is clear that the growth of Web 2.0 technologies made the boundary between PPGIS and VGI sometimes blurred, as both of them deal with user-generated contents delivered through the Web. However, while VGI is by definition voluntarily and usually citizen-initiated, PPGIS implies agency-driven data collection campaigns performed on purpose. With this assumption in mind, the evolution of PPGIS applications from their origin up to the present day is shown in . The proposed literature review is not meant to be exhaustive. It is rather intended to point out few, significant case studies with the purpose of demonstrating PPGIS technical key changes as a consequence of Web 2.0 revolution. For each study an indication of the year, the GIS context (desktop or Web), the admittance of user-generated content, the software used, and the mobile devices integration for field-data collection is shown.
Table 1. Example list attesting the evolution of PGIS applications.
provides two easy observations. First, as suggested by Sieber (Citation2006), PPGIS researches originate from many planning-related disciplines. Second, the rise of Web 2.0 around 2005 proved to be a watershed in terms of technology. In fact, up to that time almost all participatory applications were desktop-based (or even paper-based, e.g. Brown and Reed Citation2000) and consisted in merely performing some GIS analysis and get the public informed about them (Steinmann, Krek, and Blaschke Citation2004). This is the case of the first studies presented in (Oliveira, Medeiros, and Davis Citation1999; Jankowski Citation2009), where the GIS software used was proprietary.
Technological evolutions brought by Web 2.0 had deep impacts on the nature and form of PPGIS (Elwood Citation2008). As already stated, the major expression was represented by Web-based interactive applications built with APIs, which are easy to use, well-documented, and suitable to build interactive mash-ups. lists three examples carried out using Google Maps API: an argumentation map for urban-planning purpose (Rinner, Keßler, and Andrulis Citation2008) and two applications related to urban planning (Bugs et al. Citation2010) and ecosystems services (Brown, Montag, and Lyon Citation2012).
Open source Web Mapping technologies were quite mature and well-established, but they had a limited diffusion due to the higher required level of programming skills in contrast to APIs (Boroushaki and Malczewski Citation2010). An example of FOSS PPGIS application is MapChat, a map-based user discussion for land-use planning (Hall et al. Citation2010). Other studies demonstrate instead the use of proprietary software, which was much more exploited than FOSS after the dawn of Web 2.0. reports a Web-based GIS for collaborative spatial planning (Simão, Densham, and Haklay Citation2009) developed with this kind of technology.
The growing popularity of mobile devices, central to the new vision of DE, has recently cleared the way for a wide range of new participative applications. A significant example is NoiseTube (Maisonneauve, Stevens, and Ochab Citation2010, http://noisetube.net), an OS mobile application using the device microphone and GPS for transmitting noise pollution data which can then be accessed and visualized on the Web.
2.3. GIS FOSS for collaboration and participative field-data collection
In this section, the focus is placed on the current most valuable tools provided by the GIS FOSS community for promoting user participation and content sharing from one side and data collection on the field from the other side.
One of the mainstream participative Web platforms for managing and publishing geospatial data is GeoNode (http://geonode.org). It offers a full system for the collaborative sharing and usage of geographic information by integrating a map server for Web Map Service (WMS) data dissemination, a Catalogue Service for the Web (CSW) server for metadata cataloguing, a framework for user administration, a supporting database, and a WebGIS viewer. GeoNode allows users to save and share customized maps, created by both uploading their own geospatial data and exploiting online publicly available data. In addition, integration with social networks allows map sharing, comment, and rating. Another collaborative FOSS Web tool is MapStore (http://mapstore.geo-solutions.it/mapstore), which provides an analogue range of functionalities to let users’ community interactively build and share maps on the Web.
The second category of participative tools consists of applications running on mobile devices which allow users to gather multimedia data (using the device sensors), geotag it (using a device location service, e.g. the GPS receiver) and upload it on the Web (using the device Internet connection). An example (NoiseTube) has already been mentioned in Section 2.2 and pertains to acoustic data collection using just the device microphone. A more comprehensive tool is the Open Data Kit (ODK) suite (Hartung et al. Citation2010, http://opendatakit.org), which provides a modular framework for building ad hoc forms, compile them on the field, and send them to a server for Web publication. Several data types are supported, for example, texts, numbers, dates, multimedia contents (images, audios, and videos), and barcodes. As ODK has been exploited in the present study, a detailed description of its usage will be given in the following Sections 4.1 and 4.2. An extension of the ODK suite is formhub (https://formhub.org), developed by Modi Research Group from Columbia University. It is a free-hosted data backend service for ODK for those who do not want to set up or manage their own server, thus making data collection simpler and more collaborative.
A similar FOSS mobile application is EpiCollect (Aanensen et al. Citation2009, http://www.epicollect.net), which again allows field-data collection according to predefined forms and provides also immediate data visualization into Google Maps or Google Earth. The system makes also available some statistics related to the user surveyed information but accepts only images as multimedia data type. Another FOSS application based on real-time field-data collection through mobile devices is Decoro Urbano (http://www.decorourbano.org). Born in 2010, it is a 2.0 free tool service which lets citizens send reports concerning situations of urban decay. At the same time, it is a useful tool for public administrations for monitoring their areas, optimizing the management of the intervention works and/or informing citizens about the actions performed. The reported data are also released under Creative Commons license 3.0.
AntiMap (http://theantimap.com) is another open source example of toolset for recording and visualising user own data focused on multimedia contents. The project currently consists of a smartphone utility application (AntiMap Log) for data capture and a couple of Web/desktop applications (AntiMap Simple and AntiMap Video, respectively) for post-analysis and data visualization. Shareabouts (http://shareabouts.org), developed by OpenPlans, is a FOSS Web mapping tool for gathering user inputs such as positions and comments. It is used for urban projects (e.g. designing wayfinding systems, mapping community assets, and emergencies) but, instead of a specific application running on mobile devices, it features a unique Web platform accessible from both desktop computers and mobile devices.
Finally it is worth to mention also the GeoPaparazzi mobile application (http://www.geopaparazzi.eu), which provides a rich framework for mobile data collection allowing, for example, to georeference notes and orientated pictures and to log GPS tracks. The tool is however conceived for personal (nonparticipative) use, as it does not support a default server connection for data upload and Web publication.
3. Work planning
3.1. System architecture
This section presents the overall FOSS architecture which can be built to achieve a comprehensive PPGIS system allowing users to gather and geotag data on the field, upload it on a server and share it on the Web.
The implemented architecture is depicted in . As mentioned above, ODK is used to manage information collection from mobile devices. In particular, the suite is composed of three modules providing complementary functionalities, that is, ODK Build, ODK Aggregate, and ODK Collect. ODK Build is a Web tool allowing users to design forms through an interactive drag-and-drop interface. Once forms are created, they can be loaded into ODK Aggregate, which was configured on an Apache Tomcat server (http://tomcat.apache.org) backed with a PostgreSQL database (http://www.postgresql.org). ODK Aggregate is the ODK suite server module and it is responsible for managing users and forms. It provides blank forms to, and accepts compiled forms from ODK Collect, which is the suite client module and runs on mobile devices equipped with the Android operating system (http://www.android.com).
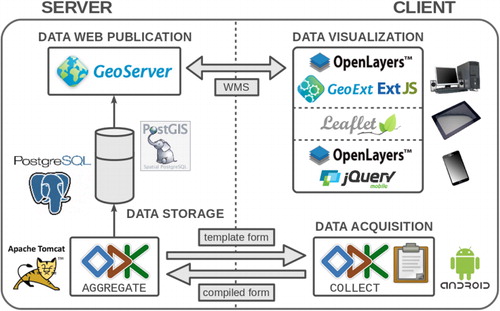
Thanks to PostGIS (http://postgis.net), the PostgreSQL spatial extension, the georeferenced data geometry can be read and WMS published by GeoServer (http://geoserver.org). On the client-side, a viewer built with OpenLayers (http://openlayers.org), GeoExt (http://www.geoext.org), and ExtJS (http://www.sencha.com/products/extjs) allows data visualization and querying from traditional computers. Data can also be accessed from mobile devices (e.g. tablets and smartphones) by means of two other viewers, respectively, based on OpenLayers mobile version coupled with jQuery Mobile (http://jquerymobile.com) and Leaflet (http://leafletjs.com).
3.2. Application case study
In order to test the applicability of the FOSS architecture described in Section 3.1, a simple application related to urban monitoring was considered. In particular, the system was exploited for testing the management of field-collected data concerning reports of road pavement damages. These phenomena occur as a consequence of multiple inducing factors, for example, concentrated loads due to vehicles transit, usury, physicochemical agents, and thermal expansion.
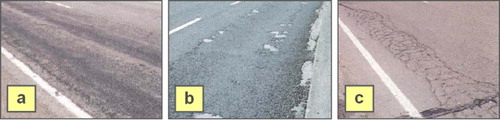
Pavement damages can be classified in terms of category and severity degree. In the context of this study, the adopted classification is the one proposed by the Direzione Generale Infrastrutture e Mobilità (General Head Office for Infrastructures and Mobility) of Lombardy Region, Italy (Regione Lombardia – Direzione Generale Infrastrutture e Mobilità Citation2005). This catalogue sorts pavement deterioration events into three main categories: instability influencing pavement surface, instability influencing pavement regularity, and cracking (see ). In turn, each category groups a number of different phenomena, for each of which the severity degree can be classified as low, medium, or high according to specific qualitative and quantitative considerations.
Source: Regione Lombardia – Direzione Generale Infrastrutture e Mobilità (Citation2005).
4. Methodology
4.1. Form design and management
As mentioned above, form design is achieved using the Build module of ODK suite. ODK Build is an HTML5 Web application providing an easy to use drag-and-drop user interface for the creation of simple forms.
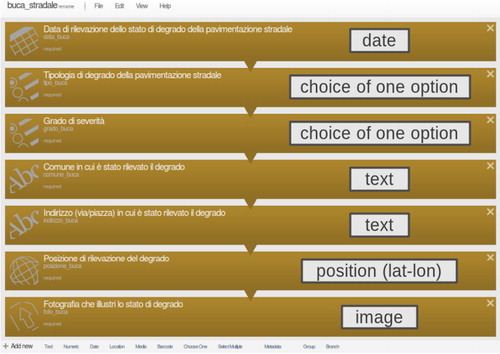
shows form design using ODK Build for the case study under analysis. Goodchild (Citation2007a) stated that lots of information which cannot be extracted by GPS and remote sensing data are well known to citizens, because not much more is required than identifying place-names or street addresses and classifying geographic features by type. In agreement with this theory, the form asks users to provide basic information such as the municipality and address of the pavement damage location and the date of the survey. Users have also to classify the damage event among the three mentioned categories and evaluate its severity as low, medium, or high. Finally, users are asked to register their current position (using e.g. the device GPS) and to provide a picture of the pavement deterioration, by taking it in real time with the device camera or by uploading it from the device archive. As shown in , data typologies involved are date, text, choice of one option from a list, position, and image. Once the form prompts have been defined and arranged in the desired order, the form is exported as an XML file.
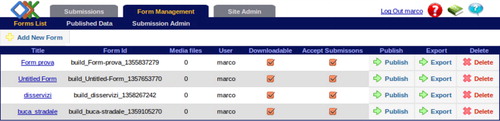
The following step requires to deploy the ODK Aggregate module on a local Tomcat server backed with a PostgreSQL database. ODK Aggregate allows to import and store the forms created with the Build application. Within the Form Management section (), users provided with sufficient privileges can define whether a form is downloadable to ODK Collect and whether to accept submissions of that form. Users can also export form submissions in Keyhole Markup Language (KML) or Comma Separated Value (CSV) format and delete forms together with their submissions. Similar exporting functions and also some statistical representations of submitted forms content are available in the ODK Aggregate Submissions section, where users can access the single forms submitted from ODK Collect.
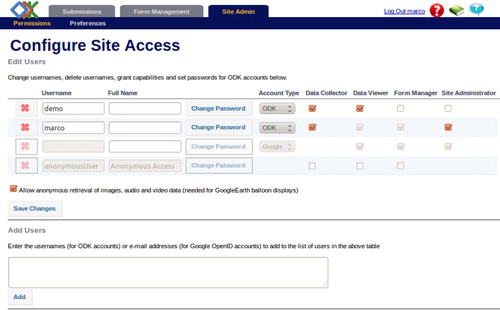
The Site Admin section () allows instead to manage users and their permissions. Having a Site Administrator profile, one can create, modify, delete ODK users, and assign them different privileges. Available profiles are: Data Collector, able to download forms to ODK Collect and submit finalized forms from ODK Collect to ODK Aggregate; Data Viewer, able to filter, view, and export submissions from ODK Aggregate; Form Manager, able to also upload new forms and delete forms and data; Site Administrator, that has all the previous capabilities plus the privilege to manage user permissions. Submitted forms are finally accessible from a third section, named Submissions, which allows users provided with a Form Manager or Site Administrator profile to access the full content of all the submissions and optionally delete them.
4.2. Field-data collection
A user profile with Data Viewer privileges was created and instructions on how to download and use the Android ODK Collect application were arranged. As the goal of the study was primarily to test the applicability of the implemented system (for the purpose, e.g. of a future use by an administrative entity), the instructions were given to a restricted sample (around 20 people) of the two user groups potentially targeted by the application, that is, technicians of local municipalities and common citizens, specifically selected with differentiated profiles (in terms of age, gender, and cultural background). The chosen people, who were also provided with the previously cited reference document (Regione Lombardia – Direzione Generale Infrastrutture e Mobilità Citation2005) to be used for classifying pavement damages, were also invited to provide feedback about the application use and to report possible issues and suggestions.
As already mentioned, Collect is the client-side module of ODK suite and works in conjunction with the Aggregate component. As a matter of fact, once users have downloaded and installed the application on an Android device they have to connect to ODK Aggregate server and authenticate. Having thus access to the forms templates available on Aggregate, the first step is to download the form for reporting road pavement damages, which was created using ODK Build and then imported into ODK Aggregate (see Section 4.1).
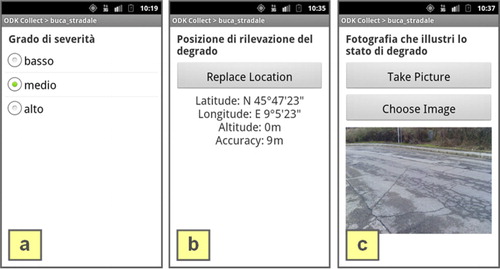
Choosing to compile a blank form and selecting again the template of interest, users access the predefined questionnaire which drives them in the provision of required information: date of the survey, category and severity degree of the deterioration event, municipality and address of the event, position of the event (to be derived from GPS or other device location services, e.g. a wireless network), and picture of the event (to be taken with the device camera or chosen from the device archive). illustrates some steps of form compilation performed on an Android smartphone.
Form filling using ODK Collect does not require an active Internet connection. Once the compilation has been completed, users have the only option to save the finalized form. After that, they can choose if sending the form to ODK Aggregate server (this time an Internet connection is required) or if editing the form again before the submission. This possibility is useful in the case in which users during the field survey do not know (or are not sure about) the answers to be provided.
4.3. Web visualization
Once submitted from ODK Collect, finalized forms content becomes visible in both the ODK Aggregate Submissions section (see Section 4.1) and the PostgreSQL database server which has been jointly configured. Submissions are organized by ODK Aggregate in a data table structure. Each submission corresponds to a single row and each attribute to a single column. In addition, other PostgreSQL tables are created with the purpose of storing the form submitted multimedia data (in the case under consideration, the pavement damage images).
Besides the attribute fields expressly defined during form design (see Section 4.1), multiple additional fields are also created into the PostgreSQL main table. Some of these fields actually contain useful information (e.g. the positioning precision), but the majority of them merely consists in metadata which can be discarded (e.g. the submission identifier, the submission start time and end time). Therefore, exploiting also PostGIS spatial extension for PostgreSQL, a proper SQL view was created in order to extract from the previous table geometrical point entities provided with only the attributes of interest.
The resulting PostGIS vector data were imported into GeoServer and published as WMS. Among the existing Web map servers, GeoServer was chosen due to its ease of use as well as its certified WMS performance (McKenna Citation2011). Within GeoServer, two different layer styles were created using the OGC Styled Layer Descriptor standard (OGC Citation2007). The first style represents pavement deterioration points with different-color flags according to the event severity degree: green for low degree, yellow for medium degree, red for high degree (see –). The second style draws instead a semitransparent circle around each reported point having a radius equal to the survey horizontal positioning precision (see ). This precision value returned from an Android device corresponds to the radius of 68% confidence: in other words, there is a 68% probability that the true location is inside the circle drawn (Android Developers Citation2013). In order to let Web viewers users choose if visualizing or not the points precision circles, two different WMS layers (each using one of the two created styles) were actually published.
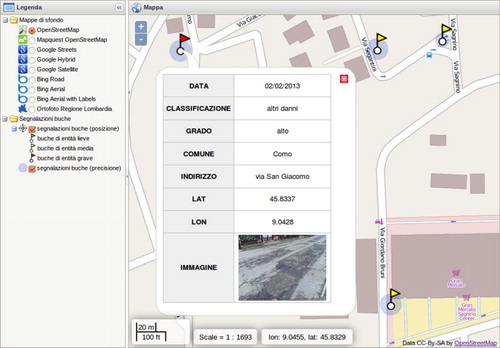
Three different viewers were finally developed to provide users an optimized data interaction according to the type of device they are currently using. As stated above, the first viewer was built for traditional computers (see ) through the use of three JavaScript libraries: OpenLayers for managing geographic data, GeoExt and ExtJS for customizing the Web mapping application. WMS report layer can be superimposed on base maps coming from different servers (OpenStreetMap, MapQuest, Google, Bing, and the local Lombardy Region orthophoto). Exploiting the left-side layer menu, users can also turn on the WMS layer representing positioning precision circles. When a reported point is clicked, a popup shows the results of WMS GetFeatureInfo request which correspond to the citizens’ field-collected data.
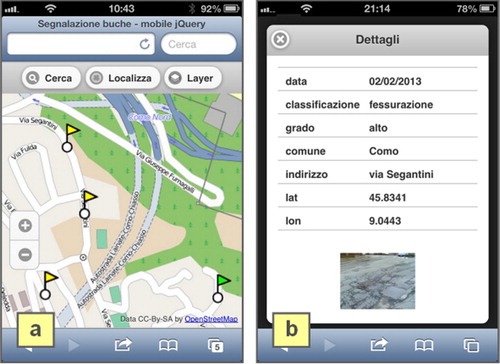
If users access the Web viewer from a mobile device browser (e.g. Firefox Mobile), the system is able to detect it and to redirect navigation on one of two Web pages provided with different viewers. For small-screen devices (e.g. smartphones), a viewer based on OpenLayers mobile version coupled with jQuery Mobile Web framework was built (see ). Besides simple data visualization, the client offers some additional functionalities: the command Cerca (Search) allows to look for a specific location on the map, Localizza (Locate) creates a new point layer representing the estimated position of the device and the Layer menu provides access to the list of available layers. Instead of a popup (which would be difficult to manage on small screens), a new page is used to show the results of WMS GetFeatureInfo (see ).
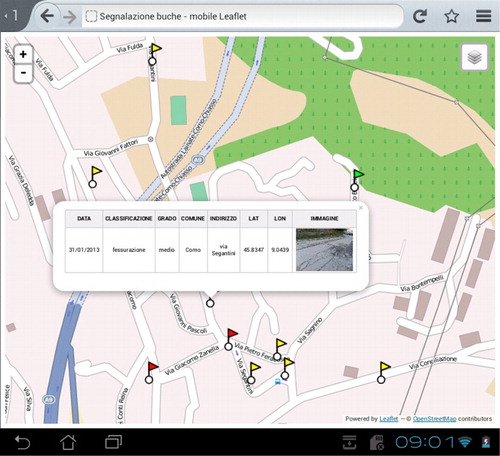
A third viewer was developed for large-screen mobile devices (e.g. tablets) using Leaflet JavaScript library (see ). This is an almost new FOSS product, which provides a pretty interface and natively supports touch-navigation events, running with the same version (unlike OpenLayers) on both desktop computers and mobile devices. Functionality is however still limited with respect to OpenLayers, but WMS GetFeatureInfo request is supported and again exploited to show field-collected data within a popup (see ).
Both the mobile viewers were successfully tested on Apple iOS (iPhone and iPad) and Android devices.
5. Discussion and conclusions
Web 2.0 and technological developments in the field of mobile devices cleared the way for an unprecedented progress within PPGIS. This study contributes to PPGIS literature by investigating the potential of FOSS in building a participative system which provides Web access to field-collected information. It supports the concept of DE as a collaborative system where people provide data and collectively understand phenomena, thus contributing to reduce the gap between science and public (Craglia et al. Citation2012).
Consistent with the idea that humans behave like sensors able to gather precious geographic data from the ground (Goodchild Citation2007b; Annoni et al. Citation2011) and unlike previous researches related to georeferenced user-generated content (Rinner, Keßler, and Andrulis Citation2008; Hall et al. Citation2010), users can feed the system with geotagged multimedia data which have been directly acquired on the field using common mobile devices (e.g. smartphones and tablets). The described experimentation tested the system applicability in relation to a simple urban monitoring issue, that is, the damages traditionally occurring to road pavement. A selected sample of users was provided with how-to-use instructions for exploiting mobile devices to supply a geotagged picture of damage event and send it to the system.
User submitted questionnaires are stored and managed into a database server and their spatial component is then Web published using WMS standard. Finally, online access and consultation of field-collected information are allowed by three ad hoc-developed viewers. A major innovation in the field of PPGIS literature is represented by data visualization from mobile devices. In fact, besides a standard viewer for traditional computers, two more prototypes were built, supporting navigation touch commands and providing optimized data access for small-screen and large-screen devices, respectively. In contrast to a significant number of recent PPGIS Web applications built on proprietary APIs (e.g. Bugs et al. Citation2010; Brown, Montag, and Lyon Citation2012), all the viewers were entirely developed using FOSS.
People experiencing the system all agreed about its overall proper functioning, as no hardware nor software troubles were reported. Provided of course that users had a base knowledge of the Android operating system, they were all able to correctly manage field-data collection through the ODK Collect application, which worked quite satisfactorily on all the tested devices (both smartphones and tablets).
About a hundred road pavement damages spread over an area of around 1000 km2 were reported by the selected users. The number of reports per user ranged from a minimum of one or few to a maximum of about a dozen for the most active people. Especially those people expressed great satisfaction about the potential of the system, highlighting its efficiency with respect to the traditional ways to perform this kind of reports (i.e. by telephone, fax, email, and direct meetings with the local administration or the mass media), which are often time-consuming and unsuccessful.
The success of the experimentation led to a couple of considerations. First, it provided effective empirical support for potentially exploiting the developed architecture for real PPGIS applications to be carried out by governmental organizations (e.g. local municipalities). As the system was successfully tested by also technicians of local municipalities, contacts have been already established with them to formalize the official use of the application for reporting a range of possible disservices, that is, not only road pavement damages but also abandoned waste, nonoperation of road signs, damages to public facilities, and so on. Decision-making about interventions to solve such problems could thus be favored and fostered through the use of the developed system.
Second, as there is no delay between the sending of reports and their Web publication, the implemented architecture could be legitimately extended to more complex case studies characterized by the need of constant, updated field information (e.g. emergency management). Citizen contributions, available in real time and at no cost, can provide a notable means to exploit local knowledge for dealing with decision-making processes in a more democratic and effective way, as the same paradigm of PPGIS asserts (Sieber Citation2006).
Many systems similar to the one described, but based on proprietary software (e.g. Microsoft Windows Azure and Esri ArcGIS), have been recently adopted by many cities, like Los Angeles (http://lacity.org/myla311/index.htm) and New York (http://www1.nyc.gov/connect/applications.page) in the USA, Adelaide (http://www.adelaidecitycouncil.com/community/adelaide-report-it-smartphone-app) in Australia, Abu Dhabi (https://www.abudhabi.ae/egovPoolPortal_WAR/appmanager/ADeGP/Citizen?_nfpb = true&_pageLabel = P3200366981351072373544&lang = en) in United Arab Emirates, and Gravesham (http://www.gravesham.gov.uk/services/environment-and-planning/street-care-and-cleaning/gravesham-24-phone-app) in the UK. In contrast to them, the study strongly demonstrated the applicability of FOSS technologies for the development of participative applications which require field-data collection using mobile platforms, user administration, and data online interactive visualization (also on mobile devices). Thanks to its free availability and code openness, all the software used could be effectively customized to accomplish user requirements. Reusability might also represent a key factor for pushing the use of FOSS (of which it represents a primary element) for developing this kind of platforms, which will be massively used in the next years for eliciting public participation to the life of the cities.
Although a generally positive assessment of the system usage, users experiencing ODK Collect application for gathering data on the field pointed out some limitations. First, both technicians and common citizens noticed that GPS coordinates acquisition can sometimes require a long time (e.g. in an urban canyon situation), thus making data collection slower or even problematic. Second, both field-positioning precision (i.e. position uncertainty, expressed by the precision circle described in Section 4.3) and accuracy (i.e. the proximity of estimated position to the real position) were proved sometimes to be low. In other words, large position circles (with a radius up to some tens of meters) can be registered if observations derive from mobile device low-quality GPS receivers. In addition, the survey position (i.e. the device position, from which the picture is taken) is not usually coincident with the position of the object (e.g. the pavement damage) which is being photographed. These drawbacks might be overcome through an editing of the Android ODK Collect code, such that users can set the position of the point of interest (or refine the GPS-estimated one) by manually placing it on an interactive map. Doing so, the uploaded coordinates would be very likely near to the right ones. Moreover, this approach would also expand the potential range of users also to those equipped with no GPS-enabled devices, broadening in the end participation. However, field campaigns have already been scheduled in which positioning quality of different mobile devices will be compared to that of higher accuracy GPS receivers. A second drawback, noticed only by common citizens, was sometimes related to the difficulties in correctly classifying the reported road pavement damage. This weakness, which was widely expected due to citizen-absence of the required specific background, was overcome by providing users with the technical instructions about damage cataloguing, as stated in Section 4.2. However, in order to further facilitate citizens when compiling the questionnaire, it might be useful to provide simplified instructions (including also sample pictures) within the same questionnaire page of the mobile application. In this way, the survey process would be significantly speeded up and much less constrained by the use of the official technical instructions.
Future work should also extend data visualization to the third and the fourth dimension, which are intrinsically related to the definition of DE (Gore Citation1998). A work has been started, in order to synchronize the presented, traditional bidimensional viewer for computers with a more realistic 3D viewer based on the open source NASA World Wind Virtual Globe (http://goworldwind.org). Time dimension should also be included in the system in order to temporarily examine (e.g. through visualization filters) the chronology of user field-surveyed data.
Finally, a crucial factor for the overall success of the system is its advertisement. The most natural channel for advertising the civic engagement system and the related mobile application is represented by the official websites of the cities or municipalities where the system itself is adopted. Its use might be also incentivized by the local press and the social networks and/or presented in manifestos of grassroots movements and groups of citizens willing to improve the city they live in (an example is the Better Cities Movement in Kuala Lumpur, Malaysia: http://betterkl.tumblr.com). Another possibility is to organize mapping parties, like it happens in the case of the OpenStreetMap project. Parties are occasions not only for mapping but also at the same time for socializing and, if the municipal authorities and officials are present, for achieving a direct contact with them.
If applied, the PPGIS system should favor a significant increase of the citizen real-time reporting as well as an expansion of the responsiveness of local governments. According to Ed Fraga, the IT Director at Glendale, CA, in most big cities the labor cost is estimated between the 70% and the 80% of the annual budget, so money can be saved by making that labor more efficient (GovLoop Citation2012). Although an exact estimation of the benefits brought by the system is hard, it is indisputable that its full implementation would represent a unique opportunity for governments to exploit technology for saving both time and money and together improving the accountability of the citizens they govern.
Acknowledgments
This research has been partially funded by the INTERREG “I cammini della Regina – Percorsi transfrontalieri legati alla Via Regina (The paths of Regina – Crossborder paths departing from Via Regina)” 2007–2013 project.
References
- Aanensen, D. M., D. M. Huntley, E. J. Feil, F. al-Own, and B. G. Spratt. 2009. “EpiCollect: Linking Smartphones to Web Applications for Epidemiology, Ecology and Community Data Collection.” PLoS One 4 (9) [online]. Accessed January 7, 2014. http://www.plosone.org/article/info:doi/10.1371/journal.pone.0006968. doi:10.1371/journal.pone.0006968
- Android Developers. 2013. The Developer's Guide [online]. Accessed December 28. http://developer.android.com.
- Annoni, A., M. Craglia, M. Ehlers, Y. Georgiadou, A. Giacomelli, M. Konecny, N. Ostlaender, et al. 2011. “A European Perspective on Digital Earth.” International Journal of Digital Earth 4 (4): 271–284. doi:10.1080/17538947.2011.582888.
- Boroushaki, S., and J. Malczewski. 2010. “ParticipatoryGIS.com: A WebGIS-based Collaborative Multicriteria Decision Analysis.” Journal of the Urban and Regional Information Systems Association 22 (1): 23–32.
- Brown, G. 2012. “Public Participation GIS (PPGIS) for Regional and Environmental Planning: Reflections on a Decade of Empirical Research.” URISA Journal 25 (2): 7–18.
- Brown, G., and P. Reed. 2000. “Validation of a Forest Values Typology for Use in National Forest Planning.” Forest Science 46 (2): 240–247.
- Brown, G., J. M. Montag, and K. Lyon. 2012. “Public Participation GIS: A Method for Identifying Ecosystem Services.” Society & Natural Resources 25 (7): 633–651. doi:10.1080/08941920.2011.621511.
- Bugs, G., C. Granell, O. Fonts, J. Huerta, and M. Painho. 2010. “An Assessment of Public Participation GIS and Web 2.0 Technologies in Urban Planning Practice in Canela, Brazil.” Cities: The International Journal of Urban Policy and Planning 27 (3): 172–181. doi:10.1016/j.cities.2009.11.008.
- Burke, J., D. Estrin, M. Hansen, A. Parker, N. Ramanathan, S. Reddy, and M. B. Srivastava. 2006. “Participatory Sensing.” Workshop on World-Sensor-Web (WSW'06): Mobile Device Centric Sensor Networks and Applications, Boulder, CO, October 2006, 117–134.
- Craglia, M., M. F. Goodchild, A. Annoni, G. Camara, M. Gould, W. Kuhn, D. Mark, et al. 2008. “Next-generation Digital Earth: A Position Paper from the Vespucci Initiative for the Advancement of Geographic Information Science.” International Journal of Spatial Data Infrastructure Research 3: 146–167.
- Craglia, M., K. de Bie, D. Jackson, M. Pesaresi, G. Remetey-Fülöpp, C. Wang, A. Annoni, et al. 2012. “Digital Earth 2020: Towards the Vision for the Next Decade.” International Journal of Digital Earth 5 (1): 4–21. doi:10.1080/17538947.2011.638500.
- Dueker, K. J., and D. Kjerne. 1989. Multipurpose Cadastre: Terms and Definitions. Falls Church, VA: American Society for Photogrammetry and Remote Sensing and American Congress in Surveying and Mapping.
- Eisnor, D. 2006. What is Neogeography Anyway? [online]. Accessed January 15, 2014. http://platial.typepad.com/news/2006/05/what_is_neogeog.html.
- Elwood, S. 2006. “Critical Issues in Participatory GIS: Deconstructions, Reconstructions, and New Research Directions.” Transactions in GIS 10 (5): 693–708. doi:10.1111/j.1467-9671.2006.01023.x.
- Elwood, S. 2008. “Volunteered Geographic Information: Future Research Directions Motivated by Critical, Participatory, and Feminist GIS.” GeoJournal 72 (3–4): 173–183. doi:10.1007/s10708-008-9186-0.
- Goodchild, M. F. 2007a. “Citizens as Voluntary Sensors: Spatial Data Infrastructure in the World of Web 2.0.” International Journal of Spatial Data Infrastructure Research 2: 24–32.
- Goodchild, M. F. 2007b. “Citizens as Sensors: The World of Volunteered Geography.” GeoJournal 69 (4): 211–221. doi:10.1007/s10708-007-9111-y.
- Gore, A. 1998. The Digital Earth: Understanding Our Planet in the 21st Century. Accessed December 30, 2013. http://portal.opengeospatial.org/files/?artifact_id = 6210.
- GovLoop. 2012. The GovLoop Guide: The State of Communications. ISSUU [online]. Accessed December 30, 2013. http://issuu.com/govloop/docs/communications_guide_final_single/25.
- Graham, P. 2005. Web 2.0 [online]. Accessed January 12, 2014. http://www.paulgraham.com/web20.html.
- Haklay, M., A. Singleton, and C. Parker. 2008. “Web Mapping 2.0: The Neogeography of the GeoWeb.” Geography Compass 2 (6): 2011–2039. doi:10.1111/j.1749-8198.2008.00167.x.
- Haklay, M., and P. Weber. 2008. “OpenStreetMap: User-generated Street Maps.” IEEE Pervasive Computing 7 (4): 12–18. doi:10.1109/MPRV.2008.80.
- Hall, G. B., R. Chipeniuk, R. D. Feick, M. G. Leahy, and V. Deparday. 2010. “Community-based Production of Geographic Information Using Open Source Software and Web 2.0.” International Journal of Geographical Information Science 24 (5): 761–781. doi:10.1080/13658810903213288.
- Hartung, C., A. Lerer, Y. Anokwa, C. Tseng, W. Brunette, and G. Borriello, 2010. “Open Data Kit: Tools to Build Information Services for Developing Regions.” Proceedings of the International Conference on Information and Communication Technologies and Development – ICTD 2010, London, UK, November 2010, 1–11.
- Howe, J. 2006. “The Rise of Crowdsourcing.” Wired Magazine 14 (6): 176–183.
- Jankowski, P. 2009. “Towards Participatory Geographic Information Systems for Community-based Environmental Decision Making.” Journal of Environmental Management 90 (6): 1966–1971. doi:10.1016/j.jenvman.2007.08.028.
- Maguire, D. J. 2007. “GeoWeb 2.0 and Volunteered GI.” Workshop on Volunteered Geographic Information, University of California, Santa Barbara, CA, 104–106.
- Maisonneauve, N., M. Stevens, and B. Ochab. 2010. “Participatory Noise Pollution Monitoring Using Mobile Phones.” Information Polity 15 (1): 51–71.
- McKenna, J. 2011. “WMS Performance Shootout 2011.” FOSS4G 2011, Denver, CO [online]. Accessed January 18, 2014. http://www.slideshare.net/gatewaygeomatics.com/wms-performance-shootout-2011.
- Obermeyer, N. J. 1998. “The Evolution of Public Participation GIS.” Cartography and Geographic Information Systems 25 (2): 65–66. doi:10.1559/152304098782594599.
- Oliveira, M. P. G., E. B. Medeiros, and C. A. Davis, Jr. 1999. “Planning the Acoustic Urban Environment: A GIS-centered Approach.” Proceedings of the 7th International Symposium on Advances in Geographic Information Systems, Kansas City, MO, November 2–6, 128–133.
- Open Geospatial Consortium (OGC). 2007. Styled Layer Descriptor Profile of the Web Map Service Implementation Specification. Version 1.1.0 (Revision 4), OGC 05-078r4 [online]. Accessed November 20, 2013. http://portal.opengeospatial.org/files/?artifact_id = 22364.
- O'Reilly, T. 2005. “What is Web 2.0: Design Patterns and Business Models for the Next Generation of Software” [online]. Accessed November 20, 2013. http://oreilly.com/pub/a/web2/archive/what-is-web-20.html.
- Peng, Z. R., and M. H. Tsou. 2003. Internet GIS. Hoboken, NJ: John Wiley & Sons.
- Plewe, B. 2007. “Web Cartography in the United States.” Cartography and Geographic Information Science 34 (2): 133–136. doi:10.1559/152304007781002235.
- Putz, S. 1994. “Interactive Information Services Using World Wide Web Hypertext.” Proceedings of the First International Conference on World Wide Web, CERN, Geneva, Switzerland, May 25–27.
- Rambaldi, G., P. A. K. Kyem, M. McCall, and D. Weiner. 2006. “Participatory Spatial Information Management and Communication in Developing Countries.” Electronic Journal of Information Systems in Developing Countries (EJISDC) 25 (1): 1–9.
- Regione Lombardia – Direzione Generale Infrastrutture e Mobilità. 2005. “Catalogo dei dissesti delle pavimentazioni stradali [Catalogue of Road Pavement Damages].” ALLEGATO B, d.g.r. n. 1790/2006, BURL n. 8 S.S. Del 21.2.2006.
- Rinner, C., C. Keßler, and S. Andrulis. 2008. “The Use of Web 2.0 Concepts to Support Deliberation in Spatial Decision-making.” Computers, Environment and Urban Systems 32 (5): 386–395. doi:10.1016/j.compenvurbsys.2008.08.004.
- Scharl, A., and K. Tochtermann, eds. 2007. The Geospatial Web: How Geobrowsers, Social Software and the Web 2.0 Are Shaping the Network Society. London: Springer.
- Schroeder, P. 1996. “Criteria for the Design of a GIS/2.” Specialists’ Meeting for NCGIA Initiative 19: GIS and Society, Orono, ME, July 10–13.
- Sieber, R. 2006. “Public Participation Geographic Information Systems: A Literature Review and Framework.” Annals of the Association of American Geographers 96 (3): 491–507. doi:10.1111/j.1467-8306.2006.00702.x.
- Simão, A., P. J. Densham, and M. Haklay. 2009. “Web-based GIS for Collaborative Planning and Public Participation: An Application to the Strategic Planning of Wind Farm Sites.” Journal of Environmental Management 90 (6): 2027–2040. doi:10.1016/j.jenvman.2007.08.032.
- Steinmann, R., A. Krek, and T. Blaschke. 2004. “Analysis of Online Public Participatory GIS Applications with Respect to the Differences between the US and Europe.” Proceedings of Urban Data Management Symposium'04, Chioggia, Venice, Italy, October 27–29.
- Turner, A. 2006. Introduction to Neogeography. Sebastopol, CA: O'Reilly Media.
- Zucker, D. F. 2007. “What does AJAX Mean for You?” Interactions 14 (5): 10–12. doi:10.1145/1288515.1288523.