
Abstract
Based on remote sensing and Geographic Information System techniques, multi-temporal Landsat data were used to monitor land use/cover changes (LUCC) in the Nanchang area during 1989–2010. Quantitative and spatiotemporal indicators derived from the transition matrix for overall changes, intensity analysis for inter-category transitions, and spatiotemporal analysis of intra-category variations were constructed to analyze the spatiotemporal LUCC evolution. The study results show that urban and industrial land rapidly and continually expanded. The spatial extent of rural settlements shrunk while their distribution density increased. Cultivated land showed a tendency of spatially continuous loss and fragmented distribution, whereas the spatial pattern of forest tended to concentrate. The extents of ponds and reservoirs remained stable, but spatial changes were obvious. Rivers and bottomlands decreased significantly and tended toward fragmentation. The overall LUCC pattern showed that construction land rapidly sprawled while cultivated land decreased substantially, indicating an accelerating stage of urbanization and industrialization. Although rigid land requirements for urbanization had to be satisfied, land development and consolidation across forests and water body areas, as well as adjustment of agricultural structure, laid the foundation for a transition toward intensive land use in the Nanchang area.
1. Introduction
Since the origin of agriculture and civilization thousands of years ago, the natural process of land-cover change has been continually influenced by the land use of humans (Houghton Citation1994). It is now widely accepted that carbon emission from human activities is an important driving force in global warming, and global change has a deep impact on sustainable development of human society (Xu et al. Citation2013; Yang et al. Citation2013). With proliferation of the global population, land use/cover changes (LUCC) have become a key indicator for evaluating climate change and its impact at various spatiotemporal scales (Lambin Citation1997; Petit and Lambin Citation2002; Wu et al. Citation2013). In recent years, land changes characterized by urban expansion have resulted in serious consequences for sustainability of the regional environment and socioeconomic development (Yuan et al. Citation2005). The Nanchang area is at the center of the Poyang Lake Ecological Economic Region in Jiangxi Province, China. LUCC in this area has changed tremendously since the 1980s, owing to rapid socioeconomic development and accelerated urbanization (Zhou and Xiao Citation2009; Wei et al. Citation2010; Michishita, Jiang, and Xu Citation2012; Chan and Xu Citation2013). Monitoring and analyzing spatiotemporal LUCC patterns in the area can help effectively balance the positive and negative effects of regional development, protect the environment, and promote socioeconomic prosperity.
Remotely sensed data have been broadly applied in LUCC monitoring for years (Gong and Xu Citation2003). These data have characteristics of large areal coverage, tremendous amounts of information, short periods of operation, and suitability for comparative analysis (Mertens and Lambin Citation2000; Muñoz-Villers and López-Blanco Citation2008). Integrated use of these data and Geographic Information System (GIS) techniques represent powerful tools for monitoring and analyzing spatiotemporal patterns of land change (Zhang Citation2011; Michishita et al. Citation2012). Moreover, remote sensing and GIS techniques are the important components of Digital Earth techniques (Goodchild Citation2008), and LUCC monitoring is also one of the main applications of Digital Earth (Craglia et al. Citation2012). Earth observation satellites greatly promote remote sensing applications ranging from scientific research to practical and operational use (Guo et al. Citation2012; Yang et al. Citation2013).
In-depth studies have been made on LUCC information extraction using remotely sensed data and analyses of quantitative LUCC characteristics (Yang and Lo Citation2002; De Mûelenaere et al. Citation2012). Quantitative analysis approaches mainly include the transition matrix for entire study areas and intensity analysis of systematic transitions among categories (Aldwaik and Pontius Citation2012). However, the studies on spatiotemporal changes of LUCC categories are urgently needed (Wu et al. Citation2014). In this study, LUCC spatiotemporal patterns in the Nanchang area during 1989–2010 were quantitatively monitored and analyzed, with integrated use of multi-temporal Landsat satellite data and GIS techniques. In addition to the transition matrix for overall changes and intensity analysis for inter-category transitions, spatiotemporal analysis of those transitions was developed to help understand LUCC spatiotemporal evolution in the study area. This study presents a necessary and operational application of Digital Earth technologies for LUCC studies at a local level. It contributes to Digital Earth in which multi-temporal Digital Earth observation data were applied to monitor local land-cover and land-use changes of the wetland area, and the factors that drive the dynamic.
2. Materials and methods
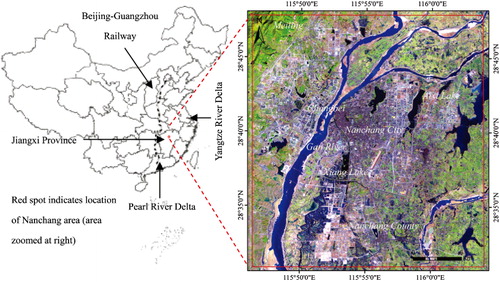
2.1. Study area
The city of Nanchang is adjacent to Poyang Lake, the largest freshwater lake in China. This area is flat in the southeast and hilly in the northwest. There are dense river systems, abundant water resources, and tradition of raising waterfowls (Chan and Xu Citation2013; Wang et al. Citation2013). Nanchang is the capital of Jiangxi Province and has access to the Yangtze River and Pearl River deltas. Since the 1980s, economic development and urbanization have been gradually accelerating. The study area is a rectangular region that includes the core and peripheral area of the city, comprising approximately 901.07 km2 (). Its western boundary is near the Nanchang Ring Expressway. Its northern and eastern boundaries are near the Fuzhou-Yinchuan Expressway, and its southern boundary is in southern Nanchang County. The area covers the main geomorphologic types in the Nanchang area, including low mountains and hills in Meiling, mounds and piedmont in Changbei, and plains east of the Gan River. It is representative of the LUCC spatiotemporal patterns in the Nanchang area over the last 20 years.
2.2. Data source
Multi-temporal Lansat-5 Thematic Mapper (TM) data were selected for study based on the availability of remotely sensed data and geographic characteristics of the study area. The data were acquired on 13 February and 15 July 1989 and 14 January 2010. The path/row numbers are 121/40. The images were displayed as 5, 4, and 3 red-green-blue (RGB) color composites. A US Geological Survey ortho-rectified Landsat Enhanced TM Plus (ETM + ) image from the year 2000 was used as reference data. This image has absolute horizontal position accuracy of photo-identifiable points not greater than 15-m root mean square (RMS). Twenty ground control points (GCPs) evenly distributed across the study area were used for georeferencing. The TM images were then registered to the ETM+ image through image-to-image registration. A nearest-neighbor resampling method and third-order polynomial transformation were used to create output images with a UTM/WGS84 coordinate system, using ERDAS 9.2 software. RMS errors of the transformation from the TM images to the ETM+ image were all less than one-fifth of a pixel, which is necessary to achieve a change detection error within 10%. Image sub-setting was performed to produce paired subscene images with exactly the same coverage and dimensions. In addition to the remotely sensed data, topographic maps of the study area at 1:50,000 scale, land use maps, and related literature were collected as reference materials for remote sensing data analysis. High spatial-resolution images from Google Earth were used as accuracy assessment data (Luedeling and Buerkert Citation2008; Wang et al. Citation2012). The Nanchang area images are based on QuickBird satellite images of sub-meter resolution and LUCC categories are clearly evident, allowing the use of Google Earth for validating those categories.
2.3. Study methods
2.3.1. Land use/cover categories
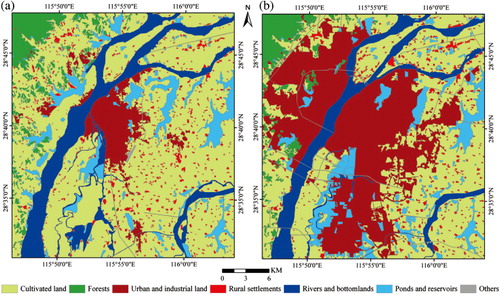
Based on LUCC composition in the study area and LUCC recognizability in the TM images, seven separate LUCC categories were identified. These are cultivated land, forests, urban and industrial land, rural settlements, rivers and bottomlands, ponds and reservoirs, and others (). According to the land use attributes, cultivated land and forests were attributed to agricultural land; urban and industrial land and rural settlements were attributed to construction land; and rivers, bottomlands, ponds, and reservoirs were attributed to water bodies. In terms of image characteristics, cultivated land and forests in summer images, as well as cultivated and construction land in spring images, are spectrally similar. Therefore, an approach combining spring and summer images was used for classification, because cultivated land could be separated from forests in spring images and from construction land in summer images (Yuan et al. Citation2005). Urban land was difficult to distinguish from industrial land, especially for patches interlaced with residential areas; hence, these two categories were merged for subsequent data analysis. Similarly, given the influence of seasonal and nonseasonal factors such as precipitation and temperature, the spatial extents of rivers and bottomlands transform into each other frequently. Consequently, these two categories were also merged.
Table 1. Land use/cover categories for which changes were detected during study period.
2.3.2. Land use/cover classification
Because of the complex land use composition in the Nanchang area, hierarchical classification and spatial reclassification procedures developed by Yang and Liu (Citation2005) were used to extract LUCC information. This method combines the automated classification and human interpretation which can use comprehensive spectral and spatial features of TM images, as well as thematic information from multiple sources during the classification process (Yang and Liu Citation2005; Wang et al. Citation2012). The work platforms were ERDAS 9.2 and ArcGIS 9.3 software. The minimum size of extracted patches was around 3 × 3 pixels. Based on LUCC classification results from 2010, TM-based land use/cover interpretation keys were established. The TM images acquired in February and July 1989 were used to distinguish cultivated land from forests and construction land, which were spectrally similar in those images; meanwhile, the LUCC information from 1989 was extracted. The integrated analysis of the topographic maps, land use maps, and literature was used to improve the classification results, which were ultimately shown as LUCC maps for 1989 and 2010 ().
2.3.3. Classification accuracy assessment
The reference data for the 2010 classification were high spatial-resolution images from Google Earth obtained on 15 August and 9 October 2010. A stratified random sampling strategy was implemented to collect the sample set, in which the strata were the categories in the LUCC maps (Stehman and Czaplewski Citation1998). The random sample points were generated within each category using the function of create random points provided by ArcGIS software. The final sample sizes of each category followed the rule of thumb that a minimum of 50 randomly selected samples should be used to form the testing set (Congalton Citation1991; Foody Citation2009), except for the others, in which the proportion was too small to accommodate many samples. The sample sets of each category were converted to Keyhole Markup Language files and added to Google Earth. Each sample was visually scanned and falsely classified samples were registered. The observed sample matrix () was converted to the estimated population matrix, which was used to evaluate classification accuracy. Disagreement of quantity and allocation was used to analyze components of classification disagreements (Pontius and Millones Citation2011).
Table 2. Observed sample matrix (confusion matrix), with classifications for 2010 (numbers in bold) and 1989 (numbers in italics).
Given the retrospective nature of the study, it was difficult to collect ground-truth data or aerial photos near the satellite scan times as accuracy assessment data for 1989. Therefore, the high-spatial resolution images from Google Earth obtained on 2 September and 6 June 2002 were used for accuracy validation. Moreover, we conducted stratified probability sampling based on maps of invariant zones (Ruelland et al. Citation2008; Huang et al. Citation2013). This can diminish the pragmatic problem of inaccessibility, without resorting to non-probability sampling (Stehman and Czaplewski Citation1998). Change detection over 1989–2010 was used to define the zones believed to have been invariant to obtain a common sample set for the two different times. Before this study, a preliminary test was implemented in a representative sub-area using Landsat TM image on 8 January 2002. The test result showed that the classification accuracy validated by the Google Earth images in 2002 (89%) was close to the accuracy validated by the Google Earth images in 2010 using stratified probability sampling based on the map of the invariant zones (92%). Therefore, this method was considered acceptable for this study. Subsequent accuracy assessment steps were identical to the 2010 classification.
2.3.4. LUCC analysis
The LUCC spatial distribution during 1989–2010 was calculated via the GIS spatial overlay function that was applied to vector layers of the classification results from 1989 to 2010. Quantitative indicators were constructed through GIS attribute table operations and intensity analysis (Aldwaik and Pontius Citation2012). This included the following: persistence, loss and gain proportions of the LUCC categories ( and ) and their geographic distributions (Figures –); transition intensity among categories ( and b); changes of number and average area of the patches of each category () for quantitatively analyzing the overall LUCC pattern; systematic transitions among the categories; and changes of spatial characteristics of the patches of each category.
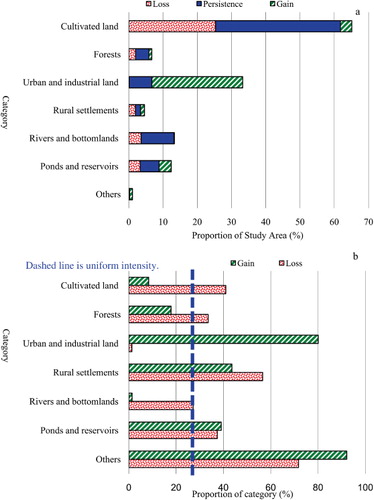
Table 3. Cross-tabulation matrix indicating systematic transition among categories.
Table 4. Changes in number and average area (km2) of patches of each category during 1989–2010 (percentages of the changes were calculated based on category data for 1989).
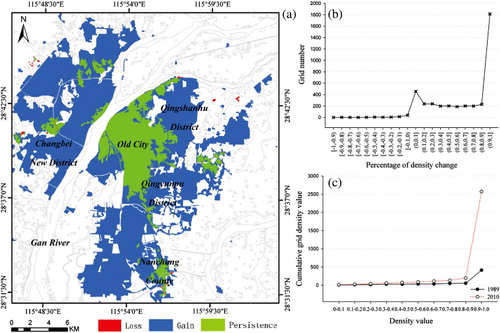
To filter out unnecessary tiny features and classification errors, the study area was divided into 9984 grids, each of 10 × 10 pixels. This was found to be an appropriate resolution for detecting detailed LUCC spatiotemporal patterns, while reducing the data to a manageable size for the entire study area. Area proportions of each category within each grid were calculated separately and were called grid densities. Within these, density values ranged from 0 to 1, and changes of density from −1 to 1. These two ranges were divided on average into 10 and 20 subranges, respectively. The spatiotemporal indicators were constructed based on the grids and density values, including the numbers of grids with changes of density in each subrange and cumulative density values of grids with density values in each subrange for 1989 and 2010 (Figures –). The intent was to reveal the dominant ranges of changes of each category, as expressed by the grid numbers and changes of density, along with the spatial patterns and changes of each category in 1989 and 2010, as expressed by the accumulated density values.
3. Results
3.1. Evaluation of classification accuracies
Overall accuracies of the confusion matrices comparing the two final classifications with the sample sets () were 92.71% and 96.76%, respectively, for the dates in 2010 and 1989. The values of standard Kappa were 0.91 and 0.96, respectively in 2010 and 1989. These results indicate relatively good agreement between the classifications and reference data. Disagreements of quantity and allocation respectively accounted for 1/7 and 6/7 of the overall disagreement in the 2010 classification and for 1/3 and 2/3 in the 1989 classification. Change between the 1989 and 2010 maps was 36.35% of the study area; therefore, the overall classification accuracies were suitable for illustrating LUCC spatiotemporal patterns.
Among the LUCC categories, forests, rural settlements, rivers and bottomlands, and ponds and reservoirs were particularly well classified with the producer's accuracies of over 93% and the user's accuracies of over or equal to 95% for the two periods concerned. On the other hand, small confusions remained with respect to cultivated land and urban and industrial land. These confusions underline the difficulty involved in accurately discriminating areas such as cultivated and construction land in spring images which are spectrally similar, although we have applied an approach combining spring and summer images used for classification. However, their producer's accuracies of over 84% and 93% and user's accuracies of over 85% and 91% for the two periods can support the subsequent study.
Further, the slightly coarser grid cells created for subsequent spatiotemporal analysis can diminish the effects of allocation disagreement (Pontius and Cheuk Citation2006). In this study, the random sample points of each category identified by the Google Earth images were further investigated with the grids they belong to. If the grid contains the correct category, this sample is regarded as the correctly classified sample. The study results () showed that the overall accuracies in the study area were improved to 96.27% and 98.65%, respectively, for the dates in 2010 and 1989. Meanwhile, the producer's accuracies of the LUCC categories except for the others also reached over 92% and 95% with their user's accuracies of over 91% and 96% for the two time periods.
3.2. Overall pattern of LUCC in the Nanchang area
As shown by the area changes of LUCC categories derived from Landsat data during 1989–2010 ( and ), agricultural land had the largest area contributing 67.65% in 1989 and 44.55% in 2010. Its average annual rate of change was −9.91 km2. Area change of construction land was the fastest, increasing from 10.36% in 1989 to 36.67% in 2010, with an average annual rate of change reaching 11.29 km2. The rate of change of water body area was relatively small (−1.38 km2/y), but its coverage declined to a minimum (from 21.99% in 1989 to 18.78% in 2010) because of the growth of construction land. Overall, the fundamental LUCC pattern was mainly a large reduction of agricultural land and substantial increase of construction land. At the category level, the horizontal bars in – which represent gains of the categories urban and industrial land, rural settlements, ponds and reservoirs, and others – extend to the right of the uniform intensity (vertical dashed) line. This indicates that these categories had greater gains than the landscape in general. The bars representing the losses of rural settlements, cultivated land, ponds and reservoirs, and others also extend to the right of the uniform intensity line, indicating that these categories had greater losses than the landscape in general.
3.3. Spatiotemporal analysis of LUCC in the Nanchang area
3.3.1. Urban and industrial land
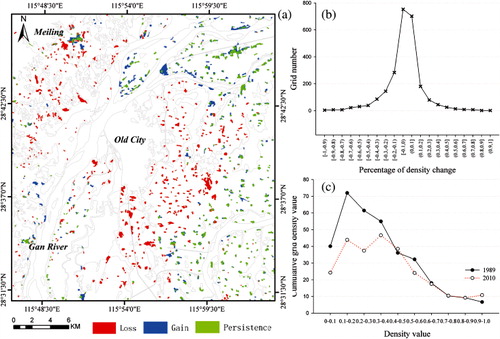
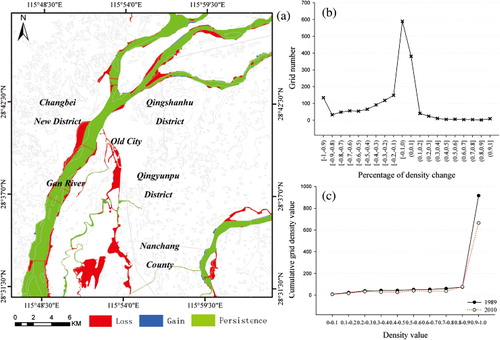
shows that the area proportion of urban and industrial land changed from small (6.70% in 1989) to large (33.16% in 2010), demonstrating rapid expansion. During 1989–2010, the persistence of this category was 98.72% and the land lost was distributed unevenly. The land gained was distributed broadly at the periphery of the old city and along the west bank of the Gan River (). In terms of transition intensity, these gains were focused on the categories of others (3.20), rural settlements (2.21), and cultivated land (1.52); little land was lost in other categories ( and ). There was a net growth trend; patches of urban and industrial land showed some increase in number (37.14%) and a remarkable increase in average area (260.12%; ). shows that 45% of the grids had changes of density within 0.9–1, indicating a spatially continuous increment. Statistical results of grid densities in 1989 and 2010 () show that the cumulative density value of grids with densities between 0.9 and 1 sharply increased (521.49%), and the value in the other range also increased greatly (average rate of change of the subranges was 170.85%). In conclusion, the spatiotemporal change of urban and industrial land evidenced a rapid and spatially continuous expansion.
3.3.2. Rural settlements
The area proportion of rural settlements was relatively small across the study area, constituting 3.41% in 1989 and 2.62% in 2010, revealing an areal reduction (). During 1989–2010, only 43.42% of this category persisted and there were considerable numbers of land lost and gained (). The land lost was mostly at the periphery of the old city and over large areas on the west bank of the Gan River. The land gained was in large rural areas (). The land lost tended to be primarily urban and industrial land (0.23), and that gained was largely cultivated land (0.08) (). Patches of rural settlements decreased by nearly half in number (−45.43%), but average area increased 50.00% (), evincing a tendency toward concentration. reveals that 84.35% of the grids had changes of density within −0.3 to 0.2. Statistical results of grid densities in 1989 and 2010 () indicate that the cumulative density value of the grids with density values from 0 to 0.3 declined strongly (average rate of change of the subranges was −39.32%). There were some increases and decreases of values in the 0.3–0.6 range and little change of values between 0.6 and 0.9. However, the cumulative density value in the 0.9–1 range increased substantially (62.17%), implying an expansion in size of the rural settlements. In summary, the spatial extent of those settlements decreased, but their distribution density increased.
3.3.3. Cultivated land
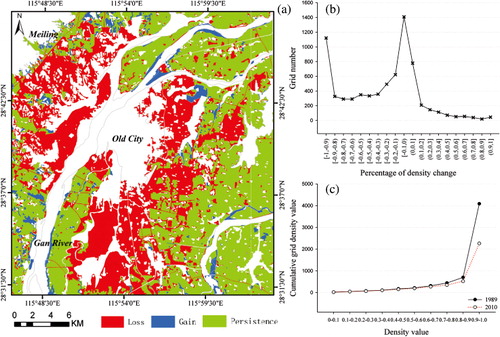
The area proportion of cultivated land was the largest in the study area, accounting for 61.79% in 1989 and 39.81% in 2010, indicating an area reduction (). During 1989–2010, persistence of this category was 59.03% and land lost was much more extensive than land gained (). The land lost was broadly distributed while that gained was unevenly distributed near rivers and mountains (). This loss was greatest in the other (3.11) and urban and industrial land (2.83) categories, whereas the greatest gains were in the forest (0.61), ponds and reservoirs (0.57), and rural settlement (0.44) categories (). This reveals the adjustment of agricultural structure in the study area. The patch number for cultivated land increased greatly (238.10%), but the average area clearly decreased (−80.92%; ), revealing a fragmented tendency. shows that 15.75% and 30.73% of the grids had changes of density in the −1 to −0.9 and −0.1 to 0.1 ranges, respectively, indicating minor and spatially scattered changes accompanying the spatially continuous changes. Statistical results of the grid densities in 1989 and 2010 () show that the cumulative density value of grids with density values between 0 and 0.1 increased slightly (17.33%). There were reductions of values in all other ranges, especially 0.9–1 (−44.71%). In conclusion, cultivated land had a trend toward spatially continuous loss and fragmented distribution.
3.3.4. Forests
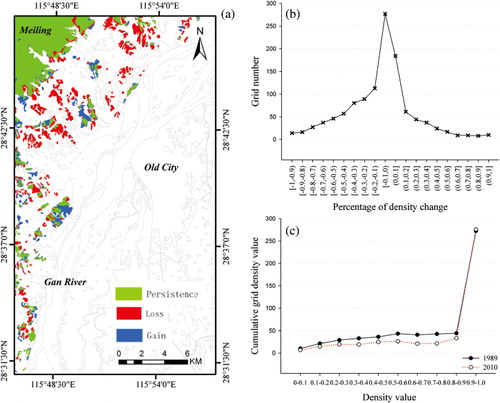
The area proportion of forests was relatively small in the study area, representing 5.85% in 1989 and 4.74% in 2010, or an areal loss (). During 1989–2010, persistence of this category was 66.47% and land lost exceeded that gained (); these areas were all in the hill and mound areas from the foot of Meiling Mountain to the west bank of the Gan River (). The greatest losses were within the others (0.29) and urban and industrial land (0.16) categories, and the greatest gains were in cultivated land (0.06; ). Patches for forest decreased in number by about half (−45.56%), but increased 51.72% in average area (), portraying spatial concentration. indicates that 64.11% of the grids had changes of density within the −0.4 to 0.1 range, implying relatively small spatial changes. Statistical results of grid densities in 1989 and 2010 () show that the cumulative density value of grids with density values between 0 and 0.9 decreased (average rate of change of the subranges was −36.95%), and there was a small growth of the value for the 0.9–1 range (1.24%). In summary, the spatial pattern of forests tended to concentrate.
3.3.5. Ponds and reservoirs
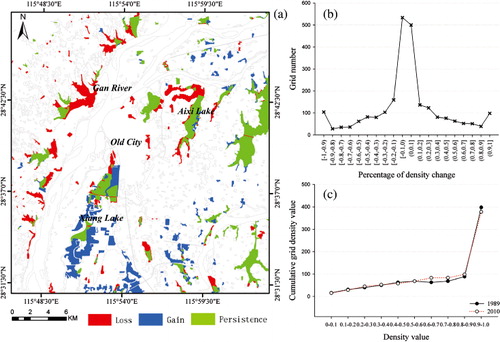
shows that the area proportion of ponds and reservoirs was relatively small in the study area, representing 8.83% in 1989 and 9.06% in 2010, a slight increase. During 1989–2010, the persistence of this category was 62.59% and land lost was a little less than that gained (). Land lost was mainly near the west bank of the Gan River and Aixi Lake in the eastern part of the city. Land gained was mainly in the Xiang Lake region in the southern part of the city (). Land loss was greatest in the categories of others (0.32) and urban and industrial land (0.31), and land gain was maximum for cultivated land (0.23; ). The numbers and average area of patches for ponds and reservoirs changed little (11.67% and −7.58%, respectively; ), depicting a stable pattern. As shown in , 63.68% of the grids had changes of density within −0.3 to 0.3 range. Some changes of density were also observed in the −1 to −0.9 and 0.9 to 1 ranges, implying a spatially continuous increase and decrease. Statistical results of grid densities in 1989 and 2010 () reveal that the cumulative density value of grids with density values in the 0.2–0.4 and 0.6–0.9 ranges increased (average rates of change of the subranges were 8.86% and 21.67%, respectively). There were slight reductions of values in the other ranges (average rate of change of the subranges was −5.40%). In conclusion, the extent of ponds and reservoirs remained stable, but spatial changes were obvious.
3.3.6. Rivers and bottomlands
The area proportion of rivers and bottomlands was relatively large in the study area, accounting for 13.16% in 1989 and 9.72% in 2010, a clear areal decline (). During 1989–2010, the persistence of this category was 72.84% and land lost greatly exceeded that gained (). These areas were all near the Gan and other rivers (). Land loss was greatest for others (0.57), urban and industrial land (0.26), and ponds and reservoirs (0.25). There was little land gained (), giving a net reduction. Patch number for rivers and bottomlands increased greatly (100%) but average area strongly decreased (−63.14%; ), indicating a fragmented tendency. shows that 7.35% and 67.89% of the grids had changes of density in the −1 to −0.9 and −0.3 to 0.1 ranges, respectively, revealing small but continuous spatial changes. Statistical results of grid densities in 1989 and 2010 () show that the cumulative density value of grids with density values in the 0.8–0.9 range increased (3.16%); values in the other ranges all declined (average rate of change of the subranges was −27.40%). Overall, the rivers and bottomlands shrank in areal extent and tended to be unevenly distributed.
4. Discussion
4.1. Importance of LUCC monitoring in Central China
Land is a natural resource that is essential for regional development. LUCC is constrained by the natural environment and is strongly influenced by human activities, for which economic development is one of the most important driving forces (Yang Citation2004). Several studies have demonstrated that the Kuznets Curve which reflects the relationship between income level and economic development, and the Environmental Kuznets Curve which reflects the relationship between environmental quality and economic development, also applies to the relationship between land changes and economic development in China (Qu and Wu Citation2004; Li and Wu Citation2008). Given rapid economic growth since the 1980s, the traditionally densely populated areas in East China, such as the Yangtze and Pearl River deltas, have been frequent objects of LUCC studies. However, central areas between the Beijing-Guangzhou Railway and coastal strip (), such as Jiangxi Province, have received little attention, mainly because of relatively slight economic development and limited LUCC change. Since 2008, changes in the global economic situation have critically and continuously affected the economic growth mode of eastern coastal areas, facilitating their technological progress and updating of industrial structure. It can be predicted from the Kuznets curve that internal pressure on land will tend to ease in the future. In contrast, Central China has been gradually entering an accelerating phase of urbanization and industrialization, and this region has seen a continuous industrial transfer from the eastern coastal areas. It is believed that land occupation pressure in this region will persist for a long period, and its impacts on LUCC and resulting environmental impacts will gradually arise. Therefore, sustained monitoring of LUCC in Central China is urgently needed. This would provide fundamental data and a technical framework for scientific land management and policy decisions, helping optimize the structure of the Kuznets curve.
4.2. Implications of spatiotemporal patterns of LUCC
4.2.1. Construction land
Since the late 1980s, Nanchang has experienced a gradual acceleration of urbanization. The construction of industrial parks and college districts, as well as the opening of the Beijing-Kowloon Railway, led to rapid population growth (Wei et al. Citation2010). Given a tight supply of land resources and urgent needs of urban development, the means for outward expansion were implemented surrounding the urban core. This led to a spatially continuous increment of urban and industrial land. Our change detection showed that peri-urban agricultural land suitable for urban expansion was occupied first, especially that in the Qingshanhu and Qingyunpu districts. Numerous projects under construction, such as in development zones, residential, and tourism areas, caused formerly scattered towns to consolidate into larger, planned towns that ultimately merged into the urban core. With expansion of that core area, most distinct rural settlements in urban fringe areas also gradually merged with the city, resulting in a large reduction of this category in terms of both number and spatial extent. Because of the resulting rural economic development, income levels of local farmers greatly improved and the extent of construction land in some villages expanded to meet housing improvement needs. Finally, during rebuilding of villages destroyed by floods and the agglomeration of small villages into towns to reduce arable land tension, some larger-scale settlements continuously emerged (Li and Zeng Citation2004). This increased the distribution density of this category.
4.2.2. Agricultural land
The change detection results reveal that large areas of cultivated land outside the old city and along the west bank of the Gan River were transformed into urban and industrial land, causing a spatially continuous loss of the former land type. Meanwhile, interpenetration of the urban core area, suburban areas, and exurbs caused a dispersed distribution of cultivated land. In general, land occupation pressure from economic development usually increases from small to large. With subsequent technological progress and industrial escalation, the economic growth mode develops in an intensive direction and land pressure gradually decreases (Yang Citation2004). Since the late 1980s, the economic development of Nanchang has been gradually entering a rapid stage; therefore, the decrease of cultivated land followed the laws of economic development. In contrast, though the urban development toward the west bank of the Gan River (especially construction of the Changbei New District) encroached on small forest areas, most expansion focused on less used land such as remnant forests and open woodlands. This indicates a deeper level of development of land use in Nanchang (Lin, Li, and Xu Citation2002).
4.2.3. Water bodies
The ponds and reservoirs were spread across the study area. Despite having stable numbers, there were obvious spatially continuous increments and losses. The change detection results indicate that many large lakes and ponds along the west bank of the Gan River were converted into urban and industrial land. Meanwhile, large areas of intensive fishponds were created in the Xiang Lake region to serve the Nanchang City food supply project. Unused land in the Nanchang area was rare and mainly consisted of bottomlands near rivers. A reduction in quantity and a fragmented distribution were observed for this category. Nevertheless, the transformation of bottomland into construction and arable land through land consolidation and development suggests a trend toward intensive land use in the area (Gao et al. Citation2009).
4.3. Future work on spatiotemporal analysis of LUCC
Although studies of spatiotemporal LUCC changes have been common for many years, it is difficult to quantitatively analyze spatiotemporal LUCC behavior in a simple and standard way. In the present study, patches (polygons) and grid cells were combined to illustrate intra-category variations of the spatiotemporal pattern. There are several important works for future development of this study. One of the most important is to investigate how grid size (resolution) influences spatiotemporal analysis. Scientists have realized that the results of geographic analyses may be substantially influenced by the scale at which they are conducted (Lambin et al. Citation1999). In LUCC studies, data may be available at a variety of spatial scales, and GIS applications frequently require the integration of such data (Turner Citation1990). It is therefore important to assess the relationship between scale and pattern in more detail.
5. Conclusion
We selected the Nanchang area in Jiangxi Province, one of the rapidly urbanizing regions in Central China, as our study area. LUCC spatiotemporal patterns during 1989–2010 were monitored and analyzed quantitatively, using remotely sensed data and GIS techniques. Quantitative and spatiotemporal indicators of the LUCC indicated a rapid and spatially continuous expansion of urban and industrial land; rural settlements shrank in spatial extent but increased in distribution density. There was a tendency toward spatially continuous loss and fragmented distribution for cultivated land, while the spatial pattern of forests tended to concentrate. The number of ponds and reservoirs remained stable but they had clear spatial changes. Rivers and bottomlands diminished substantially and tended to be distributed in a fragmented fashion. The overall pattern of LUCC in the Nanchang area over the past 20 years was one of rapid sprawl of construction land and substantial reduction of cultivated land, indicating an accelerating stage of urbanization and industrialization. Despite rigid land requirements for urbanization, land development and consolidation within forest and water body areas, as well as adjustment of the agricultural structure, laid the foundation for a transition toward intensive land use in the Nanchang area.
Acknowledgements
This work was supported by the Ministry of Science and Technology, China, National Research Program [2010CB530300, 2012AA12A407, 2012CB955501, 2013AA122003], and the National Natural Science Foundation of China [41271099]. The authors wish to thank the editor and the anonymous reviewers for their insightful comments and constructive suggestions.
References
- Aldwaik, S. Z., and R. G. Pontius. 2012. “Intensity Analysis to Unify Measurements of Size and Stationarity of Land Changes by Interval, Category, and Transition.” Landscape and Urban Planning 106 (1): 103–114. 10.1016/j.landurbplan.2012.02.010.
- Chan, K., and B. Xu. 2013. “Perspective on Remote Sensing Change Detection of Poyang Lake Wetland.” Annals of GIS 19 (4): 231–243. 10.1080/19475683.2013.843589.
- Congalton, R. G. 1991. “A Review of Assessing the Accuracy of Classifications of Remotely Sensed Data.” Remote Sensing of Environment 37 (1): 35–46. 10.1016/0034-4257(91)90048-B.
- Craglia, M., K. de Bie, D. Jackson, M. Pesaresi, G. Remetey-Fülöpp, C. Wang, A. Annoni, et al. 2012. “Digital Earth 2020: Towards a Vision for the Next Decade.” International Journal of Digital Earth 5 (1): 4–21. 10.1080/17538947.2011.638500.
- De Mûelenaere, S., A. Frankl, M. Haile, J. Poesen, J. Deckers, N. Munro, S. Veraverbeke, and J. Nyssen. 2012. “Historical Landscape Photographs for Calibration of Landsat LUCC in the Northern Ethiopian Highlands.” Land Degradation and Development. 10.1002/ldr.2142.
- Foody, G. M. 2009. “Sample Size Determination for Image Classification Accuracy Assessment and Comparison.” International Journal of Remote Sensing 30 (20): 5273–5291. 10.1080/01431160903130937.
- Gao, H. J., S. K. Wan, B. Xia, X. L. Yin, C. Pan. 2009. “A Study on Evaluation of Urban Land Intensified Utilization in Nanchang City.” Acta Agriculturae Universitatis Jiangxiensis 31 (4): 765–771.
- Gong, P., and B. Xu. 2003. “Remote Sensing of Forests Over Time: Change Types, Methods, and Opportunities.” In Remote Sensing of Forest Environments: Concepts and Case Studies, edited by M. A. Wulder and S. E. Franklin, 301–333. Norwell, MA: Kluwer Academic Publishers.
- Goodchild, M. F. 2008. “The Use Cases of Digital Earth.” International Journal of Digital Earth 1 (1): 31–42. 10.1080/17538940701782528.
- Guo, H., J. Liu, A. Li, and J. Zhang. 2012. “Earth Observation Satellite Data Receiving, Processing System and Data Sharing.” International Journal of Digital Earth 5 (3): 241–250. 10.1080/17538947.2012.669963.
- Houghton, R. A. 1994. “The Worldwide Extent of Land-Use Change.” Bioscience 44 (5): 305–313. 10.2307/1312380.
- Huang, J., Q. Li, R. G. Pontius, V. Klemas, and H. Hong. 2013. “Detecting the Dynamic Linkage of Landscape Characteristics and Water Quality in a Subtropical Watershed, Southeast China.” Environmental Management 51 (1): 32–44. 10.1007/s00267-011-9793-2.
- Lambin, E. F., 1997. “Modelling and Monitoring Land-Cover Change Processes in Tropical Regions.” Progress in Physical Geography 21 (3): 375–393. 10.1177/030913339702100303.
- Lambin, E. F., X. Baulies, N. Bockstael, G. Fischer, T. Krug, R. Leemans, E. F. Moran, et al. 1999. Land-Use and Land-Cover Change Implementation Strategy, IGBP Report 48, IHDP Report 10. Stockholm: International Geosphere-Biosphere Program, The Royal Swedish Academy of Sciences.
- Li, Y. L., and Q. Wu. 2008. “Validation of Kuznets Curve for Economic Growth and Cultivated Land Conversion: Evidence from Provincial Panel Data in China.” Resources Science 30 (5): 667–672.
- Li, S. J., and H. Zeng. 2004. “The Expanding Characteristics Study of Built-Up Land Use along the Urbanization Gradient in Quickly Urbanized Area: A Case Study of Nanchang Area.” Acta Ecologica Sinica 24 (1): 55–62.
- Lin, Z. Y., Z. M. Li, and J. S. Xu. 2002. “The Remote Sensing Research for the Land Resource of Central City Zone of 2010's Layout in Nanchang City.” Journal of Jiangxi Normal University 26 (1): 80–85.
- Luedeling, E., and A. Buerkert. 2008. “Typology of Oases in Northern Oman Based on Landsat and SRTM Imagery and Geological Survey Data.” Remote Sensing of Environment, 112 (3): 1181–1195. 10.1016/j.rse.2007.08.007.
- Mertens, B., and E. F. Lambin. 2000. “Land-Cover-Change Trajectories in Southern Cameroon.” Annals of the Association of American Geographers 90 (3): 467–494. 10.1111/0004-5608.00205.
- Michishita, R., Z. Jiang, P. Gong, and B. Xu. 2012. “Bi-Scale Analysis of Multitemporal Land Cover Fractions for Wetland Vegetation Mapping.” ISPRS Journal of Photogrammetry and Remote Sensing 72 (2012): 1–15. 10.1016/j.isprsjprs.2012.04.006.
- Michishita, R., Z. Jiang, and B. Xu. 2012. “Monitoring Two Decades of Urbanization in the Poyang Lake Area, China through Spectral Unmixing.” Remote Sensing of Environment 117 (1): 3–18. 10.1016/j.rse.2011.06.021.
- Muñoz-Villers, L. E., and J. López-Blanco. 2008. “Land Use/Cover Changes Using Landsat TM/ETM Images in a Tropical and Biodiverse Mountainous Area of Central-Eastern Mexico.” International Journal of Remote Sensing 29 (1): 71–93. 10.1080/01431160701280967.
- Petit, C. C., and E. F. Lambin. 2002. “Impact of Data Integration Technique on Historical Land-Use/Land-Cover Change: Comparing Historical Maps with Remote Sensing Data in the Belgian Ardennes.” Landscape Ecology 17 (2): 117–132. 10.1023/A:1016599627798.
- Pontius, R. G., and M. L. Cheuk. 2006. “A Generalized Cross-Tabulation Matrix to Compare Soft-Classified Maps at Multiple Resolutions.” International Journal of Geographical Information Science 20 (1): 1–30. 10.1080/13658810500391024.
- Pontius, R. G., and M. Millones. 2011. “Death to Kappa: Birth of Quantity Disagreement and Allocation Disagreement for Accuracy Assessment.” International Journal of Remote Sensing 32 (15): 4407–4429. 10.1080/01431161.2011.552923.
- Qu, F. T., and L. M. Wu. 2004. “Hypothesis and Validation on the Kuznets Curves of Economic Growth and Farmland Conversion.” Resources Science 26 (5): 61–67.
- Ruelland, D., A. Dezetter, C. Puech, and S. Ardoin-bardin. 2008. “Long-Term Monitoring of Land Cover Changes Based on Landsat Imagery To Improve Hydrological Modelling in West Africa.” International Journal of Remote Sensing 29 (12): 3533–3551. 10.1080/01431160701758699.
- Stehman, S. V., and R. L. Czaplewski. 1998. “Design and Analysis for Thematic Map Accuracy Assessment: Fundamental Principles.” Remote Sensing of Environment 64 (3): 331–344. 10.1016/S0034-4257(98)00010-8.
- Turner, M. G. 1990. “Spatial and Temporal Analysis of Landscape Patterns.” Landscape Ecology 4 (1): 21–30. 10.1007/BF02573948.
- Wang, Y., Z. Jiang, Z. Jin, H. Tan, and B. Xu. 2013. “Risk Factors of Infectious Diseases for Backyard Poultry Farms in the Poyang Lake Area, China.” PLoS One 8 (6): e67366. 10.1371/journal.pone.0067366.
- Wang, L., C. C. Li, Q. Ying, X. Cheng, X. L. Wang, X. Y. Li, L.Y. Hu, et al. 2012. “China's Urban Expansion from 1990 to 2010 Determined with Satellite Remote Sensing.” Chinese Science Bulletin 57 (22): 2802–2812. 10.1007/s11434-012-5235-7.
- Wei, L. N., L. Zhen, J. W. Zhang, and X. M. He. 2010. “Analysis on the LUCC Changes and Humanities Driving Force in Nanchang City.” Journal of Anhui Agriculture Science 38 (2): 1263–1268.
- Wu X., M. Lv, Z. Jin, R. Michishita, J. Chen, H. Tian, X. Tu, et al. 2014. “Normalized Difference Vegetation Index Dynamic and Spatiotemporal Distribution of Migratory Birds in the Poyang Lake Wetland, China.” Ecological Indicators. http://dx.doi.org/10.1016/j.ecolind.2014.01.041.
- Wu, X., H. Tian, S. Zhou, L. Chen, and B. Xu. 2013. “Impact of Global Change on Transmission of Human Infectious Diseases.” Science China Earth Sciences 56 (1): 1–15.
- Xu, G., Q. Ge, P. Gong, X. Fang, B. Cheng, B. He, Y. Luo, and B. Xu. 2013. “Societal Response to Challenges of Global Change and Human Sustainable Development.” Science China Earth Sciences 58 (25): 3161–3168. 10.1007/s11434-013-5947-3.
- Yang, G. S. 2004. “Land Use and Land Cover Change and Regional Economic Development: The Revelation of the Change in Cropland Area in the Yangtze River Delta during the Past 50 Years.” Acta Geographica Sinica 59 (59): 41–46.
- Yang, J., P. Gong, R. Fu, M. Zhang, J. Chen, S. Liang, B. Xu, J. Shi, and R. Dickinson. 2013. “The Role of Satellite Remote Sensing in Climate Change Studies.” Nature Climate Change 3: 875–883. 10.1038/nclimate1908.
- Yang, X., and Z. Liu. 2005. “Using Satellite Imagery and GIS for Land-Use and Land Cover Change Mapping in an Estuarine Watershed.” International Journal of Remote Sensing 26 (23): 5275–5296. 10.1080/01431160500219224.
- Yang, X., and C. P. Lo. 2002. “Using a Time Series of Satellite Imagery to Detect Land Use and Cover Changes in the Atlanta, Georgia Metropolitan Area.” International Journal of Remote Sensing 23 (9): 1775–1798. 10.1080/01431160110075802.
- Yuan, F., K. E. Sawaya, B. C. Loeffelholz, and M. E. Bauer. 2005. “Land Cover Classification and Change Analysis in the Twin Cities (Minnesota) Metropolitan Area with Landsat Remote Sensing.” Remote Sensing of Environment 98 (2–3): 317–328. 10.1016/j.rse.2005.08.006.
- Zhang, Y. 2011. “Coastal Environmental Monitoring using Remotely Sensed Data and GIS Techniques in the Modern Yellow River Delta, China.” Environmental Monitoring and Assessment 179 (1–4): 15–29. 10.1007/s10661-010-1716-9.
- Zhou, X. H., and Z. H. Xiao. 2009. “Spatiotemporal Analysis of Land Use Changes in Nanchang City.” Surveying and Mapping in Jiangxi 78 (2): 18–21.