
Abstract
Extracting meaningful information from the growing quantity of spatial data is a challenge. The issues are particularly evident with spatio-temporal data describing movement. Such data typically corresponds to movement of humans, animals and machines in the physical environment. This article considers a special form of movement data generated through human–computer interactions with online web maps. As a user interacts with a web map using a mouse as a pointing tool, invisible trajectories are generated. By examining the spatial features on the map where the mouse cursor visits, a user's interests and experience can be detected. To analyse this valuable information, we have developed a geovisual analysis tool which provides a rich insight into such user behaviour. The focus of this paper is on a clustering technique which we apply to mouse trajectories to group trajectories with similar behavioural properties. Our experiments reveal that it is possible to identify experienced and novice users of web mapping environments using an incremental clustering approach. The results can be used to provide personalised map interfaces to users and provide appropriate interventions for completing spatial tasks.
1. Introduction
Movement represents a fundamental process in the physical world. The ability to record the movement of animals, humans and human-operated machines has increased due to advances in digital tracking technologies. The large volumes of movement data which are captured and stored in this process have created opportunities to understand movement and the effects which external factors have on movement. This has created a demand for novel analysis techniques to interpret movement data. For example, geovisualisation facilitates analysts to reason about movement data using interactive interfaces. By analysing large datasets in this way, patterns and trends can be identified. These can be used to learn the intentions of moving objects, and how they are achieved. Similarly, the process can detect anomalies, outliers and unusual behaviour within datasets which can be important in many domains (Etienne, Devogele, and Bouju Citation2012).
Traditionally, movement data are recorded as a sequence of time-stamped locations known as trajectories. While generally, trajectories record movement in the physical world, movement in virtual environments can be recorded in the same manner. This article focuses on movement generated by users as they interact, using a mouse, with spatial data on a web map. There are many examples of such web maps including the following: Google Maps, Bing Maps and MapQuest. In all these cases, they provide an interactive map which can be used to complete common spatial tasks such as location-identification and route planning. The mouse movements recorded via these interfaces produce a set of time-stamped screen coordinates. This data have an inherent spatial component which is revealed by translating the screen coordinates to locations in the physical world. This makes geovisual analysis an appropriate tool for extracting meaning from such mouse movements.
The research in this article is presented in the context of designing a system to recommend interventions to assist users as they interact with web maps to complete a variety of tasks. To achieve this, the overall goal of the research is to produce new tools capable of identifying patterns and trends in web map usage at an individual and a group level. In particular, we are interested in identifying the strategies used by experienced and novice users to accomplish spatial tasks. The knowledge gained through this process can then be used to offer personalised web maps to end-users that reflect their interests and ability. These attributes are determined using a geovisual analysis environment for mouse trajectories which we have developed. The environment presents mouse trajectories from past user sessions and consists of a web map which contains features, such as density and speed maps to highlight important regions of the underlying map. The temporal component of trajectories is also considered by using a Space-Time Cube (STC) in conjunction with a digital globe (inspired from the Digital Earth Vision proposed by Al Gore (Craglia et al. Citation2012)) to show the progress of trajectories over time.
The tool also contains clustering techniques which group similar trajectories together. Similarity is determined based on the spatial proximity of trajectories and their behaviour in terms of speed and acceleration at different observation points. In this article, we build on our previous work described in McArdle et al. (Citation2012) and Tahir, McArdle, and Bertolotto (Citation2013) and describe a user trial in which we utilise the visual analytics tool alongside incremental clustering (Rinzivillo et al. Citation2008). Initially, spatial clustering is applied to trajectories to reveal users with similar interests and intentions. Behavioural clustering is then used on the resulting clusters to identify users who behaved similarly to complete the same goals. Using this approach we can successfully identify novice and experienced users solely by their mouse trajectories when completing a variety of tasks. The results highlight the different strategies used to complete tasks and can be used to tailor both the content and tools presented to users of web maps.
The remainder of this article is structured as follows. In the next section, related work in the area of HCI analysis is discussed. Techniques specifically for visualising and analysing movement datasets are also presented. Section 3 gives an overview of the system we have developed and describes the visual interface and the clustering components. Section 4 provides details of the user trial which we conducted to validate our approach with empirical data. The trial involved multiple users completing several tasks on a web map (Tahir, McArdle, and Bertolotto Citation2013). All users were assigned the same 10 tasks. The trajectories generated through this trial were analysed with the visual analytics components of our system to identify trends and patterns in the dataset. The final section presents some areas of future work and provides a summary of the research presented in this article.
2. Related work
By analysing mouse cursor movement in a user interface, it is possible to assess how an application is being used, ensure good design principles are followed and provide an understanding of the cognitive aspects of user interactions. This analysis can reveal user interests in terms of high or low interaction with different elements of an interface. Applications such as those developed by Arroyo, Selkar, and Wei (Citation2006) and Mueller and Lockerd (Citation2001) record mouse movements on a standard web page and present the results to analysts to identify patterns which can be used as an implicit indicator of interest in the content on web pages.
An important consideration when studying such HCI is understanding the human cognition process which is occurring. In this context, eye tracking has been studied in the HCI and usability domain for many years (Rodden et al. Citation2008; Cox and Silva Citation2006). Several studies have also considered eye movement in the spatial domain in order to assess how spatial interfaces are utilised (Çöltekin et al. Citation2009; Li, Çöltekin, and Kraak Citation2010; Çöltekin, Fabrikant, and Lacayo Citation2010). Analysing eye movements involves studying gaze and fixation position and duration, performing scan path comparisons and determining areas of interest. Often, this involves the visual analysis of eye movements (Li, Çöltekin, and Kraak Citation2010). Recently, a methodology for visual analytics of eye movement has been proposed by Andrienko et al. (Citation2012). The authors investigated the extraction of useful patterns from eye-tracking data in order to understand ‘viewing behaviours’. Although eye tracking is effective in ascertaining a user's interest, it is a complex endeavour. The data generated with eye tracking are very large and complex, and the equipment required to collect the data is generally expensive and can be impractical to use and calibrate. Given the cognitive link between eye and mouse movements (Cox and Silva Citation2006), mouse movements can act as a proxy to many eye movements and can thus provide a cost effective alternate solution to understand and assess user behaviour. The visual paradigms used for analysing eye movements can also be adapted for studying mouse movement. Our research focuses on providing such visual analytics tools tailored for mouse movement in the spatial domain.
In particular, our interest lies in using Geovisual Analysis to assess users' spatial intentions. As the user moves the mouse cursor on a web map, paths are generated. These paths form trajectories which consist of a sequence of time-stamped locations where the mouse was present. Like mouse clicks, trajectories reveal users interests and goals, however, they also provide insight on the strategy and the sequence of movement used to achieve the goals. As the locations visited by the mouse on the map correlate to physical locations in the real world, this data can highlight the interests of users. While, several applications for studying movement data have been developed, including specialised databases (Teixeira de Almeida, Hartmut Guting, and Behr Citation2006) and Geovisual Analytics environments (Andrienko, Andrienko, and Wrobel Citation2007), the focus of these applications has been to analyse physical movement.
The majority of Geovisual Analytics environments utilise an interactive 2D map to display information. While the temporal components of trajectories can be visualised using animation, it is not possible to analyse the entire spatio-temporal extent of trajectories using this technique. A series of separate maps, called small multiples, which represent discrete time moments highlight the progression of moving entities through space. Andrienko and Andrienko (Citation2008) applied this technique to analyse vehicle movements. This so-called situation-oriented point-of-view provides a snapshot of movement which is in contrast to a trajectory-oriented point-of-view in which each trajectory is visible throughout its life cycle. As indicated in Andrienko et al. (Citation2010), the temporal aspects of trajectories are important, and so this type of visualisation is valuable when studying movement patterns but requires visualisation techniques capable of representing time. The STC developed by Hägerstrand (Citation1970) and described by Kraak (Citation2003) is one such visualisation which incorporates the spatial and temporal components of movement into a single display. The visualisation uses the concept of a cube in which the geographic coordinates appear on the x- and y-axis while the time values appear on the perpendicular z-axis. Trajectories are, therefore, represented as 3D polylines within the cube.
Technological advances have led to the STC becoming popular within the geovisual analytics community for exploring movement data (Kapler and Wright Citation2005; Kraak Citation2008), however, drawbacks have been noted when the quantity of data is large as occlusion, cluttering and over plotting can occur (Andrienko, Andrienko, and Wrobel Citation2007). Dynamic visualisations which identify important events and changes in spatio-temporal data have been combined with the STC for visual analytics of large sets of trajectories (von Landesberger et al. Citation2012). This approach helps to focus analysis on specific regions or time periods. Generally, there is a move towards providing greater control to analysts which can be seen in the development of interactive interfaces such as the interactive taxi visualisation tool developed by Ferreira et al. (Citation2013) which includes tools for querying specific areas and time periods. Other interactive tools provide complete solutions to analysts (Andrienko et al. Citation2009). Other applications visualise data using principles stemming from the STC, such as space-time walls (Tominski and Schulz Citation2012) and 2D walls (Tory and Swindells Citation2003), while others use 2D plots of the temporal data. For example, Wang et al. (Citation2013) utilise plots of taxi speed profiles along road segments to visually identify periods when congestion occurs.
In many cases, the interactive interfaces are supported by machine learning and data mining techniques such as clustering. Data clustering is a long-established research domain and involves grouping data points which are similar according to some metric (Jain, Murty, and Flynn Citation1999; Xu and Wunsch Citation2005). The approach can be used to identify patterns and outliers in datasets. Groups of data points are formed so that points within clusters are more similar to each other than to points in another cluster. For movement data, trajectories form the data points, and their geometric attributes are generally compared. Using the Euclidean distance (Frentzos et al. Citation2007) as a similarity measure between individual pairs of points is common. Other approaches, such as Edit Distance on Real Sequences (Chen, Özsu, and Oria Citation2005), count the number of insert, remove and replace operations needed to transform one trajectory to another. In certain situations, subtrajectories are compared for common patterns, and the length of the longest common pattern is then used as a similarity score (Vlachos, Kollios, and Gunopulos Citation2002). The temporal aspects of trajectories have also been considered for similarity by preserving the temporal ordering in which trajectory points are compared (Atev, Masoud, and Papanikolopoulos Citation2006).
Specialist clustering algorithms have been developed for geographic trajectories. Common Destination which uses the ending locations of trajectories as an indication of trajectory similarity is a case in point, while Route Similarity, described in Andrienko, Andrienko, and Wrobel (Citation2007), computes not only the mean distance between corresponding points in trajectories but also introduces a penalty distance for unmatched points. Other attributes of trajectories such as speed (Dodge, Weibel, and Forootan Citation2009), stop locations (Ashbrook and Starner Citation2003) and areas with slow movement (Palma et al. Citation2008) have also been considered when comparing moving objects.
Similarity measures are combined with clustering algorithms in order to group similar trajectories. There are three principle classes of clustering algorithms. Hierarchical clustering recursively merges similar data points to form clusters until some stopping criterion is reached (Jain, Murty, and Flynn Citation1999). Conversely, partitioning algorithms, such as k-means clustering, split a dataset into a predefined number of clusters. Cluster centres are recursively altered until a best fit of cluster assignment is found and each data point is assigned to its closest cluster centre (Kanungo et al. Citation2000). Other approaches, transform the data space into a graph, based on a minimal spanning tree, where each node represents an object (Zahn Citation1971). The graph is then partitioned by bisecting weighted edges in the graph which fall below the similarity parameter. Density based clustering (Kriegel et al. Citation2011) examines the data space to identify areas with a high density of data points. This approach does not necessarily place every data point in a cluster. Those that remain as single data points are outliers. This automatic identification of outliers in the dataset is absent from the other two clustering techniques. Density-based clustering improves on partitioning by producing clusters of arbitrary shape. The work of Ester et al. (Citation1996) and Ankerst et al. (Citation1999) are examples of density-based clustering algorithms which have been applied to trajectories.
We have developed a custom Geovisual Analysis tool specifically for studying mouse trajectories generated by users interacting with web maps. The tool combines a 2D map-based environment for visualising trajectory attributes such as regions of high activity, stop locations and map scale. A STC is draped over an interactive digital globe to analyse the temporal properties of trajectories. To accommodate large volumes of mouse trajectories, clustering tools are included. Trajectories can be clustered based on their temporal or spatial similarity. Additionally, in this article, we report on the results of using incremental clustering by first applying spatial similarity using the classic OPTICS algorithm (Ankerst et al. Citation1999) and then applying a behavioural similarity measure based on the speed and acceleration attributes of trajectories (McArdle et al. Citation2013). This results in a grouping of trajectories which interact in the same geographical area and behave in a similar way.
3. System description
The tool we have developed consists of a powerful Geovisual Analysis environment tailored specifically for movement data. Our Geovisual Analysis tool highlights important features of movement datasets and helps the analyst to identify trends and patterns. The environment is web based, with all data being presented to the analyst via a web page. The principle visualisation components are a web map and a virtual globe. By using web maps for the analysis task, interactive features such as panning, zooming and querying are readily available. Attributes of the movement dataset can then be displayed on the web map. Additional features such as statistical plots and graphs provide summaries about the dataset being analysed. When handling large datasets of movement, clustering the spatial and temporal aspects of trajectories plays an important role in analysis. In this section, the visual analytics aspects of the tool are outlined while a full description and details of their implementation can be found in Tahir, McArdle, and Bertolotto (Citation2011).
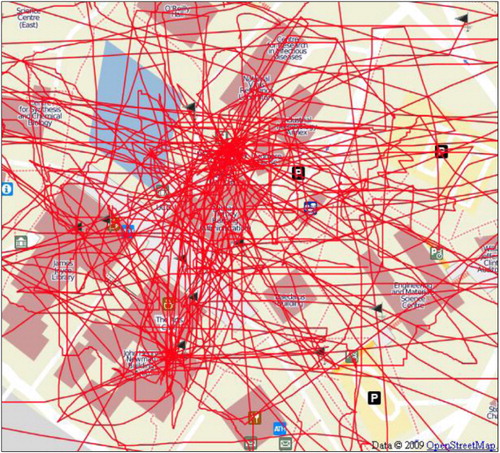
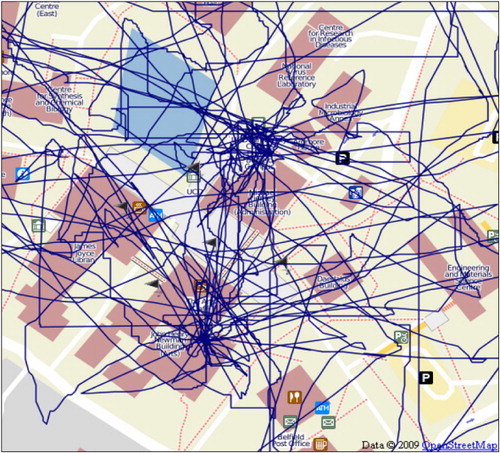
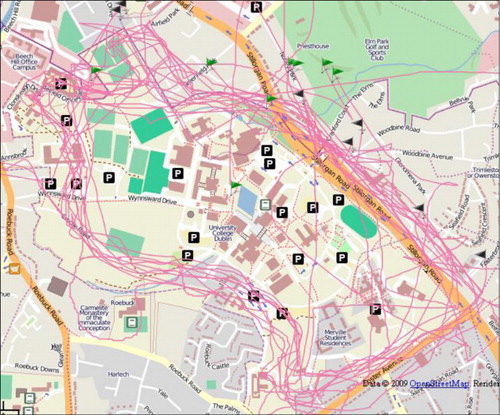
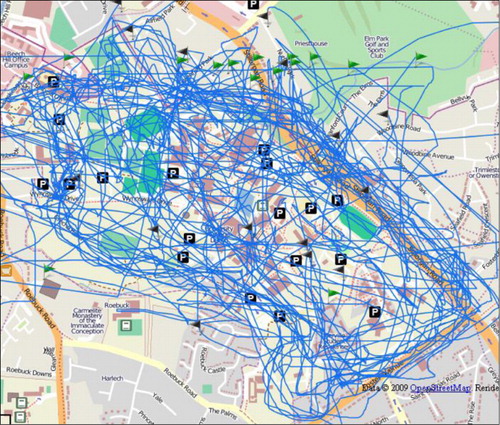
While the tool is capable of analysing any movement dataset, we are particularly interested in the special form of movement generated via HCI with web maps. The trajectories generated through this process show the route which the user moved their mouse in a particular spatial region to complete a particular task. To analyse this process, complete trajectories are rendered on top of a web map of the same spatial area. Such a visualisation highlights the spatial extent of the mouse movements and determines which areas of the map are important, and where the user interests may lie ().
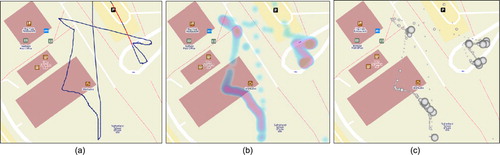
Analysis tools can be combined with this representation to demonstrate salient regions. Density maps are an example of this. A density map applies an overlay on a map based on the values for some measured parameter. In our application, density maps are generated based on movement activity. Areas with a lot of activity appear red while areas with little activity appear blue. This highlights important regions on a map corresponding to user interests. Importantly, as a web map is used to display this data to the analyst, scale can be used to optimise the amount of data displayed. For example, a small-scale map indicates important geographical regions, while a large-scale map shows important features within such regions. For each scale, the density map is recalibrated so that the most important areas, in terms of activity at that scale appear red ().
Additional features of trajectories can also be analysed. For example, in the HCI domain, the speed of mouse movements can dynamically detect a user's level of expertise or familiarity with a particular software tool (Hurst, Hudson, and Mankoff Citation2007). Cox and Silva (Citation2006) and Mac Aoidh, Bertolotto, and Wilson (Citation2007) have used this measure to classify different types of users. The system we have developed produces speed maps, which apply the same colour coding as density maps directly to the trajectories rendered on the map (). Red colours indicate high-speed mouse movement, while a blue colour indicates slow movements. The speed difference between two sequential observation points is, therefore, detectable. Visualising where trajectories pause or stop can be used to ascertain user interests. A stop is a conscious action taken by the user to study a particular feature on the map. In our system, these are highlighted by overlaying a circle at the location of a stop on the analysis map. An example of this can be seen in where the duration of the stop is proportional to the radius of the circle.
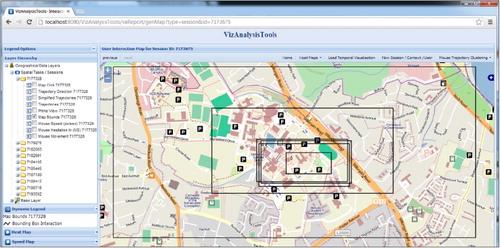
While there are certain parallels between mouse movements and physical movements, there are some key differences. For example, mouse movement is generally less constrained than movement in the real world. Furthermore, users who interact with web maps can adjust the scale with which they are viewing a map by zooming in and out of regions. Additionally, the map can be moved through spatially disjoint areas. These types of movement generate bounding boxes, which show the user's view of the map at any given moment. Mouse movements then occur within these bounding boxes. Visually, scale is particularly important as areas viewed on a large scale may signify places of interest. Our system displays this information to the analyst as boxes of varying size overlaid on the map. Smaller bounding boxes represent large-scale maps which were viewed in detail. shows the bounding boxes rendered in the complete interface.
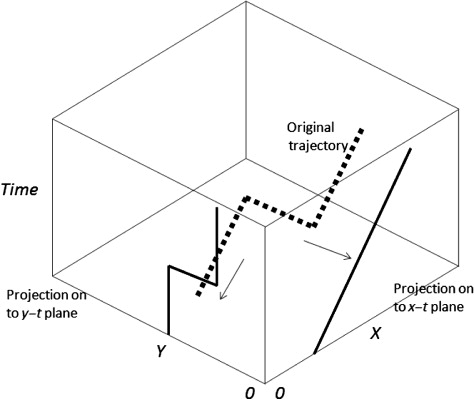
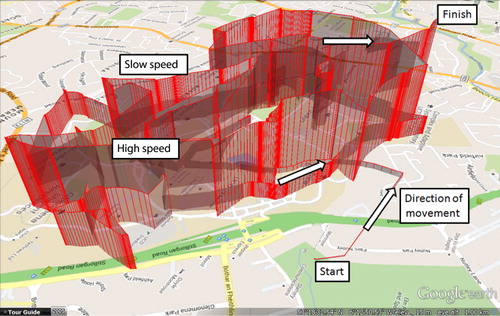
Certain types of temporal data, such as the speed and stopping locations, can be rendered and interpreted on a traditional (2D) web map; however, the sequence and temporal gap in which the mouse was observed at specific locations is not obvious. To provide analysts with this key temporal information, we have developed a geovisualisation module which utilises a 3D digital globe to simultaneously display the spatial and temporal information of a users' map interaction (). In a STC, the x and y coordinates represent spatial coordinates, while the perpendicular z-axis represents time as illustrated in . Trajectories can, therefore, be plotted as 3D lines floating in the cube. The digital globe, in this case Google Earth, provides a 3D view of the earth in which the z-axis represents altitude. We manipulate this axis to represent both altitude and time (McArdle et al. Citation2013). This enables the temporal path of a mouse trajectory to be analysed in a greater detail and the paths of several trajectories to be compared. Within the digital globe, the spatial component can be rendered using a map () or the satellite and terrain data in Google Earth (). When using the latter approach analysts must be aware that two values, time and altitude, are represented on the z-axis. This becomes evident when analysing trajectories in mountainous regions where the height of a trajectory is the sum of the altitude and temporal values of trajectories.
By combining the above features, an analyst can build a profile of how users interact with a given region of a web map, identify tasks, different styles of movement and understand the interests of those being observed. While the visual analysis features are useful for ascertaining the behaviour of single web map users over a short period of time, when multiple users' interactions are observed simultaneously, it can be difficult to determine the same information. This is due to an information overload problem which occurs when too much data are displayed on the map, causing cluttering and occlusion. To address this issue, we have developed spatial and temporal similarity measures which group trajectories with similar attributes into clusters.
4. Clustering
Our Geovisual Analysis tool uses several similarity measures and clustering techniques in order to identify important characteristics among collections of mouse trajectories. These techniques cluster trajectories based on their spatial or temporal similarity. We have found that route similarity provides an efficient clustering of mouse trajectories (Tahir, McArdle, and Bertolotto Citation2013).
Route similarity as described in (Andrienko, Andrienko, and Wrobel Citation2007) is a distance measure that computes the distance between two trajectories. Moreover, this distance function deals with incomplete trajectories and with more significant positioning errors. This function is also suited to unequal time intervals between records (the case of mouse trajectories). Route similarity is used in conjunction with a density-based clustering algorithm called ordering points to identify the clustering structure (OPTICS) (Ankerst et al. Citation1999). The algorithm searches for clusters which have a minimal point density within a maximum radius of each other. OPTICS results in an ordering of the dataset so that those points which are spatially close become neighbours. A parameter represents the density value for each point that needs to be accepted in order for two neighbouring points to be assigned to the same cluster.
This measure produces clusters of spatially similar trajectories completing similar tasks, however, the behaviour used to complete the task is not analysed. We consider speed and acceleration as a proxy for this behavior and use a technique based on the representation of trajectories in the STC for its analysis. Conceptually, each trajectory is projected onto the sides of the STC as depicted in . This approach is akin to the concepts of 2D walls used to visualise slices of 3D spaces or 3D objects (Kurzhals and Weiskopf Citation2013; Tory and Swindells Citation2003). For trajectories, this approach would result in a point-cloud representing points from trajectories passing through a particular slice of the STC. For a more complete view of trajectories, we project all trajectory points on to the sides of the STC (). This projection forms space-time plots of the data in two perpendicular directions. In our case, we translate the screen coordinates of trajectories to latitude and longitude coordinates. A similar technique is employed in the GeoTime software suite (www.geotime.com) for inspecting time series data; however, we utilise cluster analysis to produce a set of graphs describing the different behaviour patterns identified in the trajectories being studied.
Our approach assumes that each trajectory has the same number of points which are sampled evenly (this can be accomplished via subsampling of shorter trajectories and interpolation of missing locations). We can then compare the graphs produced for different trajectories in terms of the mathematical slope of the function and the rate of change of slope which are estimates of speed and acceleration. Trajectories can, therefore, be grouped by performing clustering on the dataset of numerically calculated first and second derivatives of each trajectory. Such slope-based similarity computations are used for clustering of time series (Altiparmak et al. Citation2006), however, there, only the first derivative of the time series (i.e. mathematical slope) is considered, while we add the second derivative (the rate of change of mathematical slope), for a more detailed approach and a more complex description of the movement being studied. The inclusion of acceleration is particularly important when studying mouse movement, as it gives an indication of user intentions and level of experience (Hurst, Hudson, and Mankoff Citation2007). A Euclidean metric is then used to determine how similar trajectories are to each other by examining the difference between corresponding speed and acceleration points. The measure is used in conjunction with the graph-based spectral clustering algorithm, described by Chen et al. (Citation2011), to produce groups of trajectories which behave similarly.
The principle of analysing movement using perpendicular directions is derived from the description of movement in classical mechanics (Halliday, Resnick, and Walker Citation1997). In this context, movement occurs in an inertial frame of reference, and the location of an object is described by a position vector which is analysed by decomposing it into perpendicular directions using projection on to relevant planes. For trajectory data, analysing latitude and longitude separately provides an opportunity to implicitly introduce the direction of trajectories and the features of the underlying space into the visual analysis and similarity metrics. For example, when examining physical movement, slow speed in one direction occurring concurrently with fast movement in an orthogonal direction may indicate an incline, a barrier or provide an insight into the underlying geography of the study area. This is initially revealed in the plots containing clusters of trajectories which are produced and may be further investigated at the map level. Visual analysis of such data is particularly appropriate when studying trajectories from the same spatial region and especially when movement is recorded in a city grid structure.
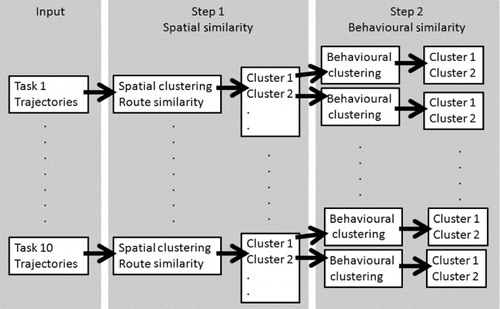
By combining route similarity and behavioural clustering, we have implemented a two-step incremental clustering approach which is described in Section 5. This two-step approach produces clusters of trajectories which have the same spatial signature and behave similarly in terms of speed and acceleration. From this data, we can identify novice and more experienced users.
5. User study
A user trial was conducted to validate our approach for trajectory analysis using empirical data. The results provide insights on user interaction with web maps. The knowledge gained through this analysis can be used to provide personalised maps and interfaces. The trial consisted of 27 participants each completing 10 spatial tasks on a web map in an unsupervised study. Spatial interactions with maps can be categorised into search and locate tasks, orientation tasks, deciphering tasks, symbol interpretation and more complex tasks involving scenarios (Lobben Citation2004). We designed the 10 tasks, listed below, to incorporate these broad categories.
Task 1: As a new student, you are required to open an account with the bank located at the campus. Find the bank on the campus map. On your way back, you would also like to get some food. Which is the nearest restaurant to the bank?
Task 2: You finish a lecture at the John Henry Newman Building (Arts) and need to catch a bus to the city centre (all bus stops connect to the city). Find the bus stop that suits you on campus? How many bus stops are there on campus?
Task 3: Name the building closest to the largest car park on campus.
Task 4: In order to attend a service at the church located on campus, you need to find the closest car park to the church. Find your way to this car park if you are driving from Stillorgan Road/N11 entrance.
Task 5: You need to attend a graduation ceremony at University College Dublin (UCD). You will be driving to UCD and will enter from the Stillorgan Road/N11 entrance. Locate the reception and O'Reilly Hall and find the shortest route between the two.
Task 6: You need to drive to the student bar in the evening. You are required to enter the UCD campus from Wynsward Drive entrance. Follow the path to find the closest car park to the student bar. How many pubs are shown on the map in this building?
Task 7: You finish a lecture in Computer Science and Informatics (CSI) building. You need to meet your friend in front of the Health Science Centre and go together to the James Joyce Library (close to the central largest lake-coloured blue) in order to return a book. Plan the route.
Task 8: In order to post a letter to your friend, plan the route to cycle from Charles Institute located at north-west of the central lake (coloured in blue) to Belfield Post Office. Find the nearest bicycle parking stand to the post office.
Task 9: You need to meet your friends at the sports centre building (coloured in green). How would you get to the Glenomena Student Residence (south-east of the central lake) from the Sports Centre?
Task 10: Count the number of roads crossing the UCD boundary (as outlined by the black line).
While completing the tasks, the locations of the mouse cursor on the screen were recorded at regular time intervals in milliseconds. After each task, these screen positions were translated into map coordinates and stored in a spatial database. Other map events such as clicking, zooming, panning and using the mouse wheel were stored separately to the mouse trajectories. Distinctions between clicking on the map and clicking on a user interface control were also made. Once all users had completed the tasks, the Geovisual Analytics tool was used to analyse the stored trajectories.
In this article, we are particularly interested in demonstrating the results of the clustering aspects of the tool we have developed. The spatial clustering approach described in Section 4 was applied to the trajectories produced at a task level to determine the spatial similarity in how individuals complete specific tasks. The resulting clusters of trajectories are then analysed using the behavioural clustering technique also presented in Section 4. This incremental clustering produces groups of individuals whose mouse trajectories reveal similar interaction patterns.
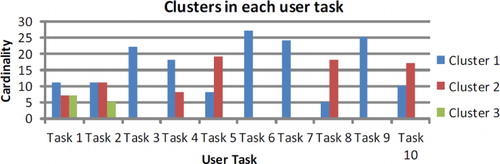
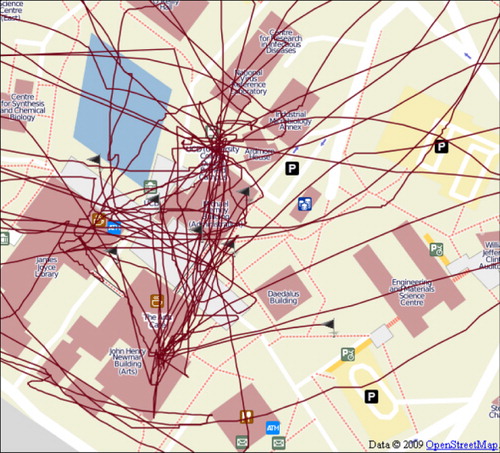
As depicted in , incremental clustering involves two steps. Step 1 applies route similarity metrics in conjunction with OPTICS clustering to the trajectories produced by users for each task. As seen in , this resulted in 1–3 groups of trajectories being produced for each task. These clusters were visually analysed using the geovisual environment. shows the trajectories for a single task (Task 1) grouped into three clusters and displayed on a map. The different spatial strategies used to complete the task are clearly visible. shows the trajectories produced by Task 10 clustered into two distinct groups showing the routes used to complete this task.
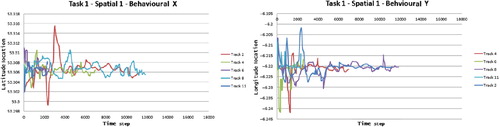
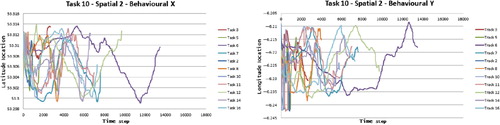
These clusters show the spatial strategy of users; however, they do not inform the analyst about the behavioural properties of the trajectories. In order to address this issue in Step 2 of the incremental clustering, behavioural clustering, which groups trajectories based on their speed and their acceleration, is used. Each grouping of trajectories produced in Step 1 is clustered using behavioural clustering. As highlighted in , the clustered trajectories are then overlaid on the digital globe as described in Section 3. Using this STC paradigm, it can be seen that the trajectories in this cluster have been grouped together as they exhibit similar temporal properties, with periods of high- and low-speed mouse movement occurring concurrently. The geovisual analysis interface is supplemented with plots of the mouse movements from each cluster. The plots show the location of the mouse at each time step which enables the analyst to identify the salient features which describe a cluster. In our case, two distinct classes of cluster are produced which highlight the disparity in the speed with which users moved their mouse. The plots enable us to determine that Cluster 1 corresponds to fast and sometimes erratic mouse movement, while Cluster 2 corresponds to slow and controlled mouse movement. and show the typical difference between the plots produced for Cluster 1 and Cluster 2 for the mouse trajectories.
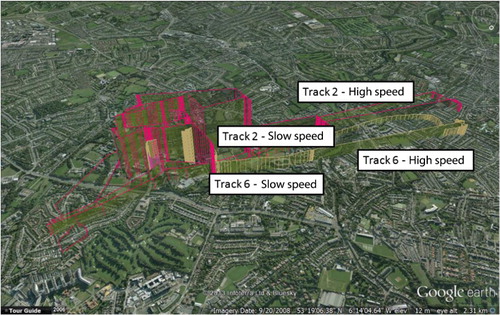
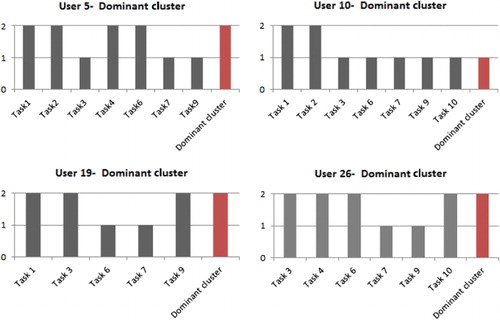
Incremental clustering was applied to the trajectories from all the 27 users completing the 10 spatial tasks. The resulting visualisations and plots were analysed which resulted in the trajectories being classified as fast or slow for each task and spatial strategy. The trajectories were then examined in the context of the user who generated them. shows how the dominant cluster was determined for four users. Some tasks are missing for specific users as there was an insufficient quantity of trajectories to produce meaningful clustering in certain categories. User 5 predominantly appears in Cluster 2, which is labelled as slow and steady trajectories. Conversely, User 10 predominantly appears in Cluster 1 which is labelled as a cluster of fast and erratic mouse movements.
Using the initial visual analysis, we hypothesise that the trajectories in Cluster 1 correspond to novice or inexperienced users, while the trajectories represented by Cluster 2 belong to individuals with prior experience of the web map usage or the study area. summarises how the 27 users were classified by showing the dominant cluster resulting from the incremental clustering for each user. In order to validate the results and test our hypothesis, each user's prior experience was examined. This is also shown in where familiarity with the mapping area and web map use is presented.
Table 1. Description of users and classification of their trajectories after incremental clustering.
Cluster 1 which contains mouse trajectories exhibiting fast and erratic movement is the predominant cluster for 18 users. Eight of these users were not familiar with the mapping area. Of the remaining 10 users, User 6 and User 25 indicated their familiarity with the area was average and fair, respectively. This could indicate why their movements were fast and erratic leading to their predominant Cluster being 1. Similarly, User 12 and User 21 indicated that they were familiar with the area and with mapping tools yet our hypothesis classifies them as novice users. Analysing their results at a task level, it was seen that on some occasions their level of experience enabled the task to be completed without proper map interaction. Therefore, the mouse movements recorded do not correspond to completing a specific task. As seen in , the remaining users in this cluster were infrequent map web users with limited experience. As a result, it is clear that the fast and erratic mouse trajectory movements correspond to users who are novices in either their familiarity with the study area or with web mapping tools.
Cluster 2 contains mouse trajectories which are generally performed slowly in a calculated fashion. According to , nine users were placed in Cluster 2 of which six were familiar with the mapping area, while the three remaining users (User 7, User 24 and User 26) interacted with web mapping tools frequently. As a result, this further justifies our hypothesis that slow and steady mouse movements correspond to experienced users, either with the mapping area or the mapping tools.
The user trial has demonstrated the use of an incremental clustering technique in conjunction with a geovisual environment to group trajectories based on similar spatial and behavioural properties. Our hypothesis that when applied to trajectories generated from mouse interactions in a web mapping situation, the technique is capable of detecting novice or experienced users was validated by comparing the clustering results to known information about the users. Some of our results might seem to be in contrast with other studies concerning interface design in which fast mouse movements corresponded to expert users (Hurst, Hudson, and Mankoff Citation2007). Those studies focused on tool use. Our analysis looked at specific interaction with the contents of a web map. In this context, our results show that often fast and erratic mouse movements on the web map are performed by novice users (for example, sometimes making fast movements to try and correct wrong moves). In the future we will use these results to provide support and interventions for novice users of web maps.
6. Conclusion
This article has presented a geovisual environment for analysing mouse trajectories generated via human computer interaction with web maps. The environment contains tools to identify salient features of trajectories such as stopping locations and areas of frequent mouse movement. Sophisticated clustering algorithms which group trajectories based on their spatial and temporal similarity support these visualisation tools. In this paper, we focus on applying these clustering algorithms incrementally to a set of mouse trajectories collected during a user trial which consisted of 10 spatial tasks. This approach produces groups of individuals who adopt similar spatial and temporal techniques to complete specific tasks. Initially, the trajectories from each task are clustered spatially, based on the paths generated by the mouse interaction. Then, the trajectories in each cluster, resulting from this step, are clustered again using behavioural clustering, which groups trajectories based on similarities in their speed and acceleration properties.
We hypothesised that the results of this incremental clustering highlight a clear distinction between users who are knowledgeable of the study area or expert users of web mapping environments and those with less experience. After performing incremental clustering, the users were labelled as novice or experienced based on the predominant cluster that their trajectories were assigned to. Clusters containing high-speed trajectories and wide spatial variation were labelled as novice users, while the clusters of trajectories with a slower speed and more controlled movements were labelled as expert users. These assignments were validated against the feedback provided by users regarding their prior knowledge and experience. In the majority of cases, the predominant cluster labels produced an accurate description of the user profile.
The ability to determine a user's level of experience is important and provides opportunities to improve efficiency through effective interventions. For example, the knowledge can be used by a web mapping system to enhance the level of spatial detail provided on a web map to users who are unfamiliar with a particular area. Additionally, the tools provided to inexperienced users can be enhanced. By examining the behaviour of expert users, the system can suggest appropriate strategies to novice users. The results of this incremental clustering need to be considered in union with the visualisation tools provided on the digital globe, presented in Section 3. The goals, intentions and interests of individual users can then be analysed alongside their behaviour and provide the ability to offer a truly personalised experience by tailoring spatial content to match interests and reduce spatial information overload. By incorporating machine learning algorithms, it will be possible to perform this processing and classification automatically and in real time. Producing such timely and relevant interventions to assist web map users is the next step of our research agenda.
The user trial included a relatively small set of trajectories. This affects the accuracy and interpretation of the clustering algorithms we chose. For example, the behavioural clustering phase of the incremental approach, the number of clusters had to be limited to two, labelled as expert or novice. In future, by increasing the number of trajectories in the study, it will be possible to improve the descriptive nature of the clusters and produce a scale of expertise which will increase the accuracy of personalisation which can be offered to users.
While the visual aspects of the tool permit analysts to identify the map scale at which a user interacted with particular geographic features, this information is not yet incorporated into the cluster analysis aspect of the tool. Given that scale is an important indicator of interest, there is scope to use this data as a parameter for both a spatial and behavioural clustering. Techniques for incorporating this additional user information will be included in a future user study in which a larger number of users will participate.
Acknowledgements
Research presented in this paper was funded by a Strategic Research Cluster grant [07/SRC/I1168] by Science Foundation Ireland under the National Development Plan. The authors gratefully acknowledge this support.
References
- Altiparmak, F., H. Ferhatosmanoglu, S. Erdal, and D. C. Trost. 2006. “Information Mining over Heterogeneous and High-Dimensional Time-Series Data in Clinical Trials Databases.” IEEE Transactions on Information Technology in Biomedicine 10 (2): 254–263. 10.1109/TITB.2005.859885.
- Andrienko, G., and N. Andrienko. 2008. “Spatio-Temporal Aggregation for Visual Analysis of Movements.” In IEEE Symposium on Visual Analytics Science and Technology, 2008. VAST'08. 51–58. Columbus, OH: IEEE.
- Andrienko, G., N. Andrienko, M. Burch, and D. Weiskopf. 2012. “Visual Analytics Methodology for Eye Movement Studies.” IEEE Transactions on Visualization and Computer Graphics 18 (12): 2889–2898. 10.1109/TVCG.2012.276.
- Andrienko, G., N. Andrienko, U. Demsar, D. Dransch, J. Dykes, S. I. Fabrikant, M. Jern, M.-J. Kraak, H. Schumann, and C. Tominski 2010. “Space, Time and Visual Analytics.” International Journal of Geographical Information Science 24 (10): 1577–1600. 10.1080/13658816.2010.508043.
- Andrienko, G., N. Andrienko, S. Rinzivillo, M. Nanni, D. Pedreschi, and F. Giannotti. 2009. “Interactive Visual Clustering of Large Collections of Trajectories.” In IEEE Symposium on Visual Analytics Science and Technology, 2009. VAST 2009. 3–10. Atlantic City, NJ: IEEE.
- Andrienko, G., N. Andrienko, and S. Wrobel. 2007. “Visual Analytics Tools for Analysis of Movement Data.” ACM SIGKDD Explorations Newsletter 9 (2): 38–46. 10.1145/1345448.1345455.
- Ankerst, M., M. M. Breunig, H.-P. Kriegel, and J. Sander. 1999. “Optics: Ordering Points to Identify the Clustering Structure.” ACM SIGMOD Record 28 (2): 49–60. 10.1145/304181.304187.
- Arroyo, E., T. Selker, and W. Wei. 2006. “Usability Tool for Analysis of Web Designs Using Mouse Tracks.” In CHI'06 Extended Abstracts on Human Factors in Computing Systems, 484–489. Montréal: ACM.
- Ashbrook, D., and T. Starner. 2003. “Using GPS to Learn Significant Locations and Predict Movement Across Multiple Users.” Personal and Ubiquitous Computing 7 (5): 275–286. 10.1007/s00779-003-0240-0.
- Atev, S., O. Masoud, and N. Papanikolopoulos. 2006. Learning traffic patterns at intersections by spectral clustering of motion trajectories. In 2006 IEEE/RSJ International Conference on Intelligent Robots and Systems, 4851–4856. Beijing: IEEE.
- Chen, L., M. T. Özsu, and V. Oria. 2005. “Robust and Fast Similarity Search for Moving Object Trajectories.” In Proceedings of the 2005 ACM SIGMOD International Conference on Management of Data, 491–502. Baltimore, MD: ACM.
- Chen, W.-Y., Y. Song, H. Bai, C.-J. Lin, and E. Y. Chang. 2011. “Parallel Spectral Clustering in Distributed Systems.” IEEE Transactions on Pattern Analysis and Machine Intelligence 33 (3): 568–586. 10.1109/TPAMI.2010.88.
- Çöltekin, A., S. Fabrikant, and M. Lacayo. 2010. “Exploring the Efficiency of Users' Visual Analytics Strategies Based on Sequence Analysis of Eye Movement Recordings.” International Journal of Geographical Information Science 24 (10): 1559–1575. 10.1080/13658816.2010.511718.
- Çöltekin, A., B. Heil, S. Garlandini, and S. Fabrikant. 2009. “Evaluating the Effectiveness of Interactive Map Interface Designs: A Case Study Integrating Usability Metrics with Eye-Movement Analysis.” Cartography and Geographic Information Science 36 (1): 5–17. 10.1559/152304009787340197.
- Cox, A., and M. Silva. 2006. “The Role of Mouse Movements in Interactive Search.” In Proceedings of the 28th Annual Meeting of the Cognitive Science Society, 1156–1161. Vancouver: Cognitive Science Society.
- Craglia, M., de Bie, K., Jackson, D., Pesaresi, M., Remetey-Fülöpp, G., Wang, C., Annoni, A., et al. 2012. “Digital Earth 2020: Towards the Vision for the Next Decade.” International Journal of Digital Earth 5 (1): 4–21. 10.1080/17538947.2011.638500.
- Dodge, S., R. Weibel, and E. Forootan. 2009. “Revealing the Physics of Movement: Comparing the Similarity of Movement Characteristics of Different Types of Moving Objects.” Computers, Environment and Urban Systems 33 (6): 419–434. 10.1016/j.compenvurbsys.2009.07.008.
- Ester, M., H.-P. Kriegel, J. Sander, and X. Xu. 1996. “A Density-Based Algorithm for Discovering Clusters in Large Spatial Databases with Noise.” In KDD, Vol. 96, 226–231. Portland, OR: AAAI Press.
- Etienne, L., T. Devogele, and A. Bouju. 2012. “Spatio-Temporal Trajectory Analysis of Mobile Objects Following the Same Itinerary.” Advances in Geo-Spatial Information Science 10: 47.
- Ferreira, N., J. Poco, H. T. Vo, J. Freire, and C. T. Silva. 2013. “Visual Exploration of Big Spatio-Temporal Urban Data: A Study of New York City Taxi Trips.” IEEE Transactions on Visualization and Computer Graphics 19 (12): 2149–2158. 10.1109/TVCG.2013.226.
- Frentzos, E., K. Gratsias, N. Pelekis, and Y. Theodoridis. 2007. “Algorithms for Nearest Neighbor Search on Moving Object Trajectories.” Geoinformatica 11 (2): 159–193. 10.1007/s10707-006-0007-7.
- Hägerstrand, T. 1970. “What about People in Regional Science?” Papers in Regional Science 24 (1): 7–24. 10.1111/j.1435-5597.1970.tb01464.x.
- Halliday, D., R. Resnick, and J. Walker. 1997. Fundamentals of Physics. New York, NY: Wiley.
- Hurst, A., S. E. Hudson, and J. Mankoff. 2007. “Dynamic Detection of Novice vs. Skilled Use without a Task Model.” In Proceedings of the SIGCHI Conference on Human Factors in Computing Systems, 271–280. San Jose, CA: ACM.
- Jain, A. K., M. N. Murty, and P. J. Flynn. 1999. “Data Clustering: A Review.” ACM Computing Surveys (CSUR) 31 (3): 264–323. 10.1145/331499.331504.
- Kanungo, T., D. M. Mount, N. S. Netanyahu, C. Piatko, R. Silverman, and A. Y. Wu. 2000. “The Analysis of a Simple k-means Clustering Algorithm.” In Proceedings of the Sixteenth Annual Symposium on Computational Geometry, 100–109. Clear Water Bay: ACM.
- Kapler, T., and W. Wright. 2005. “Geotime Information Visualization.” Information Visualization 4 (2): 136–146. 10.1057/palgrave.ivs.9500097.
- Kraak, M.-J. 2003. “The Space-Time Cube Revisited from a Geovisualization Perspective.” In Proceedings 21st International Cartographic Conference, 1988–1996. Durban: International Cartographic Association (ICA).
- Kraak, M.-J. 2008. “Geovisualization and Time–New Opportunities for the Space–Time Cube.” Geographic Visualization: Concepts, Tools and Applications, 293–306. Chichester: Wiley
- Kriegel, H.-P., P. Kröger, J. Sander, and A. Zimek. 2011. “Density-Based Clustering.” Wiley Interdisciplinary Reviews: Data Mining and Knowledge Discovery 1 (3): 231–240. 10.1002/widm.30.
- Kurzhals, K., and D. Weiskopf. 2013. “Space-Time Visual Analytics of Eye-Tracking Data for Dynamic Stimuli.” IEEE Transactions on Visualization and Computer Graphics 19 (12): 2129–2138. 10.1109/TVCG.2013.194.
- Li, X., A. Çöltekin, and M. Kraak. 2010. “Visual Exploration of Eye Movement Data Using the Space-Time-Cube.” Geographic Information Science 6292: 295–309.
- Lobben, A. K. 2004. “Tasks, Strategies, and Cognitive Processes Associated with Navigational Map Reading: A Review Perspective.” The Professional Geographer 56 (2): 270–281.
- Mac Aoidh, E., M. Bertolotto, and D. C. Wilson. 2007. “Implicit Profiling for Contextual Reasoning about Users' Spatial Preferences.” In Proceedings 2nd International Workshop on Case Based Reasoning and Context-Awareness, 13–16. Belfast: Citeseer.
- McArdle, G., U. Demšar, S. van der Spek, and S. McLoone. 2013. “Interpreting Pedestrian Behaviour by Visualising and Clustering Movement Data.” In Web and Wireless Geographical Information Systems, 64–81. Banff: Springer Berlin Heidelberg.
- McArdle, G., A. Tahir, and M. Bertolotto. 2012. “Spatio-Temporal Clustering of Movement Data: An Application to Trajectories Generated by Human-Computer Interaction.” ISPRS Annals of Photogrammetry, Remote Sensing and Spatial Information Sciences, 147–152. 10.5194/isprsannals-I-2-147-2012.
- Mueller, F., and A. Lockerd. 2001. “Cheese: Tracking Mouse Movement Activity on Websites, a Tool for User Modeling.” In CHI'01 Extended Abstracts on Human Factors in Computing Systems, 279–280. Seattle, WA: ACM.
- Palma, A. T., V. Bogorny, B. Kuijpers, and L. O. Alvares. 2008. “A Clustering-Based Approach for Discovering Interesting Places in Trajectories.” In Proceedings of the 2008 ACM Symposium on Applied Computing, 863–868. Fortaleza: ACM.
- Rinzivillo, S., D. Pedreschi, M. Nanni, F. Giannotti, N. Andrienko, and G. Andrienko. 2008. “Visually Driven Analysis of Movement Data by Progressive Clustering.” Information Visualization 7 (3–4): 225–239. 10.1057/palgrave.ivs.9500183.
- Rodden, K., X. Fu, A. Aula, and I. Spiro. 2008. “Eye-Mouse Coordination Patterns on Web Search Results Pages.” In CHI'08 Extended Abstracts on Human Factors in Computing Systems, 2997–3002. Florence: ACM.
- Tahir, A., G. McArdle, and M. Bertolotto. 2011. “A Web-Based Visualisation Tool for Analysing Mouse Movements to Support Map Personalisation.” In Database Systems for Advanced Applications, 132–143. Hong Kong: Springer.
- Tahir, A., G. McArdle, and M. Bertolotto. 2013. “Comparing Close Destination and Route-Based Similarity Metrics for the Analysis of Map User Trajectories.” In Web and Wireless Geographical Information Systems, 117–128. Banff, AB: Springer.
- Teixeira de Almeida, V., R. Hartmut Guting, and T. Behr. 2006. “Querying Moving Objects in Secondo.” In 7th International Conference on Mobile Data Management, 2006 (MDM 2006). 47–47. Nara: IEEE.
- Tominski, C., and H.-J. Schulz. 2012. “The Great Wall of Space-Time.” In Vision, Modeling, and Visualization, 199–206. Magdeburg: The Eurographics Association.
- Tory, M., and Swindells, C. 2003. “Comparing Exovis, Orientation Icon, and In-place 3d Visualization Techniques.” Graphics Interface 3, 57–64. Halifax: ACM Digital Library.
- Vlachos, M., Kollios, G., and Gunopulos, D. (2002). “Discovering Similar Multidimensional Trajectories.” In Proceedings of the 18th International Conference on Data Engineering, 2002. 673–684. San Jose, CA: IEEE.
- von Landesberger, T., S. Bremm, N. Andrienko, G. Andrienko, and M. Tekusova. 2012. “Visual Analytics Methods for Categoric Spatio-Temporal Data.” In 2012 IEEE Conference on Visual Analytics Science and Technology (VAST), 183–192. Seattle, WA.
- Wang, Z., M. Lu, X. Yuan, J. Zhang, and H. V. D. Wetering. 2013. “Visual Traffic Jam Analysis Based on Trajectory Data.” IEEE Transactions on Visualization and Computer Graphics 19 (12): 2159–2168. 10.1109/TVCG.2013.228.
- Xu, R., and D. Wunsch. 2005. “Survey of Clustering Algorithms.” IEEE Transactions on Neural Networks 16 (3): 645–678. 10.1109/TNN.2005.845141.
- Zahn, C. T. 1971. “Graph-Theoretical Methods for Detecting and Describing Gestalt Clusters.” IEEE Transactions on Computers 100 (1): 68–86. 10.1109/T-C.1971.223083.