
Abstract
Three-dimensional (3D) developments of land, such as complex high-rises, put enormous pressure on current land administration systems that have ad hoc approaches to 3D property management. These approaches are unable to support effective 3D storage, analysis and visualisation of property information. Effective visualisation is one of the essential components in realisation of a truly 3D cadastre. Currently, several 3D visualisation applications and cadastral prototypes have been developed around the world. However, they do not effectively represent ownership information in 3D because they have not been developed based on 3D cadastral visualisation requirements. After candidate 3D visualisation solutions were compared with user-derived visualisation criteria, a web-based 3D visualisation prototype was designed and developed. The functionality, usability and efficiency of the prototype were evaluated by potential users involved in the registration and management of property. While there was a high level of enthusiasm for the features of the prototype, the results also suggest further directions for development of 3D cadastral visualisation.
1. Introduction
Population growth and lack of available land particularly in the dense urban areas have caused rapid developments both above and below the ground. Overlapped and interlocked land and property interests (3D property) are the results of this trend. A 3D property (legal object) is a real property that is legally delimited both vertically and horizontally (Paulsson and Paasch Citation2011). Management and registration of 3D properties are among the most important challenges to current land administration systems, which are equipped with cadastres that are used primarily to maintain 2D spatial data (van Oosterom Citation2013; Aien et al. Citation2013a).
Three-dimensional (3D) cadastres would assist management and registration of 3D properties. A 3D cadastre should be capable of storing, manipulating, querying, analysing, updating and visualising 3D properties. Hence, development of a successful 3D cadastre requires consideration of various legal, institutional and technical aspects (Aien et al. Citation2011).
From the technical perspective, different topics such as 3D data acquisition, 3D database management systems and 3D data modelling are considered in the development of a 3D cadastral application. However, 3D visualisation also plays a significant role in development of a successful 3D cadastral application (Shojaei et al. Citation2013). A 3D cadastral visualisation application facilitates communication and exploration of 3D properties using visualisation techniques in a 3D space. The visualisation component is the point at which most end users will encounter a 3D cadastre. While it is possible to imagine a 3D cadastre without a visualisation component, this would probably be limited to a few highly specialised users. If the cadastre is to realise its potential, it needs a visualisation component that is accessible to many disparate users. In addition, due to progress in technology, web-based visualisation applications are popular among end users as they are easily accessible.
Several web-based visualisation prototypes/applications have been developed for representing landownership boundaries in 3D (Dimovski et al. Citation2011; Aditya et al. Citation2011; Guo et al. Citation2011; Vandysheva et al. Citation2012; Elizarova et al. Citation2012; Shojaei et al. Citation2012; Ying et al. Citation2012; Lemmen et al. Citation2010; Stoter Citation2004; Coors Citation2003; Stoter and Salzmann Citation2003). Various solutions have been utilised in these prototypes/applications. However, each of them has some significant limitations.
1.1. Problem description
Since the concept of 3D cadastre emerged, numerous prototype applications have been developed (Stoter and Zlatanova Citation2003; Jarroush and Even-Tzur Citation2004; Hassan and Abdul Rahman Citation2010; Frédéricque et al. Citation2011). However, as yet there is no 3D cadastral visualisation application implemented anywhere in the world that can support all the 3D cadastral visualisation requirements. Thus, research on 3D cadastral visualisation needs more investigation (Pouliot Citation2011; van Oosterom Citation2012, Citation2013). For example, applications built using Google Earth do not represent underground objects. Also, a cross-section view, which facilitates understanding of the ownership boundaries, is not available in many 3D visualisation prototypes.
1.2. Aim, scope and delimitation
This paper describes the design and development of a 3D cadastral visualisation prototype based on all the requirements of 3D cadastres that have been identified previously (Shojaei et al. Citation2013). We focused on 3D cadastre implementation, as a significant gap is evident in 3D visualisation of cadastre. According to the literature, despite the activities in 3D cadastral prototype developments, there are many steps of validation that are required before these may be considered as real 3D cadastral visualisation applications (Pouliot Citation2011). Other authors recognised the need for further research in this area (Pouliot Citation2011; van Oosterom Citation2012, Citation2013).
Streaming and visualising 3D data maintained in a DBMS are important subjects in 3D cadastre application developments; however, in this paper, we investigated how to visualise cadastral 3D data associated with individual buildings. This challenge is more related to user-interface development. Therefore, data sources can be in any format or streamed from a DBMS. Findings on visualising individual buildings can be utilised for future application developments by considering other aspects such as city scale, data formats, data exchange formats and streaming from a database.
We begin with a review of current 3D visualisation solutions and cadastral prototypes. However, as web-based solutions have been identified as an important visualisation requirement among end users such as the public, land surveyors, developers, architects and registrars (Shojaei et al. Citation2013), only web-based 3D visualisation applications, and not desktop solutions, are reviewed in this paper. In addition, this paper focuses only on 3D visualisation and we do not look at data management or data delivery.
1.3. Methodology
The development of our 3D cadastral visualisation prototype had four stages:
Review of the requirements of 3D cadastral visualisation applications as identified and validated in Shojaei et al. (Citation2013) (Section 2);
Review, against requirements, of 3D web-based visualisation solutions and choice of a preferred option (Section 3);
Design and development of a prototype (Section 4); and
Evaluation of the developed prototype by different end users such as land registry, local councils and surveyors (Section 5).
2. Review of 3D cadastral visualisation requirements
A comprehensive set of requirements for 3D cadastral visualisation was identified by Shojaei et al. (Citation2013). These requirements were grouped into three main categories: cadastral requirements, visualisation requirements and non-functional requirements ().
Table 1. The list of 3D cadastral visualisation requirements.
Cadastral requirements are essential elements in developing efficient and effective cadastral applications to represent 3D properties. Visualisation requirements are a set of features that are widely used in general 3D visualisation applications to facilitate communication with end users. Non-functional requirements provide support for technical diversity, system interoperability and integration and usability.
Various 3D web-based visualisation solutions were evaluated against these requirements as described in the next section.
3. Review of common 3D web-based visualisation solutions
In this section various 3D web-based visualisation solutions are reviewed and compared in order to choose a suitable option for prototype development.
3.1. Candidate solutions
We selected for review several web-based 3D visualisation solutions that have been developed for various applications. The selection was based on availability to the authors, cost, user-friendliness and development environment. They were then analysed for their capability for visualising 3D cadastral data.
3.1.1. WebGL technology
WebGL, a new technology, is a royalty-free web standard based on OpenGL (www.khronos.org/webgl) and provides users with 3D models using canvas elements, container for graphics, in HTML 5. WebGL brings plug-in-free 3D to the Web and major browsers. WebGL is discussed further in Section 3.2.
3.1.2. Google Earth
Google Earth is a popular 3D visualisation application. The Google Earth Plug-in and its JavaScript API enables embedding Google Earth in web pages. Also, the API is able to load 3D models in KML/KMZ formats, which allows sophisticated 3D applications. For example, Aditya et al. (Citation2011) chose Google Earth API as a visualisation interface for representing 3D cadastral information. Also, Shojaei et al. (Citation2012) used Google Earth API for representing LandXML/ePlan files. Google Earth is able to visualise 3D city models with high-resolution satellite/aerial images. However, Google Earth fails to represent underground objects, such as tunnels or easement rights, which are very important in cadastres.
3.1.3. NASA World Wind
NASA World Wind (worldwind.arc.nasa.gov/java) is a geographic information application and fully 3D interactive globe developed by NASA Ames Research Center. It provides satellite imagery and a terrain model for the Earth. Java developers are able to integrate this into their web pages or use it as a stand-alone application for various purposes. This visualisation application is standard-based, open-source technology and works on cross-platforms. For instance, Dimovski et al. (Citation2011) have utilised NASA World Wind to implement an operational web-based 3D cadastral visualisation application based on the needs of the Agency for Real Estate Cadastre of the Republic of Macedonia. This application appears simple to operate and meets a number of important requirements, but fails our test because of the inability of World Wind to show physical or legal entities that are under the ground surface.
3.1.4. BS Contact
BS Contact (www.bitmanagement.com) is a web-based viewer, which provides full interactivity for 3D visualisation on the Web. It can be easily integrated with other applications. BS Contact is a cross-platform application that is able to work on Windows, Linux, Mac and mobile platforms. It is able to visualise VRML (Virtual Reality Modelling Language), X3D (Extensible 3D), Collada and KMZ formats. This application was used widely for various purposes. For example, Vandysheva et al. (Citation2012) have developed a web-based 3D visualisation prototype in the Russian Federation utilising BS Contact plug-in to represent 3D volume objects and associated administrative data.
3.1.5. TerraExplorer
TerraExplorer (www.skylineglobe.com) is a visualisation application for exploring, editing, analysing and publishing photo-realistic 3D environments. One of the TerraExplorer products is Skyline Globe Viewer, which provides advanced API capabilities for web-based 3D visualisation applications. In addition to the viewer, there are TerraExplorer Plus and Pro, which provides users with capabilities to edit features, add layers and publish data to be visualised in the Skyline Globe Viewer. Ying et al. (Citation2012) have developed a web-based 3D visualisation prototype using TerraExplorer for representing landownership rights and 3D buildings. TerraExplorer meets a number of important requirements such as underground visualisation, supporting various formats and various 3D functions; however, it does not provide users with cross-sectional views that significantly assist users in understanding ownership boundaries.
3.1.6. XNavigator
XNavigator (xnavigator.sourceforge.net/doku.php) is an interactive 3D visualisation application for exploring 3D environments and an online viewer for OpenStreetMap Globe (osm-3d.org). The software is built on Java technology and runs on a wide range of platforms. The 3D graphics use OpenGL hardware acceleration and the Java technology allows integration into web pages. XNavigator relies on a client-server architecture and supports Open Geospatial Consortium (OGC) standards. Various OGC services such as Web 3D Service (W3DS), Web Map Service (WMS) and Web Feature Service (WFS) are supported. Vandysheva et al. (Citation2011) developed a prototype using XNavigator as a 3D web browser. This application is simple to operate using Java, a wide range of interaction and navigation is possible and it meets a number of requirements.
3.2. Comparison of the 3D visualisation solutions
In order to choose an appropriate solution for developing a 3D cadastral visualisation prototype, these options were carefully reviewed and their specifications were studied and finally, they were assessed against the requirements in . A summary of this comparison is presented in .
Table 2. Comparison table.
Google Earth and NASA World Wind are rejected as they are unable to represent underground objects. None of the listed solutions have built-in provision for cross-sectional views; however, the extendibility of WebGL and XNavigator allows development of a cross-section function. The availability of source code is important to flexibility in development of new functions. TerraExplorer and BS Contact are proprietary products and we preferred to work with open-source applications. Therefore, the remaining candidates were WebGL and XNavigator.
WebGL is chosen because of its rapid on-going development and better support through its community of users. WebGL can meet users’ expectations for better graphics on the Web and as a result many web browsers support this technology.
However, WebGL has some limitations:
WebGL cannot render massive datasets. The reason for this is that the supported browsers have a limited amount of cache memory, which cannot be exceeded. Also, loading massive data into RAM can crash the application (Pereira Citation2013); and
WebGL is designed to run on today's average computer systems. Older computers may not support WebGL due to their graphic card limitations.
4. Design and development of the prototype
Before describing the development of the prototype, some important issues involving data and users are reviewed. These considerations helped ensure that the prototype was fit for purpose.
4.1. Data
It is important to understand what types of data should be represented in a 3D cadastral application. Cadastral data includes both legal and physical data (Shojaei et al. Citation2013) and visualisation of these different types of data requires special functionality. Physical data includes walls, roofs, ceilings, doors, windows, etc. They are concrete and are visible. Legal data such as ownership boundaries are conceptual and abstract. Cadastral applications need to be able to represent both physical and legal data independently and to leave no room for ambiguity about the boundary of ownership spaces (Aien et al. Citation2013b). These legal counterparts can be both bounded and unbounded volumes (Lemmen et al. Citation2010).
There are many different 3D data formats such as Collada (collada.org), CityGML (www.citygml.org) and IFC (Industry Foundation Class) used to define 3D objects. Loading the data into WebGL/Three.js therefore involves finding a match between the formats it understands and the formats that best suit the physical and legal objects.
When direct import is not possible, there are two other approaches to loading data into WebGL in Three.js, namely hard coding and parsing JSON files. Hard coding is the simplest approach and codes of objects are written using Three.js components. This method is not suitable for an application that will load big data. The second approach is using JSON parser. However, JSON format does not support various types of geometry (e.g. lines) and it is limited to some basic 3D models and not big models. We therefore chose the Collada format for direct import of 3D objects. Collada is a widely used 3D file format defined in XML schema to transport 3D models among 3D applications and it provides a partial match to our requirements.
Collada parser, as part of Three.js libraries, is able to push the 3D models into Three.js libraries for rendering. Many others formats can be converted to Collada to be visualised in 3D. Various data formats for 3D cadastre have been proposed such as LandXML and KML (Shojaei et al. Citation2012), CityGML (Dsilva Citation2009) and IFC (El-Mekawy and Östman Citation2012).
We used IFC format in this development as we identified the following drivers in utilising IFC:
The new popular format among architectural companies is IFC, which is based on Building Information Modelling;
3D designs generated by architects in Victoria are often in IFC format;
It has enough flexibility to geometrically represent complex objects.
LandXML cannot support objects with complex geometry;
Although CityGML has a lot of attention in the academic environment, it is barely used in industry.
Many architectural companies create IFC models of buildings using various 3D software products such as Autodesk Revit and ArchiCAD in the 3D design process of developments. Then, they present the proposed 3D models of developments to their clients. After approval by clients, 3D models are converted into 2D plans and delivered to others such as developers, land surveyors and local governments. Although 3D models are created in the beginning of land development process, they are typically converted to 2D plans and are not employed in 3D in the whole process of land development.
El-Mekawy and Östman (Citation2012) have described the deficiencies of IFC for 3D cadastre and suggested extensions to meet cadastral needs. We see IFC as a strong candidate for long-term use in development of a 3D digital cadastre. However, IFC is not supported in WebGL. Therefore, IFC files need to be converted into Collada format to be represented in WebGL. IFC files may not include visual variables (e.g. colour, texture and transparency) and when they are converted to other formats like Collada, all objects will be white and have no transparency. Therefore, a process is required to assign style and change the colour or transparency of the objects for better representation.
Furthermore, IFC files only comprise physical objects such as walls, windows, slabs and doors. However, legal objects such as lots, easements and common property are the essential part of a 3D cadastre. These legal objects are not supported by most 3D products. For example, Autodesk Revit only supports physical objects and does not support legal objects. Therefore, in order to have legal objects in IFC files, we used the ‘Room’ component in Autodesk Revit as a substitute for 3D legal objects. Room in Autodesk Revit is defined as a component that is limited to the walls (or user defined boundaries) and ceiling and roof. This component can be used to define the boundary of lots, easements and common property. In order to draw 3D legal objects, as a test case, we employed the subdivision plans of a recent high-rise development to locate the ownership boundaries of the legal objects. By using Autodesk Revit, legal and physical objects associated with the test property were prepared for the prototype.
4.2. Users
This prototype can be used by anyone wishing to understand ownership boundaries. This includes the public, property managers, developers, architects, real estate agents, lawyers, land surveyors and registrars. While creating and editing 3D objects online is feasible, it is not recommended as it is too slow and too complicated to develop required functions on the Web (Shojaei et al. Citation2013). Therefore, the prototype is designed to provide only a viewing environment, supported by query and analysis features as described below.
4.3. The 3D prototype
This sub-section provides an overview, describes the architecture and functional features and reviews development issues in the prototype design and development phase.
4.3.1. Functional overview
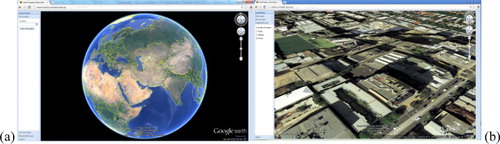
The prototype allows users to search and find developments based on the 2D cadastral parcel address. This would be the usual way to start an exploration and occurs in a browser window. Then, users are able to navigate around the property and see its location and other adjacent developments ( and ). Although Google Earth has limitation in representing underground objects, we utilised it in the prototype to provide a property overview.
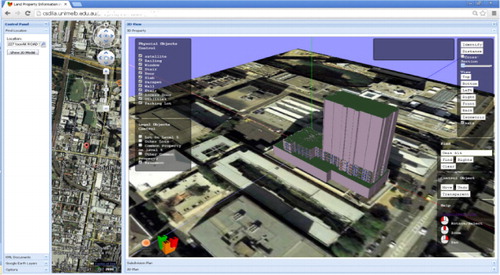
After that, by clicking a button, ‘Show 3D Model’, a new tab is opened containing the WebGL canvas providing a view of individual buildings on the parcel and associated legal objects (). At this stage, the prototype presents just a single parcel at a time because of the data load and processing limitations in WebGL. All the normal navigational functions are present for exploration, and a variety of additional functions have been included. For example, users are able to turn on/off various physical and legal objects to jointly or separately see the building parts and the ownership boundaries. Also, users may measure a distance in 3D or create a cross-section view. Moreover, all existing legal documents such as traditional subdivision plans are accessible as PDF documents in the prototype.
4.3.2. Architecture
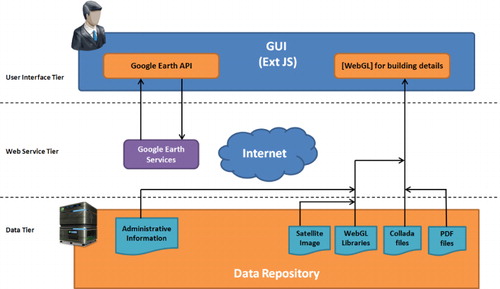
To develop these functionalities in the prototype, WebGL and Three.js libraries were employed and an architecture was designed as illustrated in . This architecture contains two main functional parts namely a data repository and the GUI (Graphic User Interface), which are explained here further.
4.3.2.1. Data repository
The data repository, which is located in the data tier, includes 3D models (Collada files), subdivision plans (PDF files), WebGL libraries, a satellite image and administrative information attached to 3D models in the server. Administrative information includes ownership, plan number and plan permit number. In order to connect administrative information to 3D models, unique IDs were attached to each object in the Collada files.
4.3.2.2. User interface
The GUI, located in the user interface tier, draws 3D models derived from the server. Various technologies were utilised to produce the GUI namely Google Earth API, WebGL technology, HTML 5, JavaScript and Ext JS. The Google Earth API provides users with some initial capabilities such as searching an address and so seeing a parcel in the context of the city. This could be extended to include the DCDB.
Google Earth was embedded in a page using JavaScript. Google Earth API is not open-source; however, some small changes are allowed to customise applications for various needs. For example, layers and objects can be switched on or off. These functions are controlled using the API. In addition, Ext JS was utilised, which provides the GUI programmer with customisable frames, buttons and tabs to build a robust application interface.
Because of limitations in the Google Earth API (), WebGL was employed to bring a 3D canvas into the browser. WebGL is able to render 3D models and provides users with the essential functions to explore 3D models. shows snapshots of the GUI. The features of the GUI are described in detail below followed by a review of some development challenges.
4.3.3. Functional features
We developed the following functions using Three.js libraries in the JavaScript development environment:
4.3.3.1. Identify tool
In order to retrieve information attached to each object in the scene, an Identify tool was developed using a ray tracing approach. By a mouse click on the scene, a hidden line is created from the 3D mouse position to the camera. This line may intersect with many objects on the scene. We find the nearest intersect to the camera and retrieve the information of that object for presentation in the GUI.
4.3.3.2. 3D Measurement tool
To measure distance in 3D, by each click on the screen, 2D mouse position is converted to 3D position using the ray tracing technique from the camera location to the nearest surface close to the mouse pointer. By using two consecutive 3D positions of mouse clicks, a 3D distance is computed and a line is drawn to show where the measured distance is.
4.3.3.3. Cross-section tool
Cross-section tool is used in order to show the internal complexity of buildings. The camera component in Three.js has two clipping planes, namely the near and far clipping planes. The objects that are located in between these planes are rendered. By changing the distance of the near clipping plane from the camera, different cuts through the objects can be viewed.
4.3.3.4. Various views
On the WebGL interface, different camera positions and angles create various views. In addition to free movement, the camera can be quickly located at specific angles such as front, back, isometric, top, right, left, top and bottom, relative to the building.
4.3.3.5. Search and find tool
An ability to query the prototype and to find and identify objects was part of the defined requirements (Section 2). Thus, after entering an attribute of the objects in the search box, objects with this attribute are highlighted. For example, owners can find the lots that they own by entering their names. These lots are not necessarily contiguous, for example the user's apartment, their allocated car park and their common ownership areas can be highlighted using a new colour. Once the query is completed, the original colour is restored.
4.3.3.6. Move, undo, transparent
In some cases, it is important to move an object (e.g. a lot) from its location and view it in more detail individually. Thus, a tool was developed that allows any highlighted object to be moved to somewhere else in the view. The object can be moved back to the previous position by a simple Undo option.
4.3.3.7. Object control
There are two sets of lists at the left side of the scene, which provides users with check-box control over object visibility. One list relates to built object, the other to legal objects. This allows any combination of physical and legal objects to be viewed.
4.3.3.8. Representing Administrative Information
There are two other tabs on the bottom of the page, which provide the option to view administrative information such as subdivision plans and associated documents. Users can refer to these for more detail and in order to see the actual legal documents.
4.3.4. Additional development issues
Other issues had to be resolved in this prototype to increase the usability.
4.3.4.1. Touch and click events
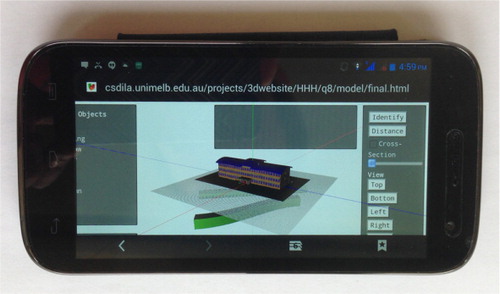
To support mobile devices (e.g. tablet or smartphone using Android), some special functions were added in the prototype. For instance, mobile devices unlike computers do not have pointing devices (e.g. mouse). Therefore, touch events must be implemented to be interpreted in the same way as click events. Adding touch events to the source code offers the ability to interpret finger activity on touch screens ().
4.3.4.2. Camera
There are various types of camera components in the Three.js libraries. In order to give the user the most natural form of control over the objects, the upside of the camera should be always towards the top of the screen – buildings do not normally turn upside down.
4.3.4.3. Zoom and pan
Zoom and pan can be difficult to use if poorly designed. For example, the amount of movement should be related to the distance of the camera from the object of interest. We typically want finer movements when closer. For example, if a camera is 100 meters from objects, by rotating the wheel of the mouse we can reduce this distance. However, this distance should be reduced more slowly when the objects are very close to the camera. The same thing is applicable for pan. When objects are far from the camera, pan speed should be high and vice versa. This provides smoothness in visualisation applications. Therefore, the source code in the Three.js libraries was changed to provide users with more smoothness in the prototype by changing the zoom and pan speed dynamically.
4.4. Case-study
We chose a recently completed multi-story building () as a case study for the evaluation process. This was a good test case because of the complexity of the building and the availability of required data. This building is located in Melbourne, Australia, and it includes 400 lots on 28 levels and six common property areas. It is a residential building as well as having some commercial subdivisions. The IFC file of the building was drawn from architectural plans and the subdivision documents of this development were provided by the associated surveying company to allow creation of legal objects.
We used Autodesk Revit to prepare the data as discussed in Section 4.1. Then, the IFC file, including physical and legal objects, was created. Later, Blender was used to convert the IFC file into Collada. Blender itself does not support importing and exporting IFC files, but a plug-in (ifcopenshell.org/ifcblender.html) was available to provide this functionality. However, this did not convert any material information such as surface colours. Therefore, colour, transparency and texture were added to the 3D building manually. In the next step, the 3D model was exported to the Collada format. The Collada file was edited in a text editor to include IDs linking the legal information to the 3D model. Then, the 3D model was copied to the server to be retrieved in the prototype.
5. Evaluation
We used the prototyping approach (Kotonya and Sommerville Citation1998) to quickly and easily assess the usability of the developed prototype. To do this, an online questionnaire was designed and administered to a group of professional users. Twenty-four specialists were invited to six demonstration sessions to evaluate the prototype and fill in the questionnaire. We selected participants who are intimately involved in the processes of development of high-rise buildings. All were from Victoria, Australia, as the case study is in this state and legislation and regulations in Victoria are different from other states in Australia. A summary of the participants in the evaluation phase is presented in .
Table 3. The list of participants and their expertise in the evaluation of the prototype.
At each session, we gave the subdivision plan of the case study to the participants and we asked them to read and understand the legal objects and ownership boundaries (approximately 5 minutes). Then, the case study was presented in the prototype (5 minutes). Later, the interactive capabilities such as search, identify, cross-section, measurements and navigation were presented (10 minutes). We then asked the participants if they are interested in working with the prototype (5 minutes) and to fill in a questionnaire later.
The questionnaire included 37 statements and questions to evaluate the functionality, usability and efficiency of the prototype. A selection of statements is presented in . In each case the respondents were asked to record their agreement with the statement on a five-point scale (Likert Scale) ranging from strongly disagree (1) to strongly agree (5). The other statements are not reported here as they used a different response type and do not form part of this evaluation.
Table 4. Key questions for evaluating the prototype in the questionnaire.
The System Usability Scale (SUS) method (Brooke Citation1996) was used for usability evaluation. For efficiency evaluation, questions regarding the time and cost of 3D representation of cadastral data were asked. As there were different types of users in the evaluation process, we could not combine the results; and findings for each category of users are presented separately. The results are summarised in .
Table 5. Analysis of the responses.
The scores for Questions 3, 7 and 12, indicate that the prototype successfully met user expectations. In addition, most of the participants mentioned such an application will save time in understanding ownership rights. However, based on Question 6, many participants preferred to present all the spaces including all common property areas. According to the received comments, the following aspects need to be further considered:
Data
All legal boundaries and relevant definitions need to be shown. There are a number of notations that are legally required in describing boundaries. For example, official measurements for parcel boundaries such as bearings and distances need to be added;
Most buildings do not have BIM files. Data capture and maintenance is a significant issue;
Data security and property right guarantee must be considered;
The costs associated with building 3D models are initially high. Cost savings would emerge a long time after a 3D approach to cadastral management was introduced; and
Representing unbounded volumes, such as height or depth limitations, has not been considered.
Functionality
Improve the response time;
Improve the cross-section tool; and
More key-in searching and filtering for lot and ownership information.
User interface
Reduce the number of menu options and improve the interface using menu bars and split screen view;
Develop a help page for users; and
Larger text to make it more legible; consideration of screen size should be incorporated for user interaction.
6. Conclusion
In this study, some 3D visualisation solutions were assessed against the requirements of 3D cadastral visualisation. For the first time, we investigated the capability of using WebGL technology in 3D cadastre by developing a 3D web-based cadastral visualisation prototype. In addition, several tools were developed for 3D cadastre in Three.js libraries. The developed prototype is capable of visualising both physical and legal objects to convey a clear image of ownership boundaries. Furthermore, an approach was developed for storing 3D legal objects in IFC format.
The developed prototype was tested and evaluated against user requirements and feedback was received. The overall feedback was positive and valuable comments about the functionality of the prototype will be considered in future work. There were insufficient building mangers to properly assess this category of users. Other potential users who are involved in land development processes, such as developers, architects and lawyers, can be included in future analysis.
According to the comments, the lack of a 3D visualisation application for representing ownership boundaries is evident and the industry is keen to find a solution. WebGL was found to have high potential, given further development, for managing properties in 3D.
Acknowledgments
This research project is an ARC Linkage Project (Land and Property Information in 3D) funded by the Australian Research Council (ARC) in collaboration with the Centre for Spatial Data Infrastructures and Land Administration, the University of Melbourne, Land Victoria (VIC), Land and Property Management Authority (NSW), Australian Research Council (ARC), Intergovernmental Committee on Surveying and Mapping (ICSM), AAM Group, Alexander Symonds Pty Ltd, Fender Katsalidis Architects, PSMA Australia and Strata Community Australia. The authors acknowledge the support of project partners and City of Melbourne in preparation of this paper and the associated research. However, the views expressed in this paper are authors’ and do not essentially reflect any of these parties’ points of view.
References
- Aditya, T., F. Iswanto, A. Wirawan, and D. P. Laksono. 2011. “3D Cadastre Web Map: Prospects and Developments.” In 2nd International Workshop on 3D Cadastres, edited by Fendel, E., Oosterom P. van, H. Ploeger, J. Stoter, A. Streilein, and T. Tijssen, November 16–18. Delft, The Netherlands.
- Aien, A., M. Kalantari, A. Rajabifard, I. Williamson, and R. Bennett. 2013a. “Utilising Data Modelling to Understand the Structure of 3D Cadastres.” Journal of Spatial Science 58: 215–234.
- Aien, A., M. Kalantari, A. Rajabifard, I. Williamson, and J. Wallace. 2013b. “Towards Integration of 3D Legal and Physical Objects in Cadastral Data Models.” Land Use Policy 35: 140–154. doi:10.1016/j.landusepol.2013.05.014.
- Aien, A., A. Rajabifard, M. Kalantari, I. Williamson, and D. Shojaei. 2011. “3D Cadastre in Victoria Australia: Converting Building Plans of Subdivision.” GIM International 25: 16–21.
- Brooke, J. 1996. “SUS: A Quick and Dirty Usability Scale.” In Usability Evaluation in Industry, edited by P. W. Jordan, B. Weerdmeester, A. Thomas, and I. L. Mclelland, 189–194. London: Taylor & Francis.
- Coors, V. 2003. “3D-GIS in Networking Environments.” Computers, Environment and Urban Systems 27 (4): 345–357. doi:10.1016/S0198-9715(02)00035-2.
- Dimovski, V., M. Bundaleska-Pecalevska, A. Cubrinoski, and T. Lazoroska. 2011. “WEB Portal for Dissemination of Spatial Data and Services for the Needs of the Agency for Real Estate Cadastre of the Republic of Macedonia (AREC).” 2nd International Workshop on 3D Cadastres, Delft, The Netherlands.
- Dsilva, M. G. 2009. “A Feasibility Study on CityGML for Cadastral Purposes.” Masters Thesis, Eindhoven University of Technology.
- Elizarova, G., S. Sapelnikov, N. Vandysheva, S. Pakhomov, P. V. Oosterom, M. D. Vries, J. Stoter, et al. 2012. “Russian-Dutch Project ‘3D Cadastre Modelling in Russia.’” 3rd International Workshop on 3D Cadastres: Developments and Practices, Shenzhen, China.
- El-Mekawy, M., and A. Östman, 2012. “Feasibility of Building Information Models for 3D Cadastre in Unified City Models.” International Journal of E-Planning Research (IJEPR) 1: 35–58.
- Frédéricque, B., K. Raymond, and K. Van Prooijen. 2011. “3D GIS as Applied to Cadastre - A Benchmark of Today's Capabilities.” FIG Working Week 2011, Marrakech, Morocco.
- Guo, R., L. Li, B. He, P. Luo, S. Ying, Z. Zhao, and R. Jiang. 2011. “3D Cadastre in China – A Case Study in Shenzhen City.” 2nd International Workshop on 3D Cadastres, Delft, The Netherlands.
- Hassan, M. I., and A. Abdul Rahman. 2010. “Malaysian Integrated 3D Cadastre.” XXIV International FIG Congress, Sydney, Australia.
- Jarroush, J., and G. Even-Tzur. 2004. “Constructive Solid Geometry as the Basis of 3D Future Cadastre.” FIG Working Week 2004, Athens, Greece.
- Kotonya, G., and I. Sommerville. 1998. Requirements Engineering: Processes and Techniques. New York: John Wiley & Sons.
- Lemmen, C., P. van Oosterom, R. Thompson, J. Hespanha, and H. Uitermark. 2010. “The Modelling of Spatial Units (Parcels) in the Land Administration Domain Model (LADM).” FIG Congress 2010, Sydney, Australia.
- Paulsson, J., and J. M. Paasch. 2011. “3D Property Research – A Survey of the Occurrence of Legal Topics in Publications.” 2nd International Workshop on 3D Cadastres, Delft, The Netherlands.
- Pereira, K. 2013. Water Simulation on WebGL and Three.js. Hattiesburg, MS: Bachelor of Science, The University of Southern Mississippi.
- Pouliot, J. 2011. “Visualization, Distribution and Delivery of 3D Parcels.” 2nd International Workshop on 3D Cadastres, Delft, The Netherlands.
- Shojaei, D., M. Kalantari, I. D. Bishop, A. Rajabifard, and A. Aien. 2013. “Visualization Requirements for 3D Cadastral Systems.” Computers, Environment and Urban Systems 41: 39–54. doi:10.1016/j.compenvurbsys.2013.04.003.
- Shojaei, D., A. Rajabifard, M. Kalantari, I. D. Bishop, and A. Aien, 2012. “Development of a 3D ePlan/LandXML Visualisation System in Australia.” 3rd International Workshop on 3D Cadastres: Developments and Practices, Shenzhen, China.
- Stoter, J. E. 2004. “3D Cadastre.” PhD Thesis, TU Delft.
- Stoter, J., and M. Salzmann. 2003. “Towards a 3D Cadastre: Where Do Cadastral Needs and Technical Possibilities Meet?” Computers, Environment and Urban Systems, Environment and Urban Systems 27 (4): 395–410. doi:10.1016/S0198-9715(02)00039-X.
- Stoter, J. E., and S. Zlatanova. 2003. “Visualisation and Editing of 3D Objects Organised in a DBMS.” Proceedings of the EuroSDR Com V. Workshop on Visualisation and Rendering, Enschede, The Netherlands.
- Vandysheva, N., A. Ivanov, S. Pakhomov, B. Spiering, J. Stoter, S. Zlatanova, and P. van Oosterom. 2011. “Design of the 3D Cadastre Model and Development of the Prototype in the Russian Federation.” 2nd International Workshop on 3D Cadastres, Delft, The Netherlands.
- Vandysheva, N., S. Sapelnikov, P. van Oosterom, M. de Vries, B. Spiering, R. Wouters, A. Hogeveen, and V. Penkov. 2012. “The 3D Cadastre Prototype and Pilot in the Russian Federation.” FIG Working Week 2012, Rome, Italy.
- van Oosterom, P. 2012. “Summary of the Third International FIG Workshop on 3D Cadastres – Developments and Practices.” Third International FIG Workshop on 3D Cadastres – Developments and practices, Shenzhen, China.
- van Oosterom, P. 2013. “Research and Development in 3D Cadastres.” Computers, Environment and Urban Systems 40: 1–6. doi:10.1016/j.compenvurbsys.2013.01.002.
- Ying, S., R. Guo, L. Li, and B. He 2012. “Application of 3D GIS to 3D Cadastre in Urban Environment.” 3rd International Workshop on 3D Cadastres: Developments and Practices, Shenzhen, China.