
Abstract
Forest data acquisition, which is of crucial importance for modeling global biogeochemical cycles and climate, makes a contribution to building the ecological Digital Earth (DE). Due to the complex calculations and large volumes of data associated with high-resolution images of large areas, accurate and effective extraction of individual tree crowns remains challenging. In this study, two GeoEye-1 panchromatic images of Beihai and Ningbo in China with areas of 5 and 25 km2, respectively, were used as experimental data to establish a novel method for the automatic extraction of individual tree crowns based on a self-adaptive mutual information (SMI) algorithm and tile computing technology (SMI-TCT). To evaluate the performance of the algorithm, four commonly used algorithms were also applied to extract the individual tree crowns. The overall accuracy of the proposed method for the two experimental areas was superior to that of the four other algorithms, with maximum extraction accuracies of 85.7% and 63.8%. Moreover, the results also indicated that the novel method was suitable for individual tree crowns extraction in sizeable areas because of the multithread parallel computing technology.
1. Introduction
Geographical data sharing and mining is of great importance in the construction of Digital Earth (DE) (Yang et al. Citation2008; Guo, Liu, and Zhu Citation2010; Guo et al. Citation2012) and similar tools, such as Virtual Geographic Environments (VGEs; Chen et al. Citation2013a; Lin, Chen, and Lu Citation2013). Because forests are one of the most important resources on Earth and the largest land ecosystem in the world, forest data collection is critical for the enrichment of geographic data (Hosseinjani and Tangestani Citation2011) and plays an important role in providing basic information to facilitate the analysis of ecological DE (Chen and Genderen Citation2008).
Individual tree crowns are a major component of forest data, which provides the basis for analyzing the forest growth status, evaluating deforestation conditions, estimating forest economic benefits and predicting forest biomass. Tree crowns also play an important role in studies of forest economy, environment improvement, and ecological balance (Song et al. Citation2010). The study of tree crowns enables the effective, careful management of trees (Ke and Quackenbush Citation2011). Despite increasing interests regarding individual tree crowns, conventional methods (i.e. field surveys) for assessing individual tree crowns are unfavorable for widespread management due to their long investigation periods and low precision rates. However, the development of remote sensing technologies offers advantages such as the ability to analyze a large area, improved speed, and greater accuracy. As the spatial resolution of remote sensing images has improved due to recent advances in satellite technology, spatial geometric information such as tree crown shape, size, texture, and relationship to the adjacent tree crowns can now be clearly recognized in images (Gougeon Citation1995; Hirschmugl et al. Citation2007). The use of high spatial resolution images for individual tree crown extraction could be of great importance in forest management (Leckie et al. Citation1999).
In the last three decades, effective algorithms have been developed for individual tree crown extraction using high spatial resolution images, such as the fixed window method (Walsworth and King Citation1999), dynamic window method (Culvenor Citation2002), template matching method (Pollock Citation1996), multiscale tree crown extraction method (Brandtberg and Walter Citation1998), valley following method (Gougeon Citation1995), region growing method (Erikson Citation2003), and model-based method (Sheng, Gong, and Biging Citation2001). In this study, the former four methods will be compared with the proposed method:
Based on the spatial resolution and the average size of the individual tree crowns, the fixed window method first predefines the size of the matching window to search the images. When the value of center pixel is larger than those of the surrounding pixels, the pixel is considered the center of a tree crown (Walsworth and King Citation1999; Pouliot et al. Citation2002; Gebreslasie et al. Citation2011). The advantages of the fixed window method are its simplicity and speed. However, the appropriate window size is difficult to identify, because relatively small windows may overcount large tree crowns, whereas larger windows may ignore smaller crowns. Therefore, this algorithm is more suitable for areas in which the tree crowns are relatively uniform. In regions in which the individual tree crown sizes differ substantially, the window size is difficult to determine, and the result is inconsistent.
To address the shortcomings of the fixed window method, the dynamic window method was developed for areas in which tree crown sizes are nonuniform. The algorithm is characterized by the dynamic change in the matching window and can adjust the size of the window based on different conditions (Wulder, Niemann, and Goodenough Citation2000; Culvenor Citation2002; Song et al. Citation2010). However, the flexibility and complex computations of the dynamic window method require more time than the fixed window method, resulting in low efficiency.
Another popular method for individual tree crown detection is the template matching method. Based on the shape feature and texture information, this method applies a user-defined individual tree crown shape and image brightness to match and extract other individual tree crowns (Pollock Citation1996; Tarp-Johansen Citation2002). This algorithm has a high matching accuracy for a specific forest, and a matching template that is similar to the majority of tree crowns in the experimental forest is required. Better templates always lead to a better matching effect and higher accuracy, although the development of such a template usually requires continuous manual testing and verification (Mallinis et al. Citation2008).
The multiscale tree crown extraction method defines an individual tree crown size as a spatial scale (the radius of the tree crown), and then adapts the algorithm for different scales to extract individual trees with different tree crown sizes (Brandtberg and Walter Citation1998; Hay et al. Citation2005; Zhang et al. Citation2012). This algorithm is well suited to forest land with obvious tree crown, whereas the accuracy of this algorithm declines greatly for the trees with mixed tree crown sizes.
To enrich the base data of ecological DE, this study developed and evaluated the performance of a SMI-TCT algorithm for individual tree crowns extraction over a sizeable area. First, the TCT algorithm was developed to cut the high-resolution images into tile images and enable multithread processing of these images. Second, the SMI algorithm was established based on the MI algorithm and self-adaptive templates for the different tree crowns. The SMI algorithm was then applied to extract the positions and diameters of the tree crowns in combination with the TCT algorithm. Next, the accuracy of the SMI-TCT algorithm was tested in comparison with four other commonly used methods in an analysis of the Beihai and Ningbo regions. Finally, discussions and future suggestions were proposed for future work.
2. Materials
2.1. Study area
Based on the distinction of cultivated and natural forests, two different areas were selected for this study ().
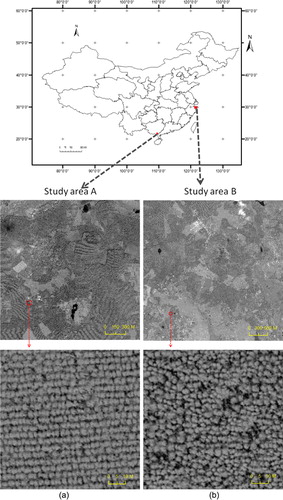
Study area A is located east of Beihai City in Guangxi Province, China (109°43′E, 22°14′N). The area is influenced by a tropical north monsoon climate, with high temperatures occurring throughout the year. The soil-water conditions are suitable for plant and tree growth. Guangxi Province is one of the largest planting areas of eucalyptus in China. The chosen study area is mainly covered with high-density cultivated eucalyptus. The trees are uniform in size and regularly distributed, and the outlines of the tree crowns are clear in high spatial resolution remote sensing images.
Study area B is located in the mountainous region near Jiulong Lake, east of Ningbo City in Zhejiang Province, China (121°39′E, 30°1′N). The area is influenced by a subtropical monsoon climate, and the typical vegetation types are subtropical evergreen broad-leaved forest (Li et al. Citation2002). Area B is mainly covered with natural forest, and landscape plants are abundant. Therefore, the shape and size of the vegetation varies, and the outlines of tree crowns are relatively blurred in high spatial resolution remote sensing images.
2.2. Remote sensing data
GeoEye-1 panchromatic images were used as data sources. GeoEye-1 was launched in September 2008, and provides the 0.5-m panchromatic images and 2-m multispectral data. The spectral range of each band is as follows: 450–800 nm (pan), 450–510 nm (blue), 510–580 nm (green), 655–690 nm (red), and 780–920 nm (near infrared). Due to its high resolution and revisit period, this satellite shows great potential for use in forest management (Gougeon Citation1995; Walsworth and King Citation1999; Culvenor Citation2002; Ke and Quackenbush Citation2011; Ardila et al. Citation2012; Santoro et al. Citation2013).
In this study, a GeoEye-1 panchromatic image with an extent of 5 km2 was obtained for area A on 16 October 2009 (). The image data were taken at 03:17 (GMT) in clear weather condition, with the sun elevation angle at 55.1° and the sensor view zenith angle at 73.9°. The other GeoEye-1 panchromatic image with an extent of 25 km2 was acquired for area B. The image was taken at 02:39 (GMT) on 31 May 2011 (), with the sun elevation angle at 72.0° and the sensor view zenith angle at 64.5°.
3. Methods
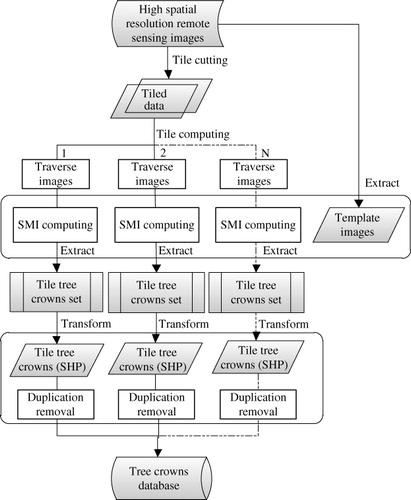
A flowchart for the automatic extraction method for individual tree crowns from high spatial resolution remote sensing images is shown in and includes operations such as tile cutting, image traverses, self-adaptive MI calculations, collective extraction of tree crowns, collective conversion of tree crowns, and duplicate removal. The SMI-TCT algorithm is divided into two parts according to its function: (1) TCT is used to greatly improve the computation efficiency for high spatial resolution images; and (2) SMI is proposed to achieve automatic localization and extraction of individual tree crowns.
3.1. Tile computing technology
Tile data that significantly accelerate the transmission and display rate are widely used in the storage and publishing of web maps and the construction of a pyramid preload cache for remote sensing images (Liu et al. Citation2007; Chen et al. Citation2013b; Chen et al. Citation2012). Due to the large amount of information associated with high spatial resolution images of large areas, the data processing and analysis methods are complex and require extensive calculation. TCT was applied to accelerate the extraction of individual tree crowns from high resolution data in this study.
TCT was developed from the concept of tile display. Based on the tiles, the TCT algorithm is applied to increase the calculation speed using multithread processing on a single computer or cooperative processing on a multicomputer platform. The TCT algorithm is a global call method that includes image tiling, tile analysis, and the integration of completed tiles ().
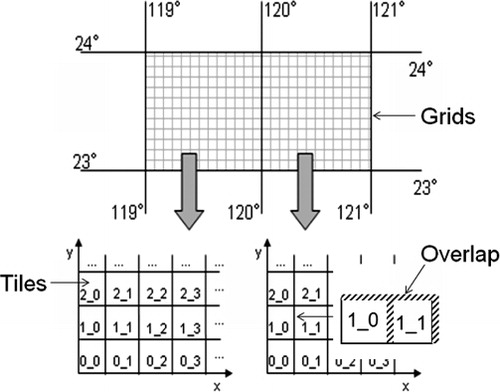
Image tiling is a process of cutting high spatial resolution remote sensing data into small pieces of images. To facilitate the storage and management of tiles, remote sensing images first clipped to a nominal 1° × 1° grids. Each grid section (i.e. tile) and its associated folder are then separately named as vertex coordinates of the grid. Finally, based on the overlap (offset) between grids, which are used to maintain the integrity of individual tree crowns on the edges of grids, tiles are obtained from images corresponding to the grids and stored in a folder ().
For each tile, the longitude and latitude at the left bottom are given as follows:
Variables η and λ (in Formula 1) that are used to describe the range of tile images are the key parameters influencing the computation efficiency. If the values of η and λ are too large, the significance of tile management will be weakened, whereas values that are too small will decrease the efficiency of tile management. In web maps, tiles of 256 × 256 pixels are typically used to cut the images; this size has been shown to be most suitable for computer display. However, in consideration of the best size for the calculation and the efficiency of tile management in the TCT algorithm, tiles of 1024 × 1024 pixels were adopted in this study.
Because tree crowns can often be divided at the edge of tiles, it is possible that some tree crows could not be extracted or that incomplete crowns were obtained. Therefore, x0 and y0 that are the overlap (offset) of the tile images were fitted to ensure the data integrity (in Formula 1). In the study areas, most of the tree crowns diameters were < 10 m. To compare multiple experiments, an overlap area of 20 × 20 pixels was applied in the tile calculation.
Based on the tile images, the SMI described in Section 3.2 was applied to extract tree crown information and implement traversing in the high-resolution images. The traversal results that include position information, MI and tree crown sizes were then saved as tile images. To effectively manage the traversal results and conveniently analyze the dataset, the results in raster format were converted to vector format (Shapefiles were used in this study). The vector files also existed in tiling form. During the tile calculation process, each individual tile operates independently and is unaffected by other tiles. Therefore, the method is suitable for multithread processing, particularly when the calculation is complex.
Subsequently, tree crown integration that involves duplicate removal and data storage is performed on the tile results. Because the SMI is matched via the traversal method and there is an overlapping area for each tile image, duplicate removal is required to obtain the final result. Numerous experiments have established that small overlap sizes may lead to the deletion of tree crowns, whereas large overlap values may lead to the extraction of two tree crowns in the same position. Therefore, the overlap size setting is a key parameter for duplicate removal. In this study, when the overlay area of the two tree crowns was greater than 40%, the one with less MI was removed through the overlay analysis of geographic information system (GIS). After tile analysis and tree crown extraction, the results were aggregated and saved as the database for future DE analysis.
3.2. Self-adaptive mutual information algorithm
3.2.1. Improvement of MI method
MI is a measurement that describes the uncertainty and complexity of a variable and is usually expressed as the joint probability density or information entropy of two variables (Viola and Wells Citation1997). Variables with a small MI are more independent, whereas large MI values indicate dependent variables (Kraskov, Stögbauer, and Grassberger Citation2004). Here, the foundation of MI is the extraction of representative tree crown templates, followed by the traversal of the raw image using the templates. The MI is then continuously calculated between the template image and the traversal image as the fitness function to determine whether there are individual tree crowns in the traversal area.
In information theory, the value of MI and entropies of the variables are defined as shown in Formulas (2)–(4) (Kerroum, Hammouch, and Aboutajdine Citation2010; Amiri et al. Citation2011).
According to the formulas above (Formulas 2–4), MI can be determined by calculating the probability density of variables, as shown in Formula (5) (Kerroum, Hammouch, and Aboutajdine Citation2010; Long et al. Citation2013).
For template image Vg and traversal image Ug (Ug is the overlapping region of Vg and the original image) in the individual tree crowns detection, histograms are used to estimate probability densities of the two images (Mackay Citation2009). According to the histogram-based method, marginal probability density and
, and joint probability density P
xy
(x, y) can be separately estimated by gray-level histograms and joint histograms, as shown in Formulas (6)–(7) (He and Narayana Citation2002). In this study, a gray-level histogram is a one-dimensional density function that represents the distribution of gray values in GeoEye-1 image, and a joint histogram is a two-dimensional array that is used to calculate the occurrence frequency of intensity combinations in corresponding locations of Ug and Vg (Maes et al. Citation1997; Mackay Citation2009). Then the value of MI can be calculated by Formula (8) (He and Narayana Citation2002; Kerroum, Hammouch, and Aboutajdine Citation2010).
In tree crown extraction, the gray-level histogram containing the frequency of occurrence of gray values is generally difficult for statistics due to the large range of gray levels. Thus, reduced-range gray levels are used for constructing histograms in this study. According to the Formula (9), there are two simple steps to reduce the range of the gray levels: (1) normalizing the gray values of the images; and (2) determining the optimum intensity level M for reduced range. Then the gray levels are changed into integers in the range of 0–M−1.
On the other hand, as the tree crown is multiscale in nature and the template which is picked up within the image commonly involves an individual tree crown, various tree crowns cannot be described by a single template. In addition, for individual tree crowns that are less informative in the high-resolution images, templates with higher MI thresholds are needed to reduce the probability of misrecognition. However, it will be difficult to match the tree crowns using excessively high threshold values. Therefore, on the basis of categories classified by the shapes and sizes of different tree crowns, multitemplates that are manually selected from images are adopted to replace the single template. Moreover, multitemplates are required to be representative of the tree crown information. When the sizes and shapes are uniform in the study area, the categories can be reduced, and fewer templates are used; otherwise, larger number of templates must be extracted. According to the reduced-range gray values and multitemplates, the calculation of MI values in the same position of the original image can be improved to the Formula (10).
In addition, because the tree crowns are always indicated by circular features on the image, the values of MI are limited within the edge lengths of the matching templates. A restrictive condition is then added in Formula (10) to yield the following expressions:
3.2.2. Framework for SMI algorithm
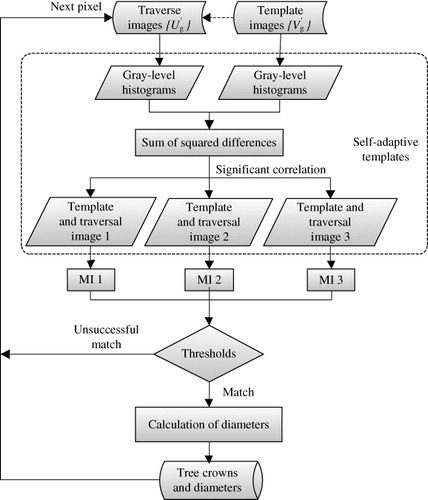
Because of the multiple templates, a large amount of calculation is needed for MI in Formula (10). To improve the calculation efficiency, SMI algorithm that is based on the self-adaptive templates is adopted for the research. Self-adaptive templates refer to the templates that are significantly related to the corresponding traversal images. In this study, sum of squared differences of gray-level histograms between template and corresponding traversal image is used as an evaluation standard of self-adaptation, where a smaller value of the result generally indicates a stronger relationship between the two images. Considering the differences of gray levels of tree crowns, three templates are finally chosen as the self-adaptive templates.
The specific process of tree crown extraction using SMI algorithm is achieved by the following steps (): (1) multitemplates are manually chosen from the original images, and the corresponding gray-level histograms are constructed based on the reduced-range gray levels; (2) traversal images are obtained from relevant template images and original images, and corresponding gray-level histograms are calculated; (3) self-adaptive templates are chosen as the preliminary optimal templates; (4) if more than one MI value is larger than the preset threshold, the matching is completed, and the diameter of the extracted tree crown will be calculated from weighted averages of the side lengths of the matching templates (MI values that represent matching accuracies are used as the weight coefficients); (5) multitemplates will traverse to the next pixel and steps 2–4 are then repeated for the remaining tile images; and (6) for an unsuccessful match, the procedure will return to the step 5.
3.2.3. Parameters of SMI
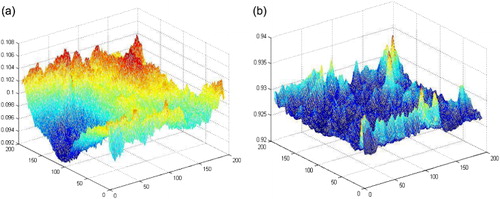
In the SMI algorithm, the intensity level M that is used for constructing a simpler histogram is a key parameter for extracting results. When the value of M is too large (as shown in , for M = 32), the values of MI will be too centralized to establish thresholds and extract tree crowns. However, when the value of M is too small (e.g. M = 2 or 4), the differences among the MI will be reduced, resulting in inaccurate points in the extracted results. Based on empirical tests, a value of M = 8 was used in this study, and the MI value was relatively stable as shown in .
Moreover, according to the distribution of trees in different areas and different features of the tree crowns in Geoeye-1 images (i.e. shapes of tree crown influenced by solar/senor angles of the images, shadows of the trees etc., Ke and Quackenbush Citation2011; Ardila et al. Citation2012; Santoro et al. Citation2013), different matching templates and thresholds were adopted by empirical tests in this research. In the area of eucalyptus forest at Beihai, where most of the diameters of tree crowns are < 7.5 m and tree crowns are arranged evenly and regularly (diameter that is < 3 m can be difficult to extract from Geoeye-1 images), 10 templates were used for dynamic changes, and 0.9 was used as the MI threshold. In addition, in the natural area of Ningbo, because the forest is complex and intermixed with artificial structures, the matching is very difficult. Besides, most of the diameters of tree crowns are less than 8.5 m in the forest. Therefore, 20 templates were used for dynamic changes, and 0.85 was used as the MI threshold. The parameters are presented in .
Table 1. The parameters of templates and MI thresholds in SMI algorithms.
3.3. Accuracy assessment
To evaluate the SMI-TCT algorithm, reference data obtained from field surveys and visual interpretation of aerial image and Geoeye-1 images (Section 2.2) was used as the truth. Among them, field surveys were carried out in November 2009 in Beihai and May 2011 in Ningbo, and aerial image with the spatial resolution of 0.4 m was acquired on 17 April 2010, in Ningbo. Based on the data above, the accuracy was assessed by comparing the reference tree crowns and the extraction results. As both of incorrect objects and missing trees could impact the results, commission errors and omissions errors were took into the assessment, as shown in Formula 12 (Pouliot et al. Citation2002; Ke and Quackenbush Citation2011).
4. Results
4.1. Methods implementation
SMI-TCT was programmed using the Python Language, and Geoeye-1 images were processed by the Python Imaging Library (PIL) that is a free library for Python. The procedure to extract tree crowns was implemented on a Windows 7 operating system using a quad-core CPU (2 threads per core, 2.2 GHZ), 4 GB memory, and 1 TB hard disk (7200 rmp).
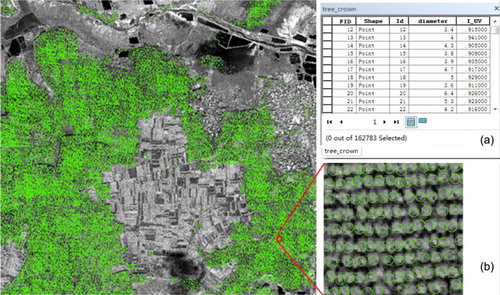
Based on SMI-TCT and the operating environment of the program, 162,749 pieces of tree crowns were extracted in study area A, which had an extent of 5 km2. Meanwhile, 420,459 pieces of tree crowns were recognized in study area B with an area of 25 km2. shows the results of the tree crowns extraction for study area A, including the location information and properties. The attributes contained the fields of tree crown diameters (diameter) and MI value (I_UV), which were used to analyze the growth and quantity of tree crowns. Based on the MI values that are used as weight factors, tree crown diameters are calculated from weighted averages of the side lengths of the matching templates in this study. Because MI values indicate the matching accuracies between the template images and the traversal images, effectiveness of the diameters can be accessed by MI values. Generally, the higher MI values always indicate the more effective diameters. Therefore, the field of tree crown diameters can generally represent the maximum distances of tree crowns according to the high values of MI in this study.
Moreover, the images of the different study areas were subdivided into regular forest land and mixed forest land to obtain accuracy statistics. Formula (12) was then adopted for the statistics, and validation areas of 20,000 m2 (10,000 m2 each for the regular forest land and mixed forest land) were selected for each image for statistical analysis. Four hundred and eighty-two pieces of tree crowns and 29 incorrect objects were extracted, with 23 missing tree crowns, yielding an accuracy of 89.7% for the regular forest land in Beihai. For the mixed forest land of the same area, 256 pieces of tree crowns were extracted, with 38 incorrect objects and 22 missing trees, yielding a lower accuracy of 78.4%. The overall accuracy in Beihai was 85.7%. By contrast, the algorithm detected 378 pieces of tree crowns in the regular forest land in Ningbo, with 53 incorrect and 89 missing objects, yielding an accuracy of 69.6%. Furthermore, 218 pieces of tree crowns were extracted in the mixed forest land in Ningbo. The 61 incorrect and 71 missing objects reduced the accuracy to 54.3%. The overall accuracy in study area B was 63.8% ().
Table 2. Accuracy of SMI-TCT and the four other algorithms.
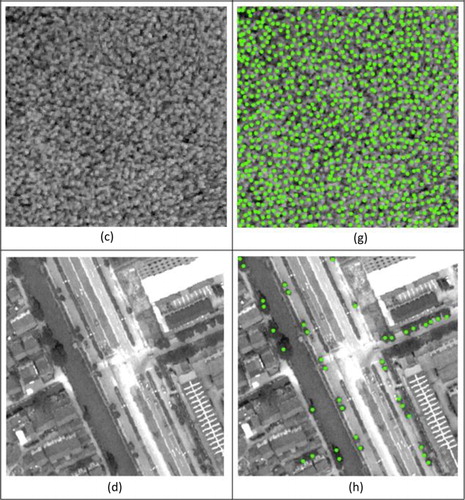
The results of the individual tree crown extraction using the SMI-TCT algorithm are shown as in . In the same study area, the extraction accuracy for regular forest land was higher than that for mixed forest land, primarily because the extraction of tree crowns using the SMI-TCT algorithm was dependent on shape information. When the shapes of ground objects were similar to those of tree crowns, stones, buildings, and other objects might be mistakenly extracted. The error probability was higher for mixed forest land than for regular forest land. Moreover, because the number of templates was limited, tree crowns with irregular sizes and diverse shapes may also have reduced the accuracy in the mixed forest land compared with regular forest land. In addition, in the cultivated forest in Beihai, the trees in the forest were arranged in an orderly manner and spaced evenly, and the shapes of the tree crowns were also uniform, in contrast to the natural forest in Ningbo, in which the trees were randomly distributed and the tree crown shapes varied significantly. Because the results were greatly affected by the tree interval and tree crown shape, the extraction accuracy for cultivated forest was higher than that for natural forest. For the cultivated forest, the more obvious tree interval and greater MI increased the success rate of tree crown extraction; the uniform sizes and shapes that were recognized by the small templates also improved the matching effect.
Figure 7. Results of individual tree crowns using SMI-TCT algorithm in regular forest land and mixed forest land; (a, c) regular forest land in Beihai and Ningbo, respectively; (b, d) mixed forest land in Beihai and Ningbo, respectively; (e–h) results of individual tree crowns associated with (a)–(d).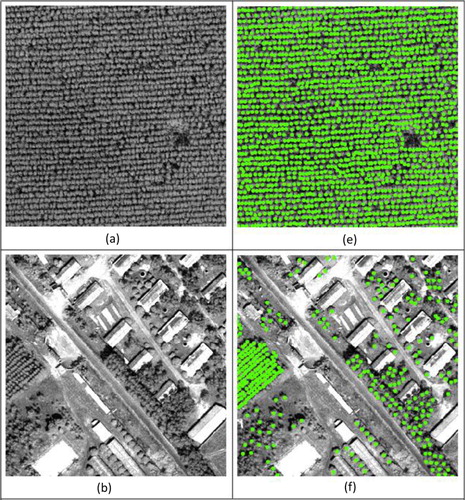
4.2. Evaluation of SMI-TCT algorithm
To evaluate the performance of the SMI-TCT algorithm, we compared this method with the fixed window algorithm (Walsworth and King Citation1999), dynamic window method (Culvenor Citation2002), template matching method (Pollock Citation1996), and multiscale tree crown extraction method (Tarp-Johansen Citation2002) in terms of the consumed time and extraction accuracy. The comparison included two GeoEye-1 images of the study areas, and the sampling areas were identical to those in Section 4.1. Moreover, the four other algorithms above were also implemented by the same programming language and operating environment of STM-TCT. The results of the different algorithm are presented in .
In the regular forest area, the extraction accuracy of the SMI-TCT algorithm was 89.7% for the cultivated forest in Beihai, which was slightly lower than the template matching method accuracy of 90.1%; but higher than the results of the other three methods (82.3%, 85.65%, and 76.6%). These values indicate that the accuracy obtained from the SMI-TCT algorithm was similar to the template matching method but higher than others. Because the trees were ordered and had similar crown shapes in Beihai, more accurate detection of tree crowns could be achieved using templates with approximate shapes. However, because the sizes and shapes differed greatly in Ningbo, that was covered with natural forest, the dynamic windows and multi-templates methods could achieve a better matching effect. Thus, the SMI-TCT algorithm, with an accuracy of 69.6%, and the dynamic window method, with an accuracy of 70.8%, were more accurate than the other three methods (accuracies of 53.6%, 53.7%, and 60.4%). Because trees were the main objects in regular forest, the probability of errors was decreased, and all of the methods had relatively high accuracy, particularly the SMI-TCT algorithm.
Moreover, in the mixed area, the extraction accuracy of the SMI-TCT algorithm in Beihai was 78.4%, which is higher than that of the four other algorithms, which had accuracies of 67.4%, 77.4%, 77.2%, and 70.7%. The extraction accuracy at Ningbo was 54.3%, which was also higher than the results of the four other algorithms (43.8%, 51.7%, 42.0%, and 52.9%). The results indicated that the extraction accuracy of individual tree crowns by the SMI algorithm based on tile computing in mixed forest land was higher than that obtained by the other methods in both Beihai and Ningbo. Because a template set that included comprehensive shapes of tree crowns was adopted in the SMI-TCT algorithm and MI was suitable for matching the fuzzy objects, the algorithm achieved better performance than the other methods regarding tree crown extraction. However, due to the presence of complex ground objects and the irregular sizes and shapes of tree crowns, the outlines of tree crowns in mixed forest land were blurred in the high spatial resolution image. Therefore, because the automatic extraction algorithms had to accommodate shapes and other objects, the accuracies of these algorithms were generally lower for mixed forest land than for regular forest.
The overall accuracies of the SMI-TCT algorithm were 85.7% and 63.8% in Beihai and Ningbo, respectively, including the regular forest land and mixed forest land. Both of these values are higher than those obtained by the four other methods, which yielded accuracies of 77%, 82.6%, 85.6%, and 74.5% in Beihai and 49.9%, 63.5%, 49.2%, and 57.5% in Ningbo. The proposed SMI-TCT method was also more stable and reliable than the other evaluated methods.
In addition, SMI-TCT algorithm that had two efficiency advantages was adapted for tree crown extraction in sizeable areas. First, because the MI algorithm adopts reduced-range gray-level histograms and joint histograms in this study, SMI was characterized as a simple, high efficiency calculation. Second, the algorithm is realized by tile calculation. Based on the tile images cut from the high-resolution images, multithread processing (eight threads for parallel processing in this study) is used to extract tree crowns to make full use of multitasking function, which always carries out simultaneously with disk access and data processing to increase the utilization of CPU and enhance the efficiency of individual tree crown extraction.
5. Discussion
As a fitness function for statistical features, the MI algorithm plays an important role in data matching, classification, and extraction (Petridis and Perantonis Citation2004; Peng, Long, and Ding Citation2005). In this study, an SMI algorithm was proposed to accurately extract tree crowns of varying morphologies from complicated information with high applicability. However, because individual tree crown only contains about 100 pixels in the GeoEye-1 images, small amount of information is given during the calculation of SMI. Incorrect and missing extractions that are dependent on opposite extremes of threshold settings were the main sources of error for tree crown extraction using SMI. Therefore, ongoing research should focus on the chosen of templates set and establishing a balance between the two errors to increase the accuracy of the algorithm in mixed forest lands (Peng, Long, and Ding Citation2005; Van Coillie, Verbeke, and De Wulf Citation2007). For other practical applications, optimal results will be obtained by analyzing actual circumstances and properly designing the SMI algorithm.
For most remote sensing algorithms, the processing efficiency decreases as the data is increasing. The image processing efficiency can be markedly improved by appropriate tile cutting, analysis, and management for high spatial resolution images (Kanka, Riesenberg, and Kreuzer Citation2009). Due to the limitation of the computer equipment, the advantages of multithread processing and cooperative processing cannot be utilized fully in the more sizeable study area in this study. In this case, the improvement of equipment performance and related optimization strategy of algorithms (i.e. optimizing disk access) would increase the processing efficiency of high-resolution images with bigger datasets. These kinds of tasks will be explored in future work.
In addition, the tree crown extraction in this study did not include the delineation of tree crown. There are two reasons for this omission. First, the main objective of delineation extraction of tree crowns is to confirm the tree crown sizes (Zhang et al. Citation2006; Wang Citation2010). In this experiment, matching templates were adopted to extract tree crown diameters and were saved as attributes of the results. The diameters that were calculated from the side lengths of the matching templates could generally reflect the maximum distances of the tree crowns. Second, the detection of outlines is time-consuming for the extraction of tree crowns over a large area (Erikson and Olofsson Citation2005; Katoh and Gougeon Citation2012). To collect forest information for DE, the average radii and areas still need to be calculated after obtaining the contours from the tree crowns, which will increase the computing time and will decrease the efficiency. Therefore, this study proposes a simpler, direct method to rapidly and automatically acquire the positions and sizes of tree crowns in sizeable areas. As the operational speed of computers increases and automatic detection and automatic segmentation improve, the contours of tree crowns will be integrated into the SMI-TCT algorithm for sizeable areas.
6. Conclusion
This study proposes a novel method for the extraction of individual tree crowns using high spatial resolution images. The SMI-TCT algorithm was implemented using GeoEye-1 images of different study areas (Beihai and Ningbo in China). The method successfully extracted individual tree crowns in both regular and mixed forest land with high accuracy. Comparison with the fixed window, dynamic window, template matching, and multiscale tree crown extraction algorithms confirmed the higher accuracy of the SMI-TCT algorithm. Moreover, because the algorithm conformed to the distributed design, it was suitable for the extraction of individual tree crowns in sizeable areas. However, further improvements are needed for improving the accuracy in mixed forest land and extracting delineation of tree crown.
Acknowledgments
The authors would like to thank Yingcheng Lu, Lingtong Du, and Zhihui Liu for the valuable suggestions, and also like to thank anonymous reviewers for the constructive comments.
Additional information
Funding
References
- Amiri, F., M. R. Yousefi, C. Lucas, A. Shakery, and N. Yazdani. 2011. “Mutual Information-based Feature Selection for Intrusion Detection Systems.” Journal of Network and Computer Applications 34 (4): 1184–1199. doi:10.1016/j.jnca.2011.01.002.
- Ardila, J. P., W. Bijker, V. A. Tolpekin, and A. Stein. 2012. “Context-Sensitive Extraction of Tree Crown Objects in Urban Areas Using VHR Satellite Images.” International Journal of Applied Earth Observation and Geoinformation 15: 57–69. doi:10.1016/j.jag.2011.06.005.
- Brandtberg, T., and F. Walter. 1998. “Automated Delineation of Individual Tree Crowns in High Spatial Resolution Aerial Images by Multiple-Scale Analysis.” Machine Vision and Applications 11 (2): 64–73. doi:10.1007/s001380050091.
- Chen, M., H. Lin, M. Y. Hu, L. He, and C. X. Zhang. 2013a. “Real-Geographic-Scenario-based Virtual Social Environments: Integrating Geography with Social Research.” Environment and Planning B: Planning and Design 40 (6): 1103–1121. doi:10.1068/b38160.
- Chen, M., H. Lin, Y. N. Wen, L. He, and M. Y. Hu. 2012. “Sino-VirtualMoon: A 3D Web Platform Using Chang'E-1 Data for Collaborative Research.” Planetary and space science 65 (1): 130–136. doi:10.1016/j.pss.2012.01.005.
- Chen, M., H. Lin, Y. N. Wen, L. He, and M. Y. Hu. 2013b. “Construction of a Virtual Lunar Environment Platform.” International Journal of Digital Earth 6 (5): 469–482. doi:10.1080/17538947.2011.628415.
- Chen, S. P., and J. V. Genderen. 2008. “Digital Earth in Support of Global Change Research.” International Journal of Digital Earth 1 (1): 43–65. doi:10.1080/17538940701782510.
- Chow, W. S. T., and D. Huang. 2005. “Estimating Optimal Feature Subsets Using Efficient Estimation of High-Dimensional Mutual Information.” IEEE Transactions on Neural Networks 16 (1): 213–224. doi:10.1109/TNN.2004.841414.
- Cover, T. M., and J. A. Thomas. 2006. Elements of Information Theory. 2nd ed. Hoboken, NJ: John Wiley & Sons.
- Culvenor, D. S. 2002. “TIDA: An Algorithm for the Delineation of Tree Crowns in High Spatial Resolution Remotely Sensed Imagery.” Computers & Geosciences 28 (1): 33–44. doi:10.1016/S0098-3004(00)00110-2.
- Erikson, M. 2003. “Segmentation of Individual Tree Crowns in Colour Aerial Photographs Using Region Growing Supported by Fuzzy Rules.” Canadian Journal of Forest Research 33 (8): 1557–1563. doi:10.1139/x03-062.
- Erikson, M., and K. Olofsson. 2005. “Comparison of Three Individual Tree Crown Detection Methods.” Machine Vision and Applications 16 (4): 258–265. doi:10.1007/s00138-005-0180-y.
- Gebreslasie, M. T, F. B. Ahmed, J. A. N. Van Aardt, and F. Blakeway. 2011. “Individual Tree Detection Based on Variable and Fixed Window Size Local Maxima Filtering Applied to IKONOS Imagery for Even-aged Eucalyptus Plantation Forests.” International Journal of Remote Sensing 32 (15): 4141–4154. doi:10.1080/01431161003777205.
- Gougeon, F. A. 1995. “A Crown-Following Approach to the Automatic Delineation of Individual Tree Crowns in High Spatial Resolution Aerial Images.” Canadian journal of remote sensing 21 (3): 274–284.
- Guo, H. D., J. B. Liu, A. Li, and J. G. Zhang. 2012. “Earth Observation Satellite Data Receiving, Processing System and Data Sharing.” International Journal of Digital Earth 5 (3): 241–250. doi:10.1080/17538947.2012.669963.
- Guo, H. D., Z. Liu, and L. W. Zhu. 2010. “Digital Earth: Decadal Experiences and Some Thoughts.” International Journal of Digital Earth 3 (1): 31–46. doi:10.1080/17538941003622602.
- Hay, G. J., G. Castilla, M. A. Wulder, and J. R. Ruiz. 2005. “An Automated Object-Based Approach for the Multiscale Image Segmentation of Forest Scenes.” International Journal of Applied Earth Observation and Geoinformation 7 (4): 339–359. doi:10.1016/j.jag.2005.06.005.
- He, R. J., and P. A. Narayana. 2002. “Global Optimization of Mutual Information: Application to Three-Dimensional Retrospective Registration of Magnetic Resonance Images.” Computerized Medical Imaging and Graphics 26 (4): 277–292. doi:10.1016/S0895-6111(02)00019-8.
- Hirschmugl, M., M. Ofner, J. Raggam, and M. Schardt. 2007. “Single Tree Detection in Very High Resolution Remote Sensing Data.” Remote Sensing of Environment 110 (4): 533–544. doi:10.1016/j.rse.2007.02.029.
- Hosseinjani, M., and M. H. Tangestani. 2011. “Mapping Alteration Minerals Using Sub-Pixel Unmixing of ASTER Data in the Sarduiyeh Area, SE Kerman, Iran.” International Journal of Digital Earth 4 (6): 487–504. doi:10.1080/17538947.2010.550937.
- Kanka, M., R. Riesenberg, and H. J. Kreuzer. 2009. “Reconstruction of High-Resolution Holographic Microscopic Images.” Optics Letters 34 (8): 1162–1164. doi:10.1364/OL.34.001162.
- Katoh, M., and F. A. Gougeon. 2012. “Improving the Precision of Tree Counting by Combining Tree Detection with Crown Delineation and Classification on Homogeneity Guided Smoothed High Resolution (50 cm) Multispectral Airborne Digital Data.” Remote Sensing 4 (12): 1411–1424. doi:10.3390/rs4051411.
- Ke, Y. H., and L. J. Quackenbush. 2011. “A Review of Methods for Automatic Individual Tree-Crown Detection and Delineation from Passive Remote Sensing.” International Journal of Remote Sensing 32 (17): 4725–4747. doi:10.1080/01431161.2010.494184.
- Kerroum, M. A., A. Hammouch, and D. Aboutajdine. 2010. “Textural Feature Selection by Joint Mutual Information Based on Gaussian Mixture Model for Multispectral Image Classification.” Pattern Recognition Letters 31 (10): 1168–1174. doi:10.1016/j.patrec.2009.11.010.
- Kraskov, A., H. Stögbauer, and P. Grassberger. 2004. “Estimating Mutual Information.” Physical Review E 69 (6): 066138. doi:10.1103/PhysRevE.69.066138.
- Leckie, D., C. Burnett, T. Nelson, C. Jay, N. Walsworth, F. Gougeon, and E. Cloney. 1999. “Forest Parameter Extraction through Computer-Based Analysis of High Resolution Imagery.” In Proceeding of the Fourth International Airborne Remote Sensing Conference and Exhibition/21st Canadian Symposium on Remote Sensing, 21–24. Ottawa, Canada. Ann Arbor, MI: Canadian Forest Service, ERIM International.
- Li, G. Y., Z. H. Chen, A. X. Liu, M. J. Sun, and S. D. Ying. 2002. “Classification System on Wetland Vegetation in Zhejiang Province and Main Vegetation Types and Their Distribution Characteristics.” Journal of Zhejiang Forestry College 19 (4): 356–362.
- Lin, H., M. Chen, and G. N. Lu. 2013. “Virtual Geographic Environment: A Workspace for Computer-Aided Geographic Experiments.” Annals of the Association of American Geographers 103 (3): 465–482. doi:10.1080/00045608.2012.689234.
- Liu, Z., M. E. Pierce, G. C. Fox, and N. Devadasan. 2007. “Implementing a Caching and Tiling Map Server: A Web 2.0 Case Study.” In Proceedings of the 2007 International Symposium on Collaborative Technologies and Systems (CTS 2007), 247–256. Orlando, FL: IEEE Computer Society.
- Long, X. X., H. D. Li, W. Fan, Q. S. Xu, and Y. Z. Liang. 2013. “A Model Population Analysis Method for Variable Selection Based on Mutual Information.” Chemometrics and Intelligent Laboratory Systems 121 (5): 75–81. doi:10.1016/j.chemolab.2012.12.004.
- Mackay, N. 2009. A Comparison of Three Methods of Ultrasound to Computed Tomography Registration. Kingston, Ontario: Queen's University.
- Maes, F., A. Collignon, D. Vandermeulen, G. Marchal, and P. Suetens. 1997. “Multimodality Image Registration by Maximization of Mutual Information.” IEEE Transactions on Medical Imaging 16 (2): 187–198. doi:10.1109/42.563664.
- Mallinis, G., N. Koutsias, M. Tsakiri-Strati, and M. Karteris. 2008. “Object-Based Classification Using Quickbird Imagery for Delineating Forest Vegetation Polygons in a Mediterranean Test Site.” ISPRS Journal of Photogrammetry and Remote Sensing 63 (2): 237–250. doi:10.1016/j.isprsjprs.2007.08.007.
- May, R. J., H. R. Maier, G. C. Dandy, and T. M. K. G. Fernando. 2008. “Non-Linear Variable Selection for Artificial Neural Networks Using Partial Mutual Information.” Environmental Modelling & Software 23 (10–11): 1312–1326. doi:10.1016/j.envsoft.2008.03.007.
- Peng, H. C., F. H. Long, and C. Ding. 2005. “Feature Selection Based on Mutual Information Criteria of Max-Dependency, Max-Relevance, and Min-Redundancy.” IEEE Transactions on Pattern Analysis and Machine Intelligence 27 (8): 1226–1238. doi:10.1109/TPAMI.2005.159.
- Petridis, S., and S. J. Perantonis. 2004. “On the Relation between Discriminant Analysis and Mutual Information for Supervised Linear Feature Extraction.” Pattern Recognition 37 (5): 857–874. doi:10.1016/j.patcog.2003.12.002.
- Pollock, J. R. 1996. The Automatic Recognition of Individual Trees in Aerial Images of Forests Based on a Synthetic Tree Crown Image Model. Vancouver, BC: The University of British Columbia.
- Pouliot, D. A., D. J. King, F. W. Bell, and D. G. Pitt. 2002. “Automated Tree Crown Detection and Delineation in High-Resolution Digital Camera Imagery of Coniferous Forest Regeneration.” Remote Sensing of Environment 82 (2–3): 322–334. doi:10.1016/S0034-4257(02)00050-0.
- Santoro, F., E. Tarantino, B. Figorito, S. Gualano, and A. M. D'Onghia. 2013. “A Tree Counting Algorithm for Precision Agriculture Tasks.” International Journal of Digital Earth 6 (1): 94–102. doi:10.1080/17538947.2011.642902.
- Sheng, Y. W., P. Gong, and G. S. Biging. 2001. “Model-Based Conifer-Crown Surface Reconstruction from High-Resolution Aerial Images.” Photogrammetric Engineering and Remote Sensing 67 (8): 957–966.
- Song, C. H., M. B. Dickinson, L. H. Su, S. Zhang, and D. Yaussey. 2010. “Estimating Average Tree Crown Size Using Spatial Information from Ikonos and QuickBird Images: Across-Sensor and Across-Site Comparisons.” Remote Sensing of Environment 114 (5): 1099–1107. doi:10.1016/j.rse.2009.12.022.
- Tarp-Johansen, M. J. 2002. “Automatic Stem Mapping in Three Dimensions by Template Matching from Aerial Photographs.” Scandinavian Journal of Forest Research 17 (4): 359–368. doi:10.1080/02827580260138107.
- Van Coillie, F. M. B., L. P. C. Verbeke, and R. R. De Wulf. 2007. “Feature Selection by Genetic Algorithms in Object-Based Classification of IKONOS Imagery for Forest Mapping in Flanders, Belgium.” Remote Sensing of Environment 110 (4): 476–487. doi:10.1016/j.rse.2007.03.020.
- Viola, P., and W. M. Wells III. 1997. “Alignment by Maximization of Mutual Information.” International Journal of Computer Vision 24 (2): 137–154. doi:10.1023/A:1007958904918.
- Walsworth, N. A., and D. J. King. 1999. “Image Modelling of Forest Changes Associated with Acid Mine Drainage. Computers & Geosciences 25 (5): 567–580. doi:10.1016/S0098-3004(98)00169-1.
- Wang, L. 2010. “A Multi-Scale Approach for Delineating Individual Tree Crowns with Very High Resolution Imagery.” Photogrammetric Engineering and Remote Sensing 76 (4): 371–378. doi:10.14358/PERS.76.4.371.
- Wulder, M., K. O. Niemann, and D. G. Goodenough. 2000. “Local Maximum Filtering for the Extraction of Tree Locations and Basal Area from High Spatial Resolution Imagery.” Remote Sensing of Environment 73 (1): 103–114. doi:10.1016/S0034-4257(00)00101-2.
- Xu, Y. L., B. Li, M. X. Xu, and L. C. Zhao. 2012. “A Map Tiling Algorithm and Implementation Based on Mxd Documents.” In International Congress on Image and Signal Processing (CISP 2012), 1167–1170. Chongqing: IEEE. doi:10.1109/CISP.2012.6469894.
- Yang, C. W., W. W. Li, J. B. Xie, and B. Zhou. 2008. “Distributed Geospatial Information Processing: Sharing Distributed Geospatial Resources to Support Digital Earth.” International Journal of Digital Earth 1 (3): 259–278. doi:10.1080/17538940802037954.
- Zhang, L. P., Huang, X., Huang, B., and Li, P. X. 2006. “A Pixel Shape Index Coupled with Spectral Information for Classification of High Spatial Resolution Remotely Sensed Imagery.” IEEE Transactions on Geoscience and Remote Sensing 44 (10): 2950–2961. doi:10.1109/TGRS.2006.876704.
- Zhang, W. H., L. J. Quackenbush, J. H. Im, and L. J. Zhang. 2012. “Indicators for Separating Undesirable and Well-Delineated Tree Crowns in High Spatial Resolution Images.” International Journal of Remote Sensing 33 (17): 5451–5472. doi:10.1080/01431161.2012.663109.