
Abstract
A spatial web portal (SWP) provides a web-based gateway to discover, access, manage, and integrate worldwide geospatial resources through the Internet and has the access characteristics of regional to global interest and spiking. Although various technologies have been adopted to improve SWP performance, enabling high-speed resource access for global users to better support Digital Earth remains challenging because of the computing and communication intensities in the SWP operation and the dynamic distribution of end users. This paper proposes a cloud-enabled framework for high-speed SWP access by leveraging elastic resource pooling, dynamic workload balancing, and global deployment. Experimental results demonstrate that the new SWP framework outperforms the traditional computing infrastructure and better supports users of a global system such as Digital Earth. Reported methodologies and framework can be adopted to support operational geospatial systems, such as monitoring national geographic state and spanning across regional and global geographic extent.
1. Introduction
The advancement of Earth observation (EO) dramatically increases our capability in acquiring geospatial data for building Digital Earth. To store, manage, and publish the explosively growing data, a variety of spatial data infrastructure (SDI; Maguire and Longley Citation2005) components have been developed. However, sharing and access of geospatial resources remain impeded by the isolation of SDIs. To foster interoperation, integration, and access of geospatial resources, different organizations proposed spatial web portals (SWPs), including Geospatial Platforms, Geospatial One-Stop (GOS), NASA SWP, and the Intergovernmental Group on Earth Observation (GEO) Portal (Yang et al. Citation2007; Xu et al. Citation2011; Goodchild, Fu, and Rich Citation2007). An SWP enables the integration and interoperation of geospatial resources through various protocols/Application Programming Interfaces (APIs) such as Open Geospatial Consortium (OGC) Catalogue Service for the Web (CSW; Nebert Citation2007), Web Accessible Folders (WAF Citation2013), and Really Simple Syndication (RSS), and these facilitate geospatial resource access by providing an integrated web interface with a built-in resource search engine.
Driven by the increasing demands of geospatial resources in the past few years, SWPs have matured with the advancement of enabling technologies. However, developing and operating an SWP are challenging due to the following computational intensities and spatiotemporal dynamics: (1) computing intensity due to the complexity of spatiotemporal data structure, query, and processing; (2) concurrent intensity due to millions of end users; (3) communication intensity due to massive interoperations among SWPs and geospatial resources (Gui et al. Citation2013); and (4) spiking workloads from spatiotemporal distribution of globally distributed end users. These challenges preclude SWP from interoperating large-scale geospatial resources and supporting fast resource access for end users to receive responses in seconds (Nah Citation2004). To address these challenges, SWP providers utilize significant computing resources, including cutting-edge hardware and network/computer clusters which are costly and inefficient in a traditional computing fashion (Berl et al. Citation2010).
Cloud computing is an emerging computing paradigm for end users to utilize virtualized computing resource through the Internet and provides unique features such as on-demand resource pooling, rapid elasticity, broad network access, reliability, and economy (Buyya et al. Citation2009; Mell and Grance Citation2011; Vaquero et al. Citation2008; Yang et al. Citation2011a). The ‘pay-as-you-go’ service model releases users from upfront cost for purchasing, hosting, configuring, and managing computing infrastructure, a perennial dream of distributed computing (Armbrust et al. Citation2010). Many organizations (e.g. Adobe Systems and Netflix) migrated their traditional computing facilities to the cloud (Amazon Citation2013; Azure Citation2013) with proven cost and energy efficiencies (Lee and Chen Citation2010; Marston et al. Citation2011). The wide adoption of cloud computing drives the fast growth of both public cloud, such as Amazon Elastic Compute Cloud (EC2) and Windows Azure (Azure), and private cloud, such as Eucalyptus, Cloudstack, and NASA Nebula.
The advancement of cloud computing offers a powerful and affordable computing solution for scientific studies, most notably for geosciences, that require massive, scalable, and reliable computing resources (Yang, Xu, and Nebert Citation2013). Various studies have been carried out to utilize cloud services for geoscience data sharing, data processing, and modeling (Bürger et al. Citation2012; Evangelinos and Hill Citation2008; Guan et al. Citation2013; Huang et al. Citation2013; Lee and Liang Citation2011; Li, Zhang, and Yu Citation2011). As a computing-, concurrent-, and communication-intensive application, SWP requires elastic and broadband network, which can be provided by cloud services. For example, EC2 provides high-performance instance with two quad-core processors, 23-GB memory and 10-Gbps network connection. In addition, cloud services provide a number of functions (e.g. workload balancing, auto-scaling) that could potentially improve SWP performance for global users. Therefore, cloud computing is a potential solution to better support SWP by addressing the challenges.
This paper studies the feasibility of using cloud computing to support SWP. A cloud-based framework for SWP is proposed to integrate several cloud features in support of the SWP operation. More specifically the following are proposed: (1) elastic resource pooling to ensure SWP provision or release of computing resource for efficient handling of complex geo-processing and dynamic user workloads; (2) workload balancing to help SWP accommodate massive concurrent access by scheduling user requests to multiple SWP instances; and (3) global deployment to assist SWP to distribute instances across different geo-locations thereby optimizing communications with end users, third-party SWPs, and geospatial resources.
2. Related research
2.1. Existing SWPs for geospatial resource interoperation and access
Over the past two decades, various SDIs and SWPs have been developed for managing geospatial resource. For example, NASA's Global Change Master Directory (GCMD) (Miled et al. Citation2001) is one of the largest geospatial resource catalogs managing more than 29,000 EO dataset and services for global change and Earth sciences (NASA GCMD Citation2013). The intergovernmental GEO designed a Global Earth Observation System of Systems (GEOSS) Common Infrastructure to facilitate sharing GEOSS data. The GEOSS Clearinghouse (CLH) (Liu et al. Citation2011), Component and Service Registry, and GEO portal are the three components of the GEOSS Common Infrastructure providing resource catalogs, resource registry, and access portal. The US government hosts the GOS as a single portal for federal geospatial resource. Ocean Data Portal (Reed et al. Citation2010) provides marine data hosted by the National Oceanographic Data Centres (NODCs). Finally, the Geospatial Platform (FGDC Citation2013) offers access to geospatial resources.
With increasing geospatial resources and SWPs, the communications of SWPs are increasingly intensified because SWPs frequently communicate with third-party SWPs for resource integration. In addition, more end users are engaged with SWPs and result in a significant growth of concurrent requests. Hence, an optimized SWP framework for communication and concurrent intensity is needed.
2.2. Improving SWP performance
For the high-speed access requirement of SWP, various technologies have been proposed. Wang and Liu (Citation2009) offered a service-oriented framework for parallel and distributed processing. Various workload-balancing mechanisms are proposed for scheduling end user requests for different SWP duplications (Bunt et al. Citation1999; Huang et al. Citation2011). An index mechanism improves query performance by reorganizing data into a structured manner (Güting Citation1994). Specifically, a number of text-based, spatial, and spatiotemporal indices speed up access to geospatial resources (Guttman Citation1984; Beckmann et al. Citation1990; Theodoridis et al. Citation1996; Pfoser, Jensen, and Theodoridis Citation2000). Storage and file models, such as Hadoop Distributed File System (HDFS Citation2013) and Galileo (Malensek, Lee Pallickara, and Pallickara Citation2013), were used to optimize SWP I/O performance (Liu et al. Citation2009). Finally, a cache mechanism pre-fetches frequently queried data into memory to reduce SWP response time (García Martín et al. Citation2013; Li et al. Citation2012).
Many computing resource provision and allocation mechanisms provide on-demand access. For example, Röme (Citation2010) offered a threshold-based computing resource provision mechanism that automatically adds computing nodes to the cloud when the resource utilization rate exceeds a predefined threshold. This threshold-based strategy releases computing resources when the resource utilization is low (Maheshwari, Nanduri, and Varma Citation2012). Chaisiri, Lee, and Niyato (Citation2012) proposed a provision mechanism to minimize the total cost by using stochastic integer programming.
Although some of these approaches have been adopted by SWPs, more effort is required to integrate the approaches into traditional computing infrastructure. In addition, current SWP technologies and framework seldom consider the spatiotemporal distribution of workloads, using traditional computing infrastructure for dynamic computing requirements. Computing resources usually cannot be provisioned on demand for spiking access (Lee and Chen Citation2010).
2.3. Cloud evaluation and adoption for Digital Earth and geosciences
Multiple studies have tested the feasibility of cloud service in supporting scientific research. For example, Kim et al. (Citation2009) discussed several issues impeding the adoption of cloud computing in the sciences, including risk of electric outage, security, and performance overheads. Ostermann et al. (Citation2010) tested the performance of cloud services by analyzing computation, I/O, memory hierarchy, and reliability of five virtual machine (VM) types provided by EC2. And, Iosup et al. (Citation2011) utilized several benchmarks including LMbench (Barham et al. Citation2003), Bonnie (Kowalski Citation2013), and HPCC (Luszczek et al. Citation2006) to evaluate the performance of four commercial cloud services: EC2, GoGrid, ElasticHosts, and Mosso. These evaluations showed that the cloud offers untapped potential for scientific research.
In the geosciences, cloud services support scientific processing and analysis functions. For example, Bürger et al. (Citation2012) proposed a cloud-based hydrologic simulation by utilizing hydrology and visualization packages pre-installed in cloud services. Cloud service has been applied to large-scale spatial data. Lee and Liang (Citation2011) proposed a cloud-based, geo-location data service – Geopot – for location-based mobile applications, and Amazon Simple Storage Service (Garfinkel Citation2007) was used for large spatial data management. Cloud services were also used in geo-science models. Evangelinos and Hill (Citation2008) adopted EC2 to enable computability of coupled atmosphere–ocean climate models. Cost-saving instances can be utilized to execute climate models while the performance is comparable to low-cost cluster systems. Huang et al. (Citation2013) developed a set of methods to leverage a large group of computing resources in minutes to accelerate large-domain dust storm forecasting. Cloud services also enable high-performance data processing for computing and data-intensive applications. Guan et al. (Citation2013) integrated the cloud service to a data-processing framework, providing performance gain for intensive data processing. Li, Zhang, and Yu (Citation2011) proposed a cloud-based framework for intensive floating car data (FCD) processing. The EC2 and cloud techniques (e.g. Chang et al. Citation2008; Dean and Ghemawat Citation2008) address the data intensity problem inside FCD processing. Esri also started to investigate cloud computing for supporting its ArcGIS online and Geoportal products.
These studies offer best practices for utilizing virtualized resource within cloud computing to support Digital Earth and geosciences. However, major benefits of cloud service (e.g. elasticity, workload balancing, and distribution) have not been realized, especially for SWPs. No technical documents and research can be found from Google Scholar, Scopus, or Science Citation Index (SCI) as of April 2014 about how to best leverage cloud computing characteristics to support the global operation of SWPs. This paper fills this literature gap by systematically studying how to best utilize cloud computing for SWPs.
3. Methodologies
3.1. The SWP architecture and workflow
SWP architecture and workflow () illustrates two major functions of integrating widely distributed geospatial resources and supporting user access. First, the SWP Resource Crawler and Monitor communicates with existing geospatial resources and third-party SWPs to do the following: (1) register or update the latest data, metadata, services, and applications; (2) monitor and retrieve real-time service and data quality; and (3) enable remote access for third-party SWPs. Second, end users access the SWP through the following workflow: (1) end users send requests through the SWP web client; (2) requests transferred from the client to the SWP server through global networking; (3) SWP search engine parses requests and (4) queries against the SWP database; (5) SWP search engine organizes (e.g. filtering and ranking) raw query results and (6) transfers results to the SWP client; and (7) SWP client visualizes results for the end users.
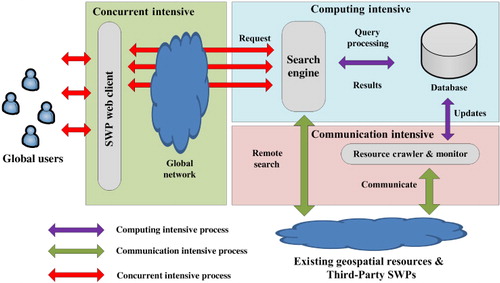
The workflow has the following characteristics:
Computing intensity: data querying, indexing, updating, and converting are time consuming, especially for the fast-growing big data. The complexity of spatiotemporal data structure and spatiotemporal query process increases computing intensity.
Concurrent intensity: popular SWPs receive 10s to 1000s of concurrent user requests. An SWP needs to go through the entire request/response process for each user. Factual workloads usually contain sudden increases of concurrent access or spiking workload (Bodik et al. Citation2010) because some events (e.g. natural hazards, disease spreading, and elections) cause an explosive growth of access to geospatial resource.
Communication intensity: to integrate widely distributed geospatial resources, SWP intensively communicates and monitors massive SDIs, services, and third-party SWPs. The communication and concurrent intensities result in SWP performance degradation, such as slow response, network congestion, and system failure.
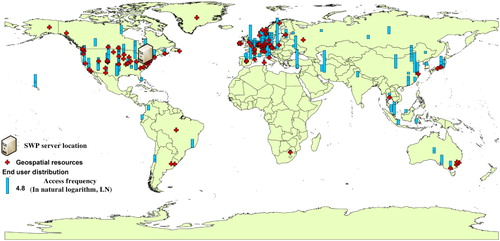
Global Access: while SWP supports user access internationally through the Internet, some users experience slow responses because their requests and responses go across intercontinental network. For example, the distributions of the CLH (Liu et al. Citation2011) end users, geospatial resources, and the system servers are dynamic (). The SWP in the USA may have slow responses to users in Europe and Asia. The SWP and geospatial resource distribution also result in large volumes of data transfer over intercontinent networking. In addition, misleading service performance information may be delivered to users in different regions if services are integrated and monitored from a single location (Yang et al. Citation2011b).
3.2. Cloud-enabled framework
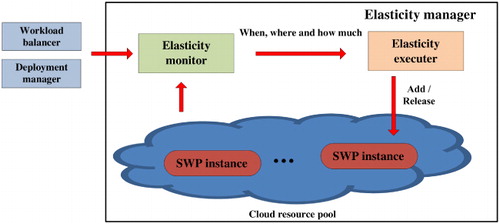
To address these challenges, a cloud-enabled framework to facilitate SWP operation is proposed (). The framework includes three components: (1) cloud workload balancer for managing user access workload; (2) elasticity manager to support automatic computing resource provision; and (3) deployment manager for optimizing SWP utility in a global cloud environment. The three components deploy, auto-scale, and balance the workload for SWP instances hosted in the cloud resource pool. Each component communicates with each other to monitor the latest status of user workload, SWP instance distribution, and resource utilization. Each of these components is discussed in more detail.
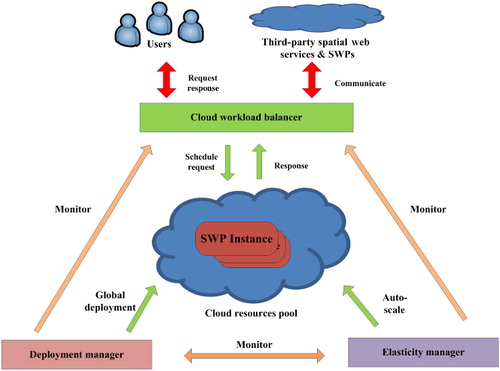
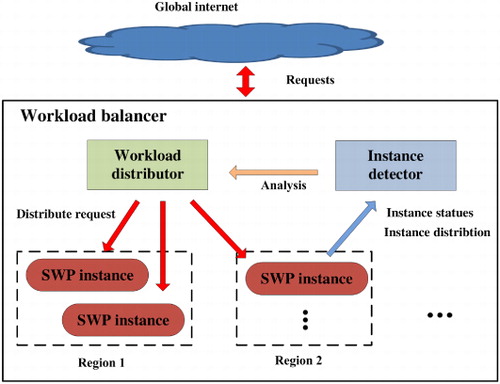
Cloud workload balancer () automatically distributes end user requests to multiple SWP instances to reduce the response time, handle larger number of concurrent requests by utilizing multiple SWP instances, and achieve greater fault tolerance. Within the framework, multiple SWP instances are provisioned from the cloud resource pool supported by elasticity manager, and these instances are distributed in different cloud service regions by the deployment manager. These SWP instances are configured to provide a single SWP access end point (domain name). The instance detector periodically detects SWP instance status (e.g. CPU, memory and disk utilization rate, instance location, network traffic, and mean response time). The workload distributor forwards end user requests to different SWP instances based on location and status of current instances. Requests are forwarded to an SWP instance with less workload and an instance proximal to the end users. The pseudocode for the load balancing is based on which starts with the initialization of SWP instances in different cloud regions (LB2). For every user request, the workload distributor calculates the network distance from the request location to every existing cloud region (LB3, LB4, and LB5) and forwards the request to the region with shortest distance (LB6). Every instance in this targeted cloud region is checked by the instance detector. If the instance reaches a healthy state (Amazon Health Check Citation2013), the current instance workload is recorded (LB9), and the request is forwarded to the instance with least workload (LB12). Otherwise, the instance is isolated from the load-balancing process until its health state is restored (LB11).
Algorithm 1. SWP load balancing in the cloud.
The elasticity manager () enables the automatic provision of computing, storage, and network resources in two directions: scaling SWP instance configurations (e.g. CPU core number and memory size) on-the-fly to meet the computing demand and scaling to increase or decrease the number of SWP instances for the cloud workload balancer. The elasticity executor provisions and releases cloud resource based on predefined auto-scaling rules. To determine when, where, and how much computing resource needs to be provisioned/released, the elasticity monitor communicates with the workload balancer and deployment manager to analyze the spatiotemporal distributions of users and cloud resources. The pseudocode for a threshold-based SWP auto-scaling algorithm () starts at the beginning of every monitoring time interval (e.g. every minute) (AS2) and runs until the auto-scaling function terminates (AS11). For every SWP instance (AS4) in all different cloud regions (AS3), the elasticity monitor collects information of the instance such as CPU, RAM and network utilization, user request number, and response time. If a scaling-up threshold is reached (e.g. number of request > 100 and the average response time > 6 seconds for the last three time intervals) and the number of current SWP instance less than the maximum instance number (AS6), the elasticity executor scales up an instance in the current cloud region (AS7). If a scaling-down threshold is reached (e.g. CPU utilization < 30% for the last four time intervals) and the number of current SWP instance greater than the minimum instance number (AS8), the elasticity executor scales down an instance in the current cloud region (AS9). The algorithm moves to the next time interval (AS13) until the auto-scaling function terminates (AS11).
Algorithm 2. Threshold-based SWP auto-scaling in the cloud.
Deployment manager optimizes SWP instance distribution by performing global configurations. Most cloud service providers have multiple data centers (cloud regions) across the world. By utilizing this cloud service feature as well as leveraging spatiotemporal principles (Yang et al. Citation2011b), the deployment manager helps the SWP gain location advantage by collocating SWP instances, end users, and geospatial resources. The deployment manager also enables SWP to provide location-specific (Yang et al. Citation2011b) service performance information to global users by monitoring performance from different geo-locations. The pseudocode for global deployment algorithm () starts at the beginning of every monitoring time interval (e.g. daily) and runs until the global deployment function terminates (GD13). The deployment manager calculates the distance (physical and virtual) from end users to each cloud region. If a cloud region threshold is reached (e.g. >800 users at >4500 km from the closest cloud region) and a closer cloud region is available, the deployment manager adds a new cloud region (GD7). An initial number (e.g. five) of SWP instance deploys to the new cloud region (GD8). If a dropping cloud region threshold is reached (e.g. number of users in the current region <500), the deployment manager terminates all SWP instances in this region (GD10) and drop this cloud region (GD11). moves to the next time interval (GD15) until the auto-scaling function is terminated (GD13).
Algorithm 3. Threshold-based SWP global deployment in the cloud.
4. Experiments and results
Four experiments are conducted to evaluate the performance of the cloud-enabled framework as follows: (1) comparison of cloud services and traditional servers to test the readiness of virtualized computing resources; (2) computing resource pooling and workload balancing to test the performance of cloud-enabled SWP in handling computing and concurrent intensity; (3) the elastic provision of computing resources for SWP to test how cloud service helps SWP handle dynamic workloads; and (4) cloud-enabled deployment of SWP to test the performance of SWP in supporting global users.
4.1. Experiment application and environment
The NASA SWP (http://wms.gmu.edu/SWPortalBing) is a web-based spatial gateway for discovering, aggregating, managing, and presenting geospatial resources (Xu et al. Citation2011). To provide fast access, several performance-improving technologies (Section 2.2) were adopted. For example, an Apache Lucene (Citation2013) index and a spatial index were used by Liu et al. (Citation2011) for fast data retrieval. A server-side cache was implemented and managed by MySQL (Citation2013). A traditional computing cluster was utilized for application hosting. To further improve the SWP performance, the cloud-enabled framework was adopted by implementing elastic resource pooling, workload balancing, and global deploying functions provided by EC2, Azure, and NASA Nebula.
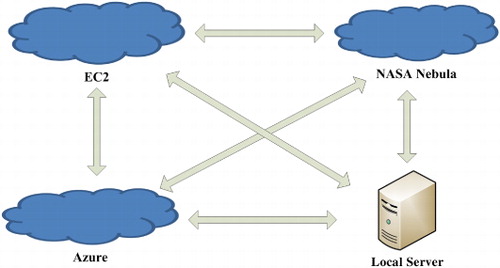
The experiment was conducted on three cloud services and a traditional server located at different geographic regions with different computing and network configurations. The geographic locations of the experimental facilities where EC2 was located were Reston Virginia, Azure (Chicago, Illinois), and NASA Nebula (Ames, California; ). The traditional server was hosted at Fairfax, Virginia. Three cloud services and the traditional server were connected via the National LamdaRail. The global deployment experiment was supported by four data centers in three continents (North America, Europe, and Asia) hosted by Azure. In order to minimize the impact of different hardware configurations, VMs were chosen with the closest hardware configurations to the traditional server (two CPU cores and 8 GB memory) based on available VM types ().
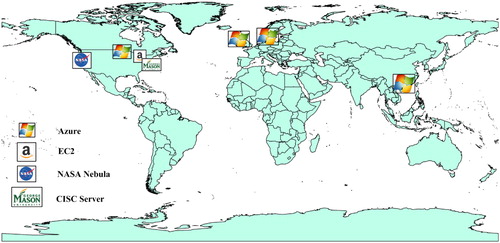
Table 1. Configurations of VMs and the traditional server.
4.2. SWP performance across different cloud services
This set of experiments compares the performance of three cloud services to a traditional server in supporting SWP (). The SWP instances and clients were installed and configured on VMs using different cloud services and the traditional server. Different numbers of concurrent spatial query requests were sent from clients to SWP instances in different cloud services ( –). To reduce the impact of noise in dynamic network environment, the following sets of experiments are repeated 50 times to calculate the mean performance (e.g. mean response time).
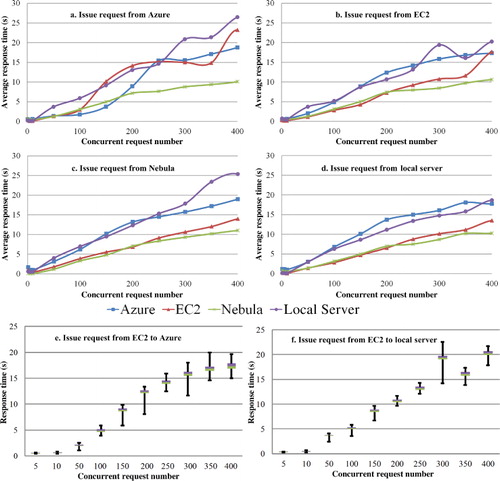
In order to determine either to use the distributions of response time or to use the average response time for performance measurements, two boxplot charts are used to present the results of EC2 to Azure () and the results of EC2 to local server (). In general, response times are very stable, although some request instances are far from mean values (maximum and minimum). The upper quartile and lower quartile are very close to the median and mean values, and most instances (>86%) are distributed within the mean ± standard deviations (SD). Therefore, we use average value to represent the general performance of SWP in the following experiments for best presenting the performance difference.
The results suggest three patterns. First, better hardware and network configuration commonly yield a shorter response time. The NASA Nebula provided the best performance because it had the best computing configuration and a stable network environment (private cloud). The EC2 had the second best performance, followed by Azure, and the traditional server. Second, cloud services and the traditional server provide similar performances in supporting SWP. Although the results were affected by different hardware configurations, no significant overheads were found from the virtualized computing resources in supporting SWP. Third the distribution of end user requests and cloud services impacts SWP performance: closer distance (geographic and network between users and services) results in a shorter response time. For example, it took ∼24 seconds for an EC2-hosted SWP to respond to 400 concurrent requests (requested from Azure), whereas only 18 seconds if requests were issued from EC2. In addition, passing request/response across long network distances usually results in a performance fluctuation because of the dynamic network environment. For example, fluctuations are found by issuing requests from three cloud services to traditional server while fluctuation is dampened if requests are issued from the traditional server to itself.
4.3. Resource pooling and load balancing
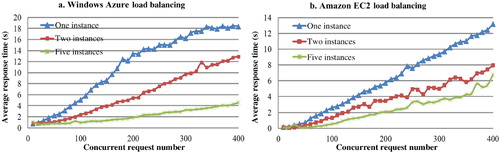
The following experiments investigate how the cloud-enabled SWP handles computing and concurrent intensity by leveraging large computing resource pool and balancing workload. Different numbers of SWP instances were launched from cloud resource pool (1, 2, and 5 instances) to function as an SWP URL end point (supported by cloud workload balancer) for responding to different numbers of concurrent requests.
From the results, five patterns demonstrate the performance of load balancing-enabled SWP end point. First, the mean response time of SWP was reduced by adopting resource pooling and load balancing with both Azure () and EC2 (). Second, on average, the SWP achieved better performance with more computing resource (e.g. more SWP instances) for both Azure and EC2. Third, the mean response time was not consistently proportional to the amount of cloud computing resource. For example, it took ∼18 seconds for an Azure-hosted SWP to respond to 400 concurrent requests with one instance (), while the response time was 13 seconds when using two SWP instances. Thus, increasing the instance number may not always improve the performance. Four, the EC2 performed better than Azure with either a single instance or two instances for workload balancing. However, Azure performed better when using a larger number of load-balancing instances. For example, when SWP instance number was increased to five, the mean response time for an Azure-hosted SWP was ∼2.4 seconds with 400 concurrent requests, while the mean response time for EC2 was ∼6.5 seconds. Five, the mean response time increased 120% when the workload in each SWP instance increased 100%, but this relationship varied among cloud services. These results provide general guidance for SWP owners for choosing proper load-balancing configurations (e.g. the number of instances and different cloud services) to support fast user response.
4.4. Handling dynamic workload
These experiments investigate how cloud-enabled SWP handles dynamic workloads. The first experiment was similar to that in Section 4.3 except that this experiment implemented an auto-scaling rule as follows: (1) when the average response time > 6 seconds, the SWP elasticity manager automatically provisions a new SWP instance; and (2) to constrain costs, a maximum number of five instances to be provisioned by elasticity manager was set. The second experiment simulated a spiking access workload from 10 to 400 concurrent accesses. The auto-scaling rule for spiking access is as follows: (1) when the average response time > 6 seconds, two SWP instances are provisioned; (2) when the average response time is < 3 seconds, two SWP instances are released; and (3) the minimum and maximum number of SWP instance is 1 and 5, respectively.
The performance of auto-scaling and workload balancing-enabled SWP in handling increasing workload is shown in and demonstrated the following results. First, the elasticity manager and auto-scaling mechanism resulted in the SWP invoking more computing capabilities to the increasing workload. At the beginning (), only one SWP instance was utilized for concurrent access from 1 to 210 because SWP responded to the end users within 6 seconds. When the concurrent access number was 230, the elasticity manager utilized the second SWP instance because the response time exceeded the predefined threshold. Two SWP instances in the cloud workload balancer worked together to balance the workload, and they reduced the response time to ∼5 seconds. Based on similar mechanism, the elasticity manager utilized the third, fourth, and fifth SWP instance when the concurrent access number reached 280, 330, and 380, respectively. Second, auto-scaling enabled the SWP to achieve a balance between handling computing intensity and saving cloud service cost. With 400 concurrent requests, the response time of auto-scaling was reduced to 7 seconds compared with one-instance SWP of 14 seconds. In addition, the auto-scaling-enabled SWP was more cost-efficient compared to a load balancing-enabled SWP with redundant computing resource (five instances) even with a lighter workload. Because of the efficiency of the auto-scaling mechanism, auto-scaling-enabled SWPs handle well the dynamic or spiking access in a region. Conversely, load balancing better supports routine requests from different geo-locations across the world.
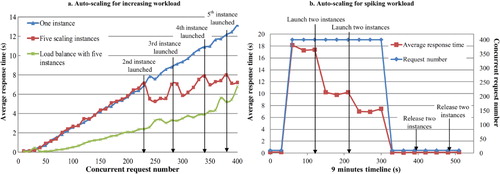
The performance of auto-scaling-enabled SWP in handling spiking access in a 9-minute timeline is shown in , and four general patterns are observed. When the concurrent request number increases from 10 to 400, the SWP average response time rose from 0.2 to 18 seconds, triggering a scaling-up event. Second, after the scaling-up event, an additional 60–90 seconds was required for two more SWP instances to be launched for handling the spiking workload, and the mean response time was reduced to 10 seconds. Third, another 60–90 seconds passed for the launch of the fourth and fifth instances, and the mean response time was reduced to 7 seconds. Finally, when the concurrent request fell to 10, the time to release every two instances was about 60 seconds.
4.5. Global access
These experiments investigated the performance of cloud-enabled SWP in supporting global user access by adopting global deployment with the following workflow:
Based on the spatial distributions of end users, launching four SWP instances in three continents with high access frequency (1, 2, and 1 from North America, Europe, and Asia, respectively).
To simulate global user access, load performance test software (Apache JMeter) was installed on VMs in different continents and concurrent spatial query requests sent to SWPs in different continents.
To monitor geospatial resource quality, VMs in different continents continuously communicated and recorded performance information from 7 popular geospatial web services located in different continents.
The repeat rules were used to calculate the mean response time and resource quality.
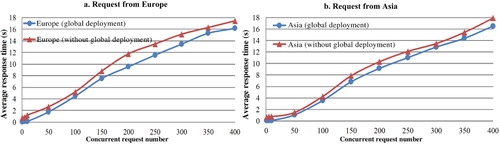
With global deployment, the SWP achieved 0.7–2.2 second performance improvements for European users and 0.5–2.1 second improvements for Asian users with only one SWP instance (). This improvement was attributed to the optimized distribution of SWP server. For example, an SWP instance was deployed on Azure's North Europe data center to accommodate European user requests. However, these requests were forwarded to the SWP server in the USA without using the global deployment mechanism. In addition, global deployment-enabled SWP achieved further performance improvement because more instances were utilized with the workload balancing or auto-scaling mechanism.
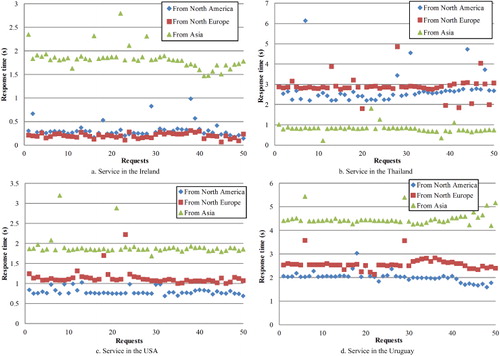
The response time of four popular web map service (WMS) monitored by the cloud service from the North America, North Europe, and Asia is illustrated in . The geospatial service performance is a function of distance (physical and network) between the clients and service providers. For example, the WMS in Ireland () provided shorter response time to European user (about 0.2 seconds) than that to users from other continents (e.g. about 1.95 seconds from Asia). In addition, this WMS had better user satisfaction (Kettinger and Lee Citation1994) and service reliability (Maximilien and Singh Citation2004) for European users. It provided 100% and 88% user satisfaction (percentage of responses within 0.3 second) for European and North American users but 0% satisfaction for those from Asia. The reliability (percentage of non-error access) of this WMS for North European, North America, and Asian users was 99%, 97%, and 90.5%, respectively. The location-specific service performance information can be captured by adopting a global monitor, which is integrated with the SWP global deployment.
5. Conclusion
This paper proposes a cloud-based framework for SWP to address several SWP operational challenges and does so by leveraging cloud computing. Four SWP operation challenges are highlighted: (1) computing intensity for data querying and updating; (2) concurrent intensity for responding to massive requests; (3) communication intensity for interoperating and integrating explosively growing geospatial resources; and (4) spatiotemporal distribution of end users and the dynamic, globally distributed, and spiking workload. A cloud-based framework for SWP is proposed to address the challenges.
5.1. Key features for addressing SWP challenges
The key features in the cloud-based framework for addressing SWP challenges are summarized in :
Table 2. Key cloud features to address the SWP challenges.
5.1.1. Computing intensity handling
To better handle computing intensity, the elastic resource-pooling feature was implemented by the elasticity manager for the SWP to provision or release sufficient computing resources for intensive processing (Section 4.3) and to adapt the computing resources to the dynamic workloads (e.g. spiking workload) (Section 4.4). Experimental results (Section 4.2) demonstrate that the three cloud services (EC2, Azure, NASA Nebula) introduce similar and reasonably low virtualization overheads.
5.1.2. Concurrent intensity handling
To address massive concurrent user accesses, the elastic resource-pooling feature initially provisioned a number of SWP instances. Subsequently, massive concurrent workloads were dynamically scheduled to different SWP instances by the cloud workload balancer. The cloud-enabled workload-balancing mechanism significantly reduces the response time up to 16 seconds performance gain for 400 concurrent requests by using five SWP instances for workload balancing (Section 4.3).
5.1.3. Communication intensity handling
To address the communication intensity, the global deployment was used to reduce the communication distance between SWP and geospatial resources. Experimental results (Section 4.5) show that shorter distances achieve faster interoperations.
5.1.4. End user spatiotemporal distribution
The cloud-enabled global deployment approach helps SWP reduce physical and network distances between end users and SWP instances, so better system performance is achieved. Experimental results (Section 4.5) show that SWPs achieve up to 2.2 seconds performance gain for Asian and European users with one SWP instance.
These intensity challenges will increase with the growing of Digital Earth operational systems for addressing global challenges by leveraging global geospatial resources. Therefore, the methodologies, experiments, and results can serve as references to support better Digital Earth system global operations.
5.2. Future research
The proposed cloud-based SWP framework mainly focuses on system performance in responding to global users. To further improve the operation of the SWP, further research is desired from at least the following aspects:
5.2.1. Cost model
As a cloud-based system, the new SWP framework achieves better performance for the system operation. With the increasing number of cloud services and the diversity of in-cloud SWP configurations, it is challenging for SWP administrators to choose the ‘right’ cloud service and configuration. A cost model (Li et al. Citation2009; Zhang, Zhu, and Boutaba Citation2011) is needed to provide recommendations for choosing cloud services and cloud configurations (e.g. cloud instance type, instance number, and auto-scaling rules) based on the system requirement and to estimate and optimize the cost based on different cloud services and configurations.
5.2.2. Service performance measurement
The cloud-based SWP framework fostered a global-level service performance-monitoring approach by leveraging widely distributed cloud services. With the implementation of such a monitoring system, end users receive dynamic service performance according to user location and access time. However, a service quality measurement and composition model (Cruz, Monteiro, and Santos Citation2012; Wu et al. Citation2011) is missing to evaluate service based on their spatiotemporal distribution.
5.2.3. Spatiotemporal indexing and user behavior patterns
The spatiotemporal distribution of end users not only results in geographically distributed and spiking workloads but also contributes to various spatiotemporal user behavior patterns that can be used to optimize the SWP. Better spatiotemporal indexing (Theodoridis et al. Citation1996; Pfoser, Jensen, and Theodoridis Citation2000), caching (García Martín et al. Citation2013; Li et al. Citation2012), and workload balancing (Bunt et al. Citation1999; Huang et al. Citation2011) can be designed by understanding the users' demand for geospatial resource at different locations and at different times.
Acknowledgments
We would like to thank the anonymous reviewers and editor for providing insightful comments to improve the paper. All research and writing are performed at George Mason University. Dr George Taylor helped proofread a previous version of the paper.
Additional information
Funding
References
- Amazon. 2013. “Amazon EC2 Case Studies.” Amazon. Accessed April 3. http://aws.amazon.com/solutions/case-studies/
- Amazon Health Check. 2013. “Amazon Health Check.” Amazon. Accessed April 3. http://docs.aws.amazon.com/AutoScaling/latest/DeveloperGuide/as-add-elb-healthcheck.htm
- Armbrust, M., A. Fox, R. Griffith, A. D. Joseph, R. Katz, A. Konwinski, G. Lee, et al. 2010. “A View of Cloud Computing.” Communications of the ACM 53 (4): 50–58. 10.1145/1721654.1721672.
- Azure. 2013. “Windows Azure Case Studies.” Microsoft. Accessed April 3. http://www.windowsazure.com/en-us/overview/case-studies/
- Barham, P., B. Dragovic, K. Fraser, S. Hand, T. Harris, A. Ho, and A. Warfield. 2003. “Xen and the Art of Virtualization.” ACM SIGOPS Operating Systems Review 37 (5): 164–177. 10.1145/1165389.945462.
- Beckmann, N., H.-P. Kriegel, R. Schneider, and B. Seeger. 1990. “The R*-Tree: An Efficient and Robust Access Method for Points and Rectangles.” In Proceedings of the ACM SIGMOD International Conference on Management of Data, Atlantic City, NJ, New York: ACM. 322–331.
- Berl, A., E. Gelenbe, M. Di Girolamo, G. Giuliani, H. De Meer, M. Q. Dang, and K. Pentikousis. 2010. “Energy-efficient Cloud Computing.” The Computer Journal 53 (7): 1045–1051. 10.1093/comjnl/bxp080.
- Bodik, P., A. Fox, M. J. Franklin, M. I. Jordan, and D. A. Patterson. 2010. “Characterizing, Modeling, and Generating Workload Spikes for Stateful Services.” In Proceedings of the 1st ACM Symposium on Cloud Computing, Indianapolis, IN, New York: ACM, 241–252.
- Bunt, R. B., D. L. Eager, G. M. Oster, and C. L. Williamson. 1999. “Achieving Load Balance and Effective Caching in Clustered Web Servers.” In Proceedings of the 4th International Web Caching Work, San Diego, CA, IEEE, 159–169.
- Bürger, C. M., S. Kollet, J. Schumacher, and D. Bösel. 2012. “Introduction of a Web Service for Cloud Computing with the Integrated Hydrologic Simulation Platform ParFlow.” Computers & Geosciences 48 (1): 334–336. 10.1016/j.cageo.2012.01.007.
- Buyya, R., C. S. Yeo, S. Venugopal, J. Broberg, and I. Brandic. 2009. “Cloud Computing and Emerging IT Platforms: Vision, Hype, and Reality for Delivering Computing as the 5th Utility.” Future Generation Computer Systems 25 (6): 599–616. 10.1016/j.future.2008.12.001.
- Chaisiri, S., B.-S. Lee, and D. Niyato. 2012. “Optimization of Resource Provisioning Cost in Cloud Computing.” IEEE Transactions on Services Computing 5 (2): 164–177. 10.1109/TSC.2011.7.
- Chang, F., J. Dean, S. Ghemawat, W. C. Hsieh, D. A. Wallach, M. Burrows, T. Chandra, A. Fikes, and R. E. Gruber. 2008. “Bigtable: A Distributed Storage System for Structured Data.” ACM Transactions on Computer Systems (TOCS) 26 (2): 4. 10.1145/1365815.1365816.
- Cruz, S. A., A. Monteiro, and R. Santos. 2012. “Automated Geospatial Web Services Composition Based on Geodata Quality Requirements.” Computers & Geosciences 47 (1): 60–74. 10.1016/j.cageo.2011.11.020.
- Dean, J., and S. Ghemawat. 2008. “MapReduce: Simplified Data Processing on Large Clusters.” Communications of the ACM 51 (1): 107–113. 10.1145/1327452.1327492.
- Evangelinos, Constantinos, and C. Hill. 2008. “Cloud Computing for parallel Scientific HPC Applications: Feasibility of Running Coupled Atmosphere-ocean Climate Models on Amazon's EC2.” Ratio 2 (40): 2–34.
- FGDC. 2013. “Geospatial Platform.” Accessed April 3. http://www.geoplatform.gov/.
- García Martín, R., J. P. de Castro Fernández, E. Verdú Pérez, M. J. Verdú Pérez, and L. M. Regueras Santos. 2013. “An OLS Regression Model for Context-aware Tile Prefetching in a Web Map Cache.” International Journal of Geographical Information Science 27 (3): 614–632. 10.1080/13658816.2012.721555.
- Garfinkel, S. 2007. An Evaluation of Amazons Grid Computing Services: EC2, S3 and SQS. Harvard University, Technical Report TR-08-07, Cambridge, MA.
- Goodchild, M. F., P. Fu, and P. Rich. 2007. “Sharing Geographic Information: An Assessment of the Geospatial One-Stop.” Annals of the Association of American Geographers 97 (2): 250–266. 10.1111/j.1467-8306.2007.00534.x.
- Guan, H., J. Li, L. Zhong, Y. Yongtao, and M. Chapman. 2013. “Process Virtualization of Large-scale Lidar Data in a Cloud Computing Environment.” Computers & Geosciences 60 (1): 109–116. 10.1016/j.cageo.2013.07.013.
- Gui, Z., C. Yang, J. Xia, K. Liu, C. Xu, J. Li, and P. Lostritto. 2013. “A Performance, Semantic and Service Quality-Enhanced Distributed Search Engine for Improving Geospatial Resource Discovery.” International Journal of Geographical Information Science 27 (6): 1109–1132. 10.1080/13658816.2012.739692.
- Güting, R. H. 1994. “An Introduction to Spatial Database Systems.” The VLDB Journal 3 (4): 357–399. 10.1007/BF01231602.
- Guttman, A. 1984. “R-Trees: A Dynamic Index Structure for Spatial Searching.” In Proceedings of the ACM SIGMOD International Conference on Management of Data, Boston, MA, New York: ACM, 47–57.
- HDFS. 2013. “Hadoop HDFS.” Apache. Accessed April 3. http://hadoop.apache.org/docs/stable/hdfs_design.html
- Huang, H., Y. Li, G. Gartner, and Y. Wang. 2011. “An SVG-based Method to Support Spatial Analysis in XML/GML/SVG-Based WebGIS.” International Journal of Geographical Information Science 25 (10): 1561–1574. 10.1080/13658816.2010.532133.
- Huang, Q., C. Yang, K. Benedict, S. Chen, A. Rezgui, and J. Xie. 2013. “Utilize Cloud Computing to Support Dust Storm Forecasting.” International Journal of Digital Earth 6 (4): 1–18. 10.1080/17538947.2012.749949.
- Iosup, A., S. Ostermann, M. N. Yigitbasi, R. Prodan, T. Fahringer, and D. H. J. Epema. 2011. “Performance Analysis of Cloud Computing Services for Many-tasks Scientific Computing.” IEEE Transactions on Parallel and Distributed Systems 22 (6): 931–945. 10.1109/TPDS.2011.66.
- Kettinger, W. J., and C. C. Lee. 1994. “Perceived Service Quality and User Satisfaction with the Information Services Function.” Decision Sciences 25 (5–6): 737–766. 10.1111/j.1540-5915.1994.tb01868.x.
- Kim, W., S. D. Kim, E. Lee, and S. Lee. 2009. “Adoption Issues for Cloud Computing.” In Proceedings of the 7th International Conference on Advances in Mobile Computing and Multimedia, Kuala Lumpur. Springer-Verlag, 2–5.
- Kowalski, A. 2013. “Bonnie File System Benchmarks.” Jefferson Lab Report. Accessed April 3. http://cc.jlab.org/docs/scicomp/benchmark/bonnie.html
- Lee, D., and S. H. Liang. 2011. “Geopot: A Cloud-based Geolocation Data Service for Mobile Applications.” International Journal of Geographical Information Science 25 (8): 1283–1301. 10.1080/13658816.2011.558017.
- Lee, Y. T., and K. T. Chen. 2010. “Is Server Consolidation Beneficial to MMORPG? A Case Study of World of Warcraft.” In Proceedings of 3rd International Conference on Cloud Computing, Miami, FL. IEEE, 435–442.
- Li, Q., T. Zhang, and Y. Yu. 2011. “Using Cloud Computing to Process Intensive Floating Car Data for Urban Traffic Surveillance.” International Journal of Geographical Information Science 25 (8): 1303–1322. 10.1080/13658816.2011.577746.
- Li, R., R. Guo, Z. Xu, and W. Feng. 2012. “A Prefetching Model Based on Access Popularity for Geospatial Data in a Cluster-Based Caching System.” International Journal of Geographical Information Science 26 (10): 1831–1844. 10.1080/13658816.2012.659184.
- Li, X., Y. Li, T. Liu, J. Qiu, and F. Wang. 2009. “The Method and Tool of Cost Analysis for Cloud Computing.” In Proceedings of International Conference on Cloud Computing, Bangalore. IEEE, 93–100.
- Liu, K., C. Yang, W. Li, Z. Li, H. Wu, A. Rezgui, and J. Xia. 2011. “The GEOSS Clearinghouse High Performance Search Engine.” In Proceedings of 19th International Conference on Geoinformatics, Shanghai. IEEE, 1–4.
- Liu, X., J. Han, Y. Zhong, C. Han, and X. He. 2009. “Implementing WebGIS on Hadoop: A Case Study of Improving Small File I/O Performance on HDFS.” In Proceedings of Cluster Computing and Workshops, New Orleans, LA. IEEE, 1–8.
- Lucene. 2013. “Lucene.” Accessed April 3. http://lucene.apache.org/core
- Luszczek, P. R., D. H. Bailey, J. J. Dongarra, J. Kepner, R. F. Lucas, R. Rabenseifner, and D. Takahashi. 2006. “The HPC Challenge (HPCC) Benchmark Suite.” In Proceedings of the ACM/IEEE Conference on Supercomputing, Tampa, FL. IEEE, 213–214.
- Maguire, D. J., and P. A. Longley. 2005. “The Emergence of Geoportals and Their Role in Spatial Data Infrastructures.” Computers, Environment and Urban Systems 29 (1): 3–14. 10.1016/j.compenvurbsys.2004.05.012.
- Maheshwari, N., R. Nanduri, and V. Varma. 2012. “Dynamic Energy Efficient Data Placement and Cluster Reconfiguration Algorithm for MapReduce Framework.” Future Generation Computer Systems 28 (1): 119–127. 10.1016/j.future.2011.07.001.
- Malensek, M., S. Lee Pallickara, and S. Pallickara. 2013. “Exploiting Geospatial and Chronological Characteristics in Data Streams to Enable Efficient Storage and Retrievals.” Future Generation Computer Systems 29 (4): 1049–1061. 10.1016/j.future.2012.05.024.
- Marston, S., Z. Li, S. Bandyopadhyay, J. Zhang, and A. Ghalsasi. 2011. “Cloud Computing - The Business Perspective.” Decision Support Systems 51 (1): 176–189. 10.1016/j.dss.2010.12.006.
- Maximilien, E. M., and M. P. Singh. 2004. “A Framework and Ontology for Dynamic Web Services Selection.” IEEE Internet Computing 8 (5): 84–93. 10.1109/MIC.2004.27.
- Mell, P., and T. Grance. 2011. “The NIST Definition of Cloud Computing.” NIST Special Publication 800 (145): 7–8.
- Miled, Z. B., S. Sikkupparbathyam, O. Bukhres, K. Nagendra, E. Lynch, M. Areal, L. Olsen, et al. 2001. “Global Change Master Directory: Object-Oriented Active Asynchronous Transaction Management in a Federated Environment Using Data Agents.” In Proceedings of the ACM Symposium on Applied Computing, 207–214.
- MySQL. 2013. “MySQL.” Accessed April 3. http://www.mysql.com
- Nah, F. F. H. 2004. “A Study on Tolerable Waiting Time: How Long Are Web Users Willing to Wait?” Behaviour & Information Technology 23 (3): 153–163. 10.1080/01449290410001669914.
- NASA GCMD. 2013. “Global Change Master Directory.” NASA. Accessed April 3. http://gcmd.nasa.gov/learn/index.html
- Nebert, D. 2007. “OpenGIS Catalogue Services Specification, Version 2.0.2, OGC 07-006r1.” OGC. Accessed April 3. https://portal.opengeospatial.org/modules/admin/license_agreement.php?SuppressHeaders=0&access_license_id=3&target=http://portal.opengeospatial.org/files/%3fartifact_id=20555
- Ostermann, S., Iosup, A., Yigitbasi, N., Prodan, R., Fahringer, T., and Epema, D. 2010. “A Performance Analysis of EC2 Cloud Computing Services for Scientific Computing.” In ICST International Conference on Cloud Computing, 115–131.
- Pfoser, D., C. S. Jensen, and Y. Theodoridis. 2000. “Novel Approaches to the Indexing of Moving Object Trajectories.” In Proceedings of the 26th International Conference on Very Large Data Bases, Cairo. New York: ACM, 395–406.
- Reed, G., R. Keeley, S. Belov, and N. Mikhailov. 2010. “Ocean Data Portal: A Standards Approach to Data Access and Dissemination.” In Proceedings of the OceanObs, Venice. ESA Publication WPP-306, 21–25.
- Röme, T. 2010. “Autoscaling Hadoop Clusters.” MSc thesis, University of Tartu.
- Theodoridis, Y., M. V. T. Sellis, M. Vazirgiannis, and T. Sellis. 1996. “Spatio-Temporal Indexing for Large Multimedia Applications.” In Proceedings of the IEEE Conference on Multimedia Computing and Systems, Hiroshima. IEEE, 441–448.
- Vaquero, L. M., L. Rodero-Merino, J. Caceres, and M. Lindner. 2008. “A Break in the Clouds: Towards a Cloud Definition.” ACM SIGCOMM Computer Communication Review 39 (1): 50–55. 10.1145/1496091.1496100.
- WAF. 2013. “Web Accessible Folde.” NOAA. Accessed April 3. https://geo-ide.noaa.gov/wiki/index.php?title=Web_Accessible_Folder
- Wang, S., and Y. Liu. 2009. “TeraGrid GIScience Gateway: Bridging Cyberinfrastructure and GIScience.” International Journal of Geographical Information Science 23 (5): 631–656. 10.1080/13658810902754977.
- Wu, H., Z. Li, H. Zhang, C. Yang, and S. Shen. 2011. “Monitoring and Evaluating the Quality of Web Map Service Resources for Optimizing Map Composition over the Internet to Support Decision Making.” Computers & Geosciences 37 (4): 485–494. 10.1016/j.cageo.2010.05.026.
- Xu, C., C. Yang, J. Li, J. Xia, X. Qu, M. Sun, Y. Xu, D. Fay, and M. Bambacus. 2011. “A Service Visualization Tool for Spatial Web Portal.” In Proceedings of the 2nd International Conference on Computing for Geospatial Research & Applications, Washington, DC. New York: ACM, 31–32.
- Yang, C., M. Goodchild, Q. Huang, D. Nebert, R. Raskin, Y. Xu, M. Bambacus, and D. Fay. 2011a. “Spatial Cloud Computing: How Can the Geospatial Sciences Use and Help Shape Cloud Computing?” International Journal of Digital Earth 4 (4): 305–329. 10.1080/17538947.2011.587547.
- Yang, C., Q. Huang, Z. Li, C. Xu, and K. Liu. 2014. Spatial Cloud Computing: A Practical Approach. Boca Raton, FL. CRC Press/Taylor & Francis.
- Yang, C., H. Wu, Q. Huang, Z., Li, and J. Li. 2011b. “Using Spatial Principles to Optimize Distributed Computing for Enabling the Physical Science Discoveries.” In Proceedings of the National Academy of Sciences 108 (14): 5498–5503. 10.1073/pnas.0909315108.
- Yang, C., Y. Xu, and D. Nebert. 2013. “Redefining the Possibility of Digital Earth and Geosciences with Spatial Cloud Computing.” International Journal of Digital Earth 6 (4): 297–312. 10.1080/17538947.2013.769783.
- Yang, P., J. Evans, M. Cole, N. Alameh, S. Marley, and M. Bambacus. 2007. “The Emerging Concepts and Applications of the Spatial Web Portal.” PE&RS 73 (6): 691–698.
- Zhang, Q., Q. Zhu, and R. Boutaba. 2011. “Dynamic Resource Allocation for Spot Markets in Cloud Computing Environments.” In Proceedings of Fourth IEEE International Conference on Utility and Cloud Computing, Melbourne. IEEE, 178–185.