
Abstract
This paper presents various limitations of the current remote sensing data distribution models and proposes a new concept called the location-based instant satellite image service for a new generation of remote sensing image distribution system. The essential feature of the service is that customers can subscribe to data based on the location of interest and satellite image data received by antenna will be distributed to customer's terminal devices instantly after imaging over the subscribed area. The workflow, architecture, and key technologies of the new generation data distribution system are described. The system is composed of four parts: data comprehensive processing component, data management component, product distribution component, and data display component. Based on this, a prototype system is developed, which demonstrates the promising service model with great potential for increased usage in many applications.
1. Introduction
In recent years, a growing number of remote sensing satellites have been launched into space. Meanwhile, the performance of the satellite payloads, such as spatial resolution, swath width, spectral ranges of bands, has greatly improved compared to the past. With these technological advancements, people can monitor natural phenomenon and human activities on the earth surface from space in a more frequent, accurate, and convenient way. Increasing availability of remotely sensed data has led to the development of many more remote sensing applications. However, the remote sensing data are still generally considered a scientific dataset used by specialist organizations and government agencies, not as popular as other data from global positioning system and communication satellites. In other words, its applications are not as broad enough. The primary reason is that the traditional distribution model is indirect, inconvenient, and inefficient. For years, professional users have been able to search and order the remote sensing image data with standard size scene using database technologies, but the workflow is too complicated for the public. For a manager of offshore drilling platform, their greatest concern is whether there is oil leakage around the platform. For a ranger, they care about whether or not there is a fire occurring in forests or there is illegal deforestation activity. For a reservoir manager, they need to know about the change of reservoir area. For the public, they may want to have a look at the imagery within 10 kilometers from their home.
It is a large challenge to change the traditional remote sensing data distribution model. Objectives like improving the efficiency of data distribution, better utilizing the huge volume of remote sensing data acquired every day, and meeting the public's requirements are all complex challenges. The remainder of the paper is structured as follows. Section 2 analyzes the current status and characteristics of the traditional data distribution model. The concept, key technologies, and architecture of a new generation of remote sensing data distribution system, location-based instant satellite image service (LBISIS) are described in Section 3. Section 4 discusses the potential for future development of the system.
2. The analysis of the traditional remote sensing data distribution
Remote sensing data distribution is a key step within the business chain of reception–processing–archiving–distribution, bridging the gap between the user and remote sensing data. It is not only an essential means for users to obtain remote sensing data but also a dominant factor affecting the ways of how to apply these data for customers. Hence, it is able to determine whether the remote sensing data can be practical, profitable, and broadly accessible.
Traditionally, from the data provider's perspective, remote sensing data should be firstly received and processed. Then, the catalog information is created and ingested into a database. After that, the data service is ready to allow users to query, search, order, and download satellite images. On the other hand, from the customer's aspect, for the sake of obtaining remote sensing data, customers should log into the data service website supported by the data provider, and search data by specific attribute parameters. Once the interested data can be found in the database, customers can order the data which can be delivered to them by disks, CDs, or direct download from Internet. Currently, leading remote sensing data service platforms around the world implement this model to distribute remote sensing data and provide data services, such as the multi-satellites data service platform operated by Institute of Remote Sensing and Digital Earth, Chinese Academy of Sciences (http://eds.ceode.ac.cn/, Dai et al. Citation2008), the TERRA-MODIS platform from Institute of Geographic Sciences and Natural Resources Research, Chinese Academy of Sciences, scientific data platform from Computer Network Information Center (http://www.csdb.cn/), data service platform from China Centre for Resources Satellite Data and Application (http://218.247.138.121/DSSPlatform/index.html#/), data service website from US geological survey (USGS)/EDC (http://landsat.usgs.gov/), data service platform from European Space Agency (http://miravi.eo.esa.int/en/), data service platform from Remote Sensing Technology Center of Japan (http://www.restec.or.jp/english/satellite/index.html), and data service platform from Geo-Informatics and Space Technology Development Agency of Thailand (http://www.gistda.or.th/gistda_n/en/index.php?option=com_content&view=article&id=17&Itemid=27).
Web-enabled Landsat data (WELD) provided by USGS are weekly, monthly, seasonal, and annual mosaic product over the conterminous United States and Alaska. These data are processed by terrain correction and radiometrical calibration, making them simple to use for scientific applications, such as land cover classification and regional assessment of surface dynamics (Hansen et al. Citation2014). However, generating the WELD products is time-consuming which can cause delays between acquisition and product release which may be unacceptable for some applications.
Another category of remote sensing data service is to combine remote sensing images with the map view functionality, exemplified by Google maps, Apple maps, and Sogou maps. With web services technologies, remote sensing data precisely overlaid by vector map data can be viewed and searched by users (Shi, Wang, and Zhuang Citation2010). This kind of system has image data from a variety of satellites, and can automatically select available and suitable images to be shown with vector map data depending on the map scale when browsing the map. It enables users to directly perceive the characteristics of earth surface when they skim through the map, and greatly enhances user experience with rich information from the integration of image data and vector data. Nevertheless, the shortcoming of this kind of service is the lack of customization, unable to distribute the data covering the user's region of interest in an active way. In addition, these services update the remote sensing data slowly, which means that users are often unable to view the most up-to-date images from these services.
At present, due to the explosion of remote sensing data and rapid development and prevalence of mobile terminals and wireless networks, these traditional data distribution models have been exposing constraints that hinder the developments of remote sensing applications. Three dominant problems are listed as below:
At first, these traditional data distribution models provide the data service in a passive way such that customers do not conveniently access the latest data promptly. In the traditional models, the life cycle of the data service has three steps: (1) users construct queries to search the catalog information of the remote sensing data; (2) users order the remote sensing data based on the results from the data service; and (3) the data service deliver the remote sensing data to users. If users desire to keep a keen eye on the up-to-date data covering the same area, they have to persist in restarting the data service to check whether these are latest data. Otherwise, users cannot obtain the latest data timely. Since the current data distribution models are lacking functionality such as an active reminding function and an instant dissemination function, they are very difficult to satisfy a set of requirements of obtaining the latest data automatically, distributing the remote sensing data to users as a routine service actively and allowing users to acquire data more conveniently by making use of the prevalence of mobile intelligent terminals.
Secondly, the traditional models do not implement customization functionality for data. In the traditional business chain of reception–processing–archiving–distribution, the two steps most concerned are the data processing and the data archiving. The remote sensing data are processed and managed according to the prescribed procedures, and delivered to users in predefined standard size scenes, without considering the customers’ distinctive requirements for data. These models do not meet the needs of applications with high customization level, because these data retrieved from these models are often unable to be utilized directly by users. For example, if a user needs to obtain the data covering an specified area around a point of interest or a specific administrative district during a period of time, the user has to order and download data with standard size scene and then carries out a series of spatial operations to derive the desired results by themselves, such as image clipping, band filtering, format translation, or information integration. This kind of data service does not afford options of data customization to users.
At last, the current data distribution models are not adapted to the laypeople. The standard product data with different levels acquired from these models are mainly applied for professional users in the fields of forestry, agriculture, water conservancy sector, and land surveying. These users possess expertise of remote sensing and are with the capability to extract professional information from these standard products. On the other hand, citizens without professional knowledge and techniques also have a strong desire to detect objects and identify changes for their ordinary works using the remote sensing data. For instance, a ranger of a forest needs to know about the exceptions happening around the forest, such as wild fire or illegal deforestation activity. What a manager of offshore drilling platform concerns about is whether there is an oil leakage event occurring around the platform. These users are familiar with the environment around them so that they can easily interpret major exceptions from the remote sensing images. What they are eager for is to make their daily works more effectively and efficiently by accessing the remote sensing images from a computer or a smart phone. However, the current data distribution models are not designed for these amateur users. It is too complicated for them to know about the terminology such as remote sensing product levels, bands parameters, and data formats. As a result, the usage rate of remote sensing data is very low in the non-professional fields. Take China as an example, China Remote Sensing Satellites Ground Station in 2008 received 369,100 standard size scenes, in which only 13,600 scenes were ordered and used by users, only taking 3.7% of all receiving data (Zhang Citation2011).
In summary, the demand for the remote sensing data from the public has increased, as evidenced by the Google earth which successfully shows that the connection between the remote sensing data and the public can be closer, while the traditional remote sensing distribution models are focused on a few professional agencies based on the outdated ideas, technologies, and satellite resources. With the development of remote sensing technologies, it has been shown that these traditional models have become more and more unsuitable to meet the needs to enable users to access the remote sensing data in a more fast, flexible, simple, and cheap way. Hence, a new remote sensing data distribution model and system should be developed to improve the applications of remote sensing data, to increase the amount of users from the public, and to promote the value of these data. The LBISIS was built around the concept. With the well-designed data comprehensive processing system and data distribution system, the LBISIS is able to provide data customization functionality to users, and allows users to specify the region of interest. Once the satellites fly over the region and capture the images, users can immediately obtain these images from the LBISIS by terminal devices, such as computers or mobile phones, without concerning the details of remote sensing technology.
3. The idea and architecture of LBISIS
3.1. The design idea
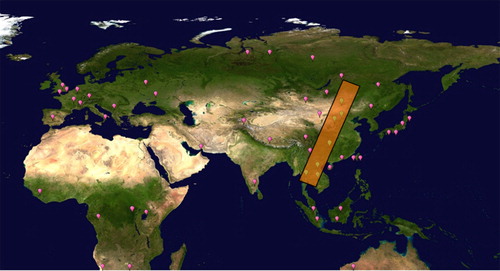
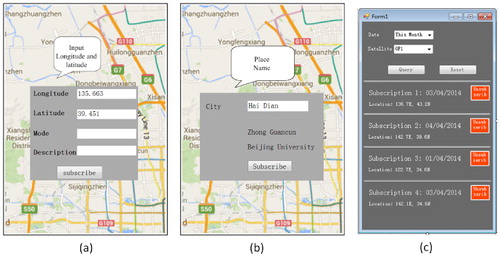
In order to improve service quality of remote sensing data for the public, the design idea for the LBISIS system is proposed. The essence of the idea is that the service allows users to register any regions of interest on it by inputting location information (longitude and latitude). Once the data covering the specified area are captured by satellites, the service will send the image to user's smart phone or other intelligent terminals. Users can purchase one of subscription plans (e.g., a weekly plan or an annual plan) to consecutively monitor the places of interest. In addition, users can request the number of satellites providing service, data spatial resolution and the custom extent of the area of interest. The customization functionality can reduce costs for users to acquire remote sensing images. shows the management interface of places of interest specified by users. The markers shown in the diagram represent the points of interest registered by users and the green color indicates that a satellite is flying over the point of interest. Users can detect the changes easily around their familiar areas using the images delivered by the LBISIS.
3.2. The workflow and architecture of the system
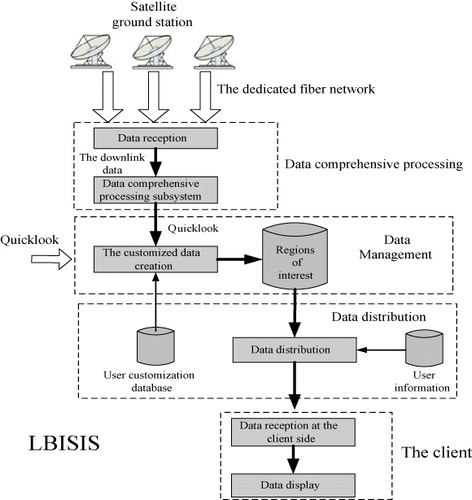
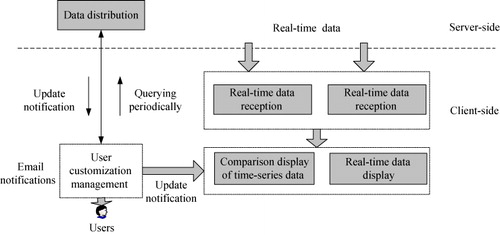
shows the flowchart of the LBISIS which is composed of four subsystems, namely comprehensive processing, data management, data distribution, and data display. The downlink data, including image data and auxiliary parameter data, successfully received by remote sensing satellites ground stations are transferred to the LBISIS by fiber network. The LBISIS separates remote sensing image data from the auxiliary parameter data and automatically performs rapid radiometric correction and geometric correction on these image data. Based on the locational information of points of interest, these image data are clipped, packed, and delivered to the specified addresses using predefined manners. The data display subsystem, also known as the client component which can be deployed on smart phones or personal computers, communicates with the server side of the LBISIS using a predefined protocol via a point-to-point model. The operation steps including data reception, comprehensive processing, customized data creation, and data distribution are carried out by LBISIS through a pipeline pattern.
3.2.1. Data comprehensive processing subsystem
The data comprehensive processing subsystem takes responsibility for converting satellite data into quicklook images. There are three steps involved in the subsystem, namely data separation, georeferencing, and pyramids creation, among which georeferencing is the most time-consuming step. Georeferencing, also known as geometric correction, is to align the image data to a map coordinate system defined using a map projection. In order to improve the accuracy of georeferencing, a series of ground control points are identified based on existing basemap, and the image data are transformed and resampled to match the map coordinates of the basemap. Generally, the precision of registration is positively correlated with the processing time of georeferencing. In other words, the better the alignment results, the longer the georeferencing will take during processing. Since the good georeferenced data with high accurate spectral values result in better quantitative analysis and quantitative inversions, professional users often desire high level remote sensing product data (Yin and Kuang Citation2007). In contrast, the public usually pay attention to the speed to access the remote sensing images and how the images look for visualization. Therefore, the subsystem takes the reverse projection method for rapid georeferencing. This method identifies a series of discrete points in the original image data and exports them into a longitude–latitude grid file. The connection between one point on the image data and the corresponding location on the map coordinate system can be established based on the satellite imaging model (Chen et al. Citation2006). The grid file records the discrete points’ coordinates on both of pixel space and map space, and the method can determine locations of intermediate points by interpolation technique. The exporting data from the subsystem are the georeferenced quicklook data, which is made up of an original image and a longitude–latitude grid file. The subsystem separates the georeferenced quicklook data into blocks on which the pyramids are built for improving the display performance and reuse.
3.2.2. Data management subsystem
Data management subsystem is responsible for managing the georeferenced quicklook data from the data comprehensive processing subsystem. The subsystem assigns a space for every user to store the information about the points of interest into a database. The components of the subsystem are shown in .
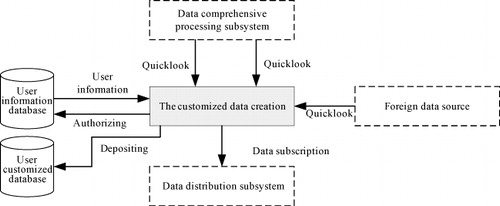
The subsystem administrates two databases: the user information database (UID) and the user customization database (UCD). The UID records the user's subscription information including longitudes and latitudes of the regions of interest, satellite name, subscription plan, and the data license information. The data license information defines the privileges for users not only to access the most up-to-date quicklook data but also to download archived data covering the regions of interest over a period of time. The UCD deposits ID numbers of blocks of the georeferenced quicklook images covering the regions of interest for each user. Because quicklook images have been divided into blocks by the data comprehensive process subsystem, the customized data creation component in the data management subsystem makes use of the user's subscription information from the UID to search the corresponding quicklook images and calculate the ID numbers of blocks for the corresponding quicklook images, and then the ID numbers instead of the clipped quicklook images are stored into the UCD for each user. This strategy confirms that there is only one copy of quicklook images maintained by the subsystem. After the customized images are created successfully, the data management subsystem will inform the data distribution subsystem to send image data to subscribers.
3.3. Data distribution subsystem
Data distribution subsystem disseminates satellites images to users’ terminal devices based on their subscription information. Once the latest images are processed from data management subsystem, the data distribution subsystem will inform the subscribers to view the data using data display subsystem. If the subscribers repeatedly check the data distribution subsystem to see if a new image is available using polling approach, it will overload the data distribution subsystem when too many of consumers poll the subsystem at the same time. Therefore, the communication between the data distribution subsystem and the data display subsystem is based on the event-driven notification mechanism which eliminates the times of information interaction and provides support for a huge amount of subscribers.
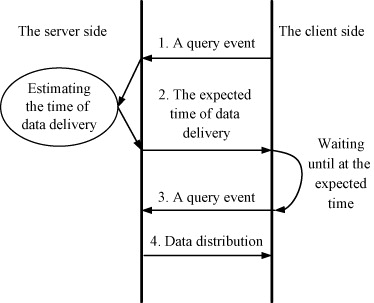
shows the workflow of the event-driven notification mechanism between the data distribution subsystem on the sever side and the data display subsystem on the client side. The data display subsystem initializes a query event to the distribution subsystem for retrieving images. On the server side, after receiving the event, the distribution subsystem estimates the data delivery time based on the user's subscription information, such as data receiving time from the specified satellites and data customization time. Then the distribution subsystem sends the expected time to the client side, and the data display subsystem will restart a query to the server side at the expected time. The server side then checks the status of data and sends either the desired data or a new expected delivery time to the client. The benefit of this mechanism is that it strives to minimize the times of interactions between the server side and the client side.
3.4. Data display subsystem
As the client component of the LBISIS, the data display subsystem can be deployed on many kinds of intelligent devices, such as the personal computers or smart phones. It provides interfaces to allow users to subscribe and display the quicklook images. The architecture of the subsystem is shown in .
The data display subsystem communicates with the data distribution subsystem using predefined protocol. It inquiries the status of data subscribed by users and retrieves the data from the data distribution subsystem by the real-time data reception component. It allows users to define the regions of interest and to choose a subscription plan. For instance, a user can define an area taking 10 kilometers as radius from the point of interest and choose a 30-day subscription plan. According to the subscription information, the data distribution subsystem will deliver images covering the area to the subscriber for 30 days.
As shown in , users can define the points of interest by clicking the points on a digital map, or specifying the longitude and latitude coordinates or the names of cities directly in the data display subsystem. The subsystem provides the subscription management functions to search change or cancel the subscription information.
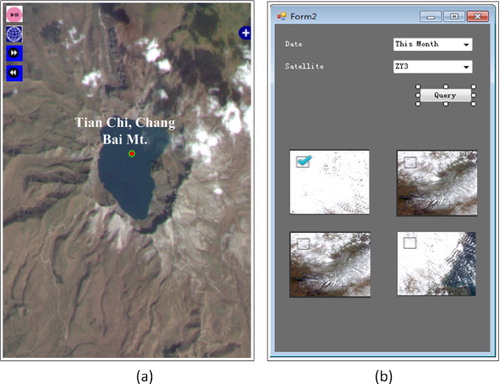
The data display subsystem implements various data display tools for subscribers. shows the two kinds of interfaces for data display tools: the basic tool and the comparison tool. The basic tool allows users to see the images covering the regions of interest as if they were looking down from the satellite, and can integrate the images with vector data. With the premium subscriptions, the subsystem can provide a comparison tool for users to detect changes using images captured in different time.
4. Discussion
Institute of Remote Sensing and Digital Earth (RADI), Chinese Academy of Sciences, operates China Remote Sensing Satellite Ground Station. With its three ground receiving stations at Miyun, Kashi, and Sanya, the station net has the ability to receive remote sensing data covering 70% of Asia. Data from various domestic and overseas satellites can be transmitted from the three satellite ground stations to headquarter in Beijing by dedicated fiber network (Guo et al. Citation2012). Based on the hardware environment, the prototype system has been developed, which has proved that the LBISIS is feasible. The georeferenced quicklook images can be distributed to subscribers in 2 minutes after data capture by the satellite ground stations. Since the system meets the users’ requirements of obtaining data directly and timely, the prototype system has great potential to support many applications of monitoring disasters, tracking the progress of construction projects, supervising the port spaces or parking lots, or inspecting the current events from the news.
Four potential improvements in the future are listed in the following:
Establishing a satellite data service alliance: More satellites means a shorter time between observations of the same place leading more options for users. Currently, RADI has been receiving remote sensing data from some 10 satellites. Data from three of satellites can be processed and distributed by the prototype system. The maximum time interval between observations of the same place is within 2 days. Having more satellites integrated into the system also means that the system can deliver data covering more countries and have more users. Based on the alliance, satellite owners can provide satellite resources and share the benefits from the service by converting their data into the quicklook data with the format specifications.
Supporting the high level product data: The system can also provide high level product data such as ortho-rectification data for users who take care of data precision rather than data timeliness.
Satellite programming based on the regions of interest: The costs of programming a satellite to capture an image covering on a region of interest is huge expensive. However, once the points of interest from subscribers are clustered to an area, the satellite owners can actively capture the data of that area by satellite programming to improve the service quality.
Applying new algorithms for the system: The system can then support more advanced functions based on the new algorithms of data mining. In the business chain of the LBISIS, some novel algorithms can be integrated into it and rapidly detect information about changes occurred in the images, exemplified by fire points in the forest, vessels in the ocean, and regional changes of water body. The information can be overlaid with images to display warnings and reminders for users.
5. Conclusion
Remote sensing techniques play an important role in monitoring the earth from space for human beings. Remote sensing data should be accessed and used with high efficiency and low cost. The images are the major information obtained from remote sensing data. By visual interpretation, people can extract a large quantity of useful information from these images. However, ever since a long time, data distribution technologies are mainly applied to data analysis for some scientific organizations without concerning about the applications by the public, which is no longer propitious for the further development of remote sensing applications. This paper proposes the LBISIS for a variety of user customization demands, which can deliver the remote sensing data to users’ smart phones for easy accessing. It can be expected that the study of this kind of service will change the traditional remote sending data distribution model to improve and promote the development of remote sensing applications.
Acknowledgment
The authors would like to thank the support of 135 Strategy Planning of Institute of Remote Sensing and Digital Earth, CAS.
References
- Chen, F., W. Q. Zheng, W. Y. Zhang, and J. Yang. 2006. “A Method for Fast Cartographic Transformation of WEBGIS.” Computer Engineering and Applications 42: 210–212.
- Dai, Q., J. B. Liu, and S. B. Liu. 2008. “Key Techniques of Massive Remote Sensing Data Sharing.” Computer Engineering 34: 283–285.
- Guo, H. D., J. B. Liu, A. Li, and J. G. Zhang. 2012. “Earth Observation Satellite Data Receiving, Processing System and Data Sharing.” International Journal of Digital Earth 5: 241–250. doi:10.1080/17538947.2012.669963.
- Hansen, M. C., A. Egorov, P. V. Potapov, S. V. Stehman, A. Tyukavina, S. A. Turubanova, D. P. Roy, et al. 2014. “Monitoring Conterminous United States (CONUS) Land Cover Change with Web-Enabled Landsat Data (WELD).” Remote Sensing of Environment 140: 466–484. doi:10.1016/j.rse.2013.08.014.
- Shi, G. B., X. Wang, and W. D. Zhuang. 2010. “Agricultural Machinery Trace Monitoring System with Google Maps.” Transactions of the Chinese Society for Agricultural Machinery 43: 231–236.
- Yin, Q., and D. B., Kuang. 2007. “Views on Chinese Remote Sensing Development.” Journal of Infrared and Millimeter Waves 26: 225–231.
- Zhang, B. 2011. “Intelligent Remote Sensing Satellite System.” Journal of Remote Sensing 15: 416–422.