
Abstract
With the explosion of digital data, the need for advanced visual analytics, including coordinated multiple views (CMV), is rapidly increasing. CMV enable users to discover patterns and examine relationships across multiple visualizations of one or multiple datasets. CMV have been implemented in a web-based environment through the Australian Urban Research Infrastructure Network (AURIN) project. AURIN offers a platform providing seamless and secure access to an extensive range of distributed urban datasets across Australia. Visual exploration of these datasets is essential to support research endeavors. This paper focuses on the challenges in dealing with complexity and multidimensionality of datasets used in CMV. We rely on the concept of multidimensional data cubes as the theoretical framework for coordination across visualizations. Using the concept of data cubes and hierarchical dimensions, we present strategies to automatically build render groups. This provides an implicit coordination based on cube structures and a framework to establish links between a dataset with its aggregates in a one-to-many fashion. The CMV approach is demonstrated using aggregate-level data, which is provided through federated data services. The paper discusses the issues around our CMV implementation and concludes by reflecting on the challenges in supporting spatio-temporal urban data exploration.
Introduction
As more people move into cities, there is an increasing need to understand the dynamics and behavior of people and their relationship with the built environment to assist in planning for sustainable urban futures. With the recent emergence of big data, including open government data and crowd-sourced data, there is a need to provide access to visual analytical tools to support the exploration of such a rich tapestry of data. Urban researchers, policy, and decision-makers need approaches that allow them to visually mine this rich data for better understanding of the form and function of cities.
The Australia Urban Research Infrastructure Network (AURIN) project is one such initiative aimed at facilitating the access to, and analysis of data of relevance to urban researchers, policy and decision-makers across the country. AURIN is building a fully Web-based research environment that enables the discovery and the acquisition of diverse, spatially referenced data (such as demographic datasets, public health datasets, GIS layers, and many other socioeconomic datasets), with tools that support their interactive visualization and exploration in a rich user environment (Sinnott et al. Citation2012). The users interact with the environment through a shop-explore-analyse-create-collaborate cycle around research data (Tomko et al. Citation2012). The environment provides researchers with a confirmatory data analysis capability, based on a workflow environment, and exploratory data analysis through various visual functionalities including 2D map, data grid, statistical charts, and 3D space-time cubes (Pettit et al. Citation2012).
A fundamental property of AURIN is that all data are directly sourced, on-demand from autonomous, heterogeneous, federated data providers through targeted data access services. In this context, facilitating the visual exploration of the patterns contained in and across disparate datasets in the context of the Digital Earth vision (Craglia et al. Citation2012) is a challenge and one that motivates this paper. Specifically, we are interested in how Coordinated Multiple Views (CMV) of data can be designed and implemented to support more integrative and exploratory analysis of loosely coupled datasets, which may themselves have very diverse and idiosyncratic structures.
CMV, or Multiple Linked Views (MLV) in some papers (Erbacher and Frincke Citation2007; Jern et al. Citation2007; Roberts Citation2004), provides an exploratory visualization (EV) environment, ‘where each of the views are linked together such that any user manipulation in one view is automatically coordinated to that of any other’ to promote ‘insight through interaction’ (Roberts Citation2008, 25). In this interactive visualization construct, two or more data views of identical or related datasets are made interdependent in order to enhance the data exploration and information-seeking behavior of the user (Buja, Cook, and Swayne Citation1996; Buja et al. Citation1991). Multiplicity of views has been claimed to decrease clustering, extend the analysis scope, contrast multiple facets of data, facilitate data comparison, enhance multivariate relationship, and avoid context switching via simultaneous display, which in turn increases users' performance and satisfaction, especially when completing difficult tasks (Boukhelifa, Roberts, and Rodgers Citation2003; Butkiewicz et al. Citation2008; North and Shneiderman Citation2000b; Pillat and Freitas Citation2006).
Coordination, or view linking, can take many forms (Boukhelifa, Roberts, and Rodgers Citation2003; Pillat and Freitas Citation2006; Wang Baldonado, Woodruff, and Kuchinsky Citation2000). Coordinated views may be simply displayed as small multiples and optionally linked by graphical objects (e.g. lines (Steinberger et al. Citation2011)). Coordination can also take interactive forms, such as ‘linking’ (Buja et al. Citation1991), including brushing and focusing, and ‘navigational slaving’ (North and Shneiderman Citation2000a). These are practically implemented as synchronization of selection, highlighting, filtering, scrolling, and zooming across views (and their preceding production steps, including data processing (Boukhelifa, Roberts, and Rodgers Citation2003)).
CMV have been supported by various visualization tools: xmdvtool (Martin and Ward Citation1995; Ward Citation1994), IVEE (Ahlberg and Wistrand Citation1995), IRIS Explorer (Foulser Citation1995), Spotfire (Ahlberg Citation1996), cdv (Dykes Citation1997), Descartes (Andrienko, G. L. and Andrienko Citation1999), and Amira (Stalling, Westerhoff, and Hege Citation2005). They have also been widely used in a number of application contexts such as biology (Graham and Kennedy Citation2001; Guo Citation2003), physics (Doleisch Citation2007) and finance (Chang et al. Citation2007). In particular, CMV are highly relevant to geospatial applications, for example, CommonGIS (Andrienko, G. L. and Andrienko Citation1999), GeoVISTA studio (Takatsuka and Gahegan Citation2002), Improvise (Weaver Citation2004), Geoviz Toolkit (Hardisty and Robinson Citation2011), and Weave (Baumann and Adviser-Grinstein Citation2011). In the geospatial domain, CMV have been used in the visualization of both 2D spatial data (Anselin, Syabri, and Smirnov Citation2002; Butkiewicz et al. Citation2008; Gatalsky, Andrienko, and Andrienko Citation2004; Guo et al. Citation2006) and 3D spatial data, such as in LinkWinds (Jacobson, Berkin, and Orton Citation1994) and Visage (Roth et al. Citation1996).
While the research on CMV has been steadily maturing over the past 20 years, some researchers have argued that CMV is not a ‘solved problem’ and research opportunities are still open for exploring how to provide a CMV mechanism that is suited to real-life problems, and how CMV should be developed further as part of Visual Analytics (Andrienko, G. and Andrienko Citation2007; Roberts Citation2007). A broader overview about this subject and CMV research challenges are well-documented in the literature, see, for example, Andrienko and Andrienko (Citation2007), Roberts (Citation2007, Citation2008), and Scherr (Citation2008).
A relevant issue to this paper, data processing, and preparation is identified by Roberts (Citation2007) as one of the fundamental challenges faced by CMV designers. This challenge is even more pronounced in the geospatial research area, as Roberts (Citation2008, 30) suggested: ‘the sheer size, complexity and diverse nature of geographical datasets definitely have consequences for exploratory analysis.’ In their most recent paper on the visual analysis of multifaceted scientific data, Kehrer and Hauser (Citation2013, 498) emphasize the challenge of data heterogeneity, where ‘levels of data abstraction’ and ‘fusion of heterogeneous data at feature/semantic level’ are still open-ended issues for CMV.
The issues of data abstraction and fusion of heterogeneous data are the key focus of this paper. The application circumstances of this paper and visual analytics of diverse federated datasets, represent a contemporary challenge for CMV. This is naturally coupled with the rise of e-Science and Big Data research disciplines (Hey, Tansley, and Tolle Citation2009). More recent works on CMV around heterogeneous data reflect such trends (Kehrer and Hauser Citation2013; Kehrer et al. Citation2011).
The aim of this research is to first to develop a model for coordination across views generated from heterogeneous datasets (viewed as multidimensional data cubes); second, to present a strategy to automatically linking views based on their underlying multidimensional cube properties, and third, present pragmatic applications of the model and associated strategy. The concepts of data cubes, popular in the context of Enterprise Information Technology and Business Intelligence (Gray et al. Citation1997; Kimball Citation1998) could provide a coordination framework in the same way CMV have used relational database concepts (North et al. Citation2002; North and Shneiderman Citation2000b). This is the main contribution of this paper.
Related work on CMV modeling
Various modeling and architectural approaches have been presented to formally model coordination in linking multiple views (Roberts Citation2008; Scherr Citation2008): (1) constraint-based programming (McDonald, Stuetzle, and Buja Citation1990); (2) relational schema approaches (North and Shneiderman Citation2000a); (3) the module view controller (MVC) pattern (Pattison and Phillips Citation2001); (4) shared coordination objects that host visualization parameters (Boukhelifa and Rodgers Citation2003); and (5) visual abstraction languages based on shared-objects (Weaver Citation2004).
These approaches are aimed at various abstraction levels and various aspects of coordination. For example, the work of Pattison and Phillips (Citation2001) is concerned with the implementation architecture for generic view coordination. They apply the MVC pattern to separate the specification and implementation of the mapping between data model to view model.
The Snap-Together model (North et al. Citation2002; North and Shneiderman Citation1999, Citation2000a, Citation2000b) takes a data-centric approach in dealing with coordination. This approach simplifies the way users create custom coordination through relational schemata, which is based mainly on relational database concepts (Codd Citation1970). Users control coordination of views by specifying a relational join between dataset schemas. This enables ‘snapping of visualizations’ through a mapping in the form:
Boukhelifa, Roberts, and Rodgers (Citation2003, 78) introduce a model that ‘handles coordination from a more general viewpoint and takes into consideration exploratory visualization needs for rich and varied user interactions.’ The model is intended to address the coordination design issues without bias toward a particular data, navigation, or communication paradigm. To achieve this, they present a formal layered model grounded on a high-level conceptual view of visualization, in which coordination could take place during any stage of visualization data flow: enhance, map, render, and transform (Chi Citation2000; Haber and McNabb Citation1990).
Weaver (Citation2004) proposes a visual abstraction language and a coordination mechanism based on the concept of shared-objects combined with indirect coordination through query mechanisms. Coordination is performed on controls (e.g. views and widgets), which are associated with one or more live properties. These properties can be bound to shared-objects (or variables). Distinct variables can be indirectly coordinated through lexical translation.
Coordination for data cubes
Traditionally, a multivariate dataset used in visualizations and visualization research is typically described in a relational sense, i.e. as a tabular dataset with n records (or rows) and p attributes (or columns), with the attributes being mostly cast as numerical values (even for categorical ones). This kind of dataset is often depicted as a collection of n points in a p-dimensional Euclidean space (McDonald, Stuetzle, and Buja Citation1990).
Such conceptualization of data is grounded in relational data models (Codd Citation1970), which have been a de facto standard for many database implementations. More recently, an alternative multidimensional conceptual model, data cube, has gained traction particularly in the business and management areas to support Online Analytical Processing (OLAP) and Data Warehousing (Gray et al. Citation1997; Kimball Citation1998). Before outlining the way views are coordinated by taking advantage of their underlying data cube structure, we present the concept of a data cube in more detail.
Data cubes
Data cubes provide an abstraction that supports mechanisms to quickly deliver summarizations and aggregations of the underlying data at various levels (or more precisely dimensions). Broadly speaking, data cubes organize information into ‘dimensions’ and ‘measures’, which roughly corresponds to the independent and dependent variables, respectively (Stolte, Tang, and Hanrahan Citation2003). Conceptually, dimensions are represented as an axis of a data cube, and measures are contained within ‘points’ or ‘cells’ of the cube. Thus, a particular measure (typically numerical value) is referenced based on a combination of dimensional values. The term ‘dimension’ here is different to the traditional notion of dimension as in multidimensional data in scientific discipline. Cube dimensions typically (but not always) capture the categories of categorical data (both ordinal and nominal).
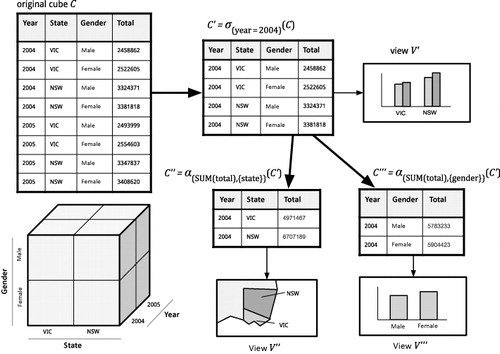
As an example in the context of Australia using population Census data, consider the population dataset over gender across different states, where the dimensions of interest include GENDER, AREA (e.g. State), and TIME (e.g. year). A measure of such a dataset would be TOTAL, which refers to the total population according to the relevant values of dimensions (see ). Each row in the original cube C represents a tuple of the cube, a mapping between dimensions and measures.
Several papers have used the data cube as a reference model in their implementation of CMV (Guo et al. Citation2006; Jern et al. Citation2007); however, they lack formalism in design of multidimensional cube models. Similarly, Weaver (Citation2010) presents a method for interactively expressing sequences of multidimensional set queries by cross-filtering nominal values of dimensions across pairs of views. Stolte, Tang, and Hanrahan (2003) employ hierarchical attributes in a dimension of data cubes to support multiscaling. In building upon such research, this paper aims to explicitly focus on the use of data cubes in supporting CMV (in the spirit of Snap-Together's treatment of relational construct).
The structure of data cubes C can be formally defined as a four-tuple:
For the example above based on Australian census data extracted through the AURIN portal via the Australian Bureau of Statistics:
Note that the attributes of a dimension may form a hierarchical structure. TIME dimension, for example, can contain nested temporal scales {week, month, quarter, year}.
The actual instance of data cubes can be defined as a collection of cube tuples (similar to row in the relational sense), which are the results of a mapping g between Cartesian product of all domains of n dimensions D and k values of measures M; so g is defined as
The power of data cubes lies in the operations that can be performed on groups: slice, dice, aggregate, drill-down, roll-up, and cross-tab (Datta and Thomas Citation1999; Gray et al. Citation1997). Slice and dice correspond closely with the relational algebra operator's selection and projection. They belong to restriction operator (σ), which restricts the values on one or more dimensions but does not change the structural properties of the cube (i.e. it maintains ). The aggregation operator (α) applies aggregation functions (e.g. SUM, AVERAGE, COUNT, MAX, MIN) on measures over one or more dimensions (more precisely grouping attributes). This operator produces a cube with a new
. Aggregation facilitates roll-up, in which summarization is performed along one dimension adding a new aggregation level; drill-down, where summarized data is unpacked along a dimension to show more detailed information; and cross-tab (or pivot) where symmetric aggregation is performed over n dimensions. These operators produce a new data cube, which may or may not maintain its original structural properties (for examples of these operations, see ).
In general, aggregation is probably the most relevant aspect in the context of visualization. This operation produces summary statistics that can be useful in supporting overview-and-detail views (North and Shneiderman 2000a). Linking with data aggregates has been highlighted in the several CMV applications, either as aggregated spatial subspaces (Guo et al. Citation2006) or aggregated statistics (Chang et al. Citation2007; Hienert et al. Citation2011; Kehrer, Filzmoser, and Hauser Citation2010).
Our example of a population cube () illustrates opportunities to coordinate the original data cube with all of its aggregate cubes. The obvious use case of such coordination is to link the detailed view of the original dataset with the views that use the derived statistical aggregates (SUM, AVERAGE, COUNT). This overview-and-detail view represents a linkage between aggregates (data summary) and raw tuples (data details). Additionally, cross-aggregate linkage may be established between two cubes if there is at least one common dimension between the cubes. This allows viewers to simultaneously inspect various levels of summaries.
Hierarchical dimension
Cube dimensioning is a powerful concept because it may be used to capture hierarchical structure, which provides more comprehensive aggregation levels. These hierarchical aggregation levels can form a level of abstraction for guiding the exploration of the data cube. This has been used in several CMV applications. Stolte, Tang, and Hanrahan (Citation2003) devised a method for independently zooming along one or more dimensions to visually explore data at different spatial levels (the US states and counties). Graham and Kennedy (Citation2001) demonstrated hierarchical linking and focus using tree-structured data. These two examples show how coordinated displays, coupled with aggregation over hierarchical dimensions, can be useful in visual data navigation, particularly to support overview-and-detail views.
In the context of the AURIN portal, hierarchical structures of spatial dimension are a very important aspect in the management of a myriad of data products including the population Census, which is critical for socioeconomic profiling of human settlements. First, most of the datasets provided across the federated sources are aggregated at a particular spatial level (Delaney and Pettit Citation2014). This level is typically an administrative division, like state and local government areas (or LGA, which is roughly similar to the US counties). Some datasets are provided only at a single level of geography, but many are available at various aggregation levels (thus, data cubes with hierarchical spatial dimensions are used behind the scenes).
A few data contributors to the AURIN portal use their own defined spatial geography, for example, Functional Economic Regions have been developed by University of Newcastle's Centre of Full Employment and Equity (Baum, Mitchell, and Han Citation2008). However, most of the AURIN's urban datasets are aggregated at standardized levels specified by the Australian Bureau of Statistics (ABS) through its two regionalization standards: Australian Standard Geographical Classification (ASGC) and more recently, the Australian Statistical Geography Standard (ASGS), which replaced ASGC during the course of AURIN portal development, hence, both standards are supported.
In the context of AURIN, complications arose with the presence of multiple standards and especially with different versions of spatial hierarchical dimensions (see ). AURIN merged this plethora of hierarchies and spatial levels in an encompassing hierarchy, which is represented as a common directed-acyclic-graph (DAG) G that specifies linkage and nesting relationship among various aggregation levels. Formally, a graph G is defined as a pair (V,E), where V is a set of vertices that represents spatial levels; E is a set of edges between the vertices , which represent parent–child or nested relationship between levels (see ).
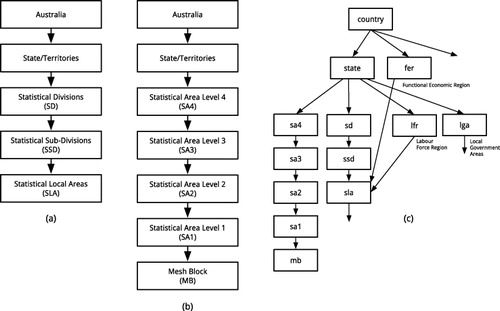
All datasets provided through AURIN must use one of these levels in their metadata description. In supporting CMV, this graph plays a critical part as it forms the ontological foundation for coordination across views derived from various datasets produced at different levels.
With such a common hierarchy, it is possible to link a dataset to other datasets with different spatial levels as long as their divisions (or administrative boundaries) respect the relationship with each other. For example, a Statistical Area 1 (SA1)-level dataset can be potentially coordinated with a SA2-level dataset. We can formally define the possibility to perform cross-levels linkage as follows:
AURIN datasets
Datasets provided though the AURIN portal can be viewed as a cube with an attribute a
* ∈ A as the dataset key containing identifiers from a particular spatial level v
* ∈ A of graph G. Thus, an AURIN dataset must use a standardized aggregation level, which is the geographic aggregation of the dataset (whether the data relate to suburbs, statistical local areas (SLA), or any other aggregated geographies contained with the ASGS or ASGC). These specifications require that the primary key a
* and spatial level v
* are specified in the AURIN metadata registry. This registry also contains metadata for the dimensions, measures, and attributes (e.g. their user-friendly names, internal machine name, and the associated mappings for categorical values).
The next section outlines how the concept of cube and hierarchical dimensions, in particular the spatial one, can be exploited to establish automatic coordination among views, which is essential to support urban research with myriad data sets and spatial classifications.
Configuring coordination
The coordination can be either automatically configured by the system (Mackinlay Citation1986), or can be, with certain limitations, defined by the user. Applications and tools such as LinkWinds (Jacobson, Berkin, and Orton Citation1994), compound brushing (Chen Citation2004), Snap-Together (North and Shneiderman Citation2000a), Improvise (Weaver Citation2004), InfoVis (Pillat and Freitas Citation2006), and GeoViz toolkit (Hardisty and Robinson Citation2011) allow users to compose their own CMV by selecting field-of-views, compositions, and linkages of views.
In this model, coordination may establish commutative and transitive properties (North and Shneiderman Citation1999) to expand the potential linkages. Coordinations themselves can be:
commutative: coordination between two views is bidirectional.
transitive: if view A is coordinated with view B and view B with view C, then A is also coordinated with C. | |||||
Self-join coordinates two views displaying the same relation. In this case, the coordination corresponds to the inherent association that exists between two visualizations derived from a single dataset. Single join can be established between two views whose underlying data relations have a direct join as specified in the data schema. In the relational sense, this join is realized through two primitive associations: (1) one-to-one, where primary-key to primary-key relationship is used, and (2) one-to-many, where a primary-key to foreign-key relationship is used (North and Shneiderman Citation2000a). The compound join is established through indirect association between two views via one or more intermediate relations in the data schema. This takes advantage of the transitive coordination properties along the indirect association path. Such a join enables more complex many-to-many associations. Lastly, in multiple alternative joins, two views may have multiple kinds of join associations, which require a selection or merging of the join associations.
Coordination model for data cubes
One important aspect of configuring coordination is to produce render-groups (Boukhelifa and Rodgers Citation2003; Roberts Citation1998), which are a set of associated views. As the prior section has established, in most visualization tools, these groups have to be defined explicitly by users. This means that explicit configuration of n views requires at most examination of 2n possible combinations.
We take a more opportunistic approach in setting up this configuration. We feel that attempting to automatically establish linkage as much as possible will relieve the users from manually defining the linkage either in the underlying data relations or in the views themselves. This is important when developing a user-friendly portal for urban planners, geographers, and urban designers.
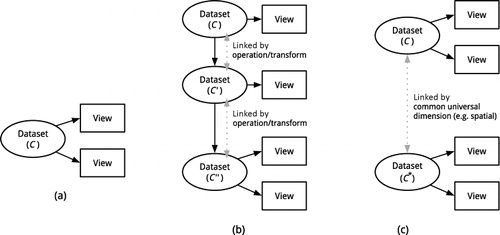
Our approach follows the Snap-Together model (North et al. Citation2002; North and Shneiderman Citation1999, Citation2000a, Citation2000b) and takes a data-centric approach in dealing with coordination. To automatically establish render-groups across views, the approach examines the relationship or coordination between underlying data cubes on which the views are based. To do this, we consider three strategies (see ):
Common data cubes. Several views or visualizations that use a common data cube belonging to the same render group.
Derived data cubes. Render groups can be established between a cube and its derivations, which could be generated through generalized analytical functions (such as classifier and spatial analysis) or through more basic cube operators like restriction operator (σ), aggregation operator (α), and their combinations.
Data cubes with universal common dimensions. Two datasets from two separate federated sources can be linked together if they share a common dimension that is universally defined within the realm of all datasets (such as a spatial dimension represented in AURIN's common aggregation hierarchy).
These three strategies can be used to build dependency graphs in which potential coordination across views may be established based on the underlying datasets. In these graphs, coordination follows the commutative and transitive properties.
The first strategy is similar to Snap-Together's self-join. All views that use the same dataset can be automatically coordinated. As such, the primary key a * of the common dataset provides the link to any interactions across views. Thus, selection or brushing interactions will broadcast the value of the key to all other views that use the same dataset.
The second strategy utilizes the data processing functionality of the AURIN portal, which provides features that can produce data aggregations and more complex data classifications. In most situations, these resultant datasets maintain the structural properties of the source dataset. As such, all the datasets in the data analysis chain may be grouped in a single interdependent set. In the AURIN context, this data dependency is maintained and exploited for the coordination of CMV.
In this case, a data cube and its derivations that share at least a common attribute within their shared dimension can be automatically coordinated. This provides an automatic linking between views (e.g. statistical aggregate charts) that can summarize data (e.g. aggregation of a data cube) and show individual observations (data cube cells). Formally, we can define this scenario as follows:
Let T be operation on a cube that produces another cube.
Table 1. Coordination among views that uses a data cube and its derivatives (see for the description of the data cubes).
There are two ways by which coordination can be established for the actual data, at the tuple (row) level. If coordination is performed where data values match for all common attributes (e.g. State and gender), i.e. linkage can be determined via the Boolean AND operator, then a conservative approach can be taken.
If coordination is performed for at least one set of matched values on any attributes, then an aggressive approach is chosen. This is done via the Boolean OR operation on the values of common attributes. The consequences of this option is that linking tries to find tuple matches wherever possible, i.e. as long as data instances share a common attribute valued, a link can be established. We call this greedy association.
Coordination at the same spatial level
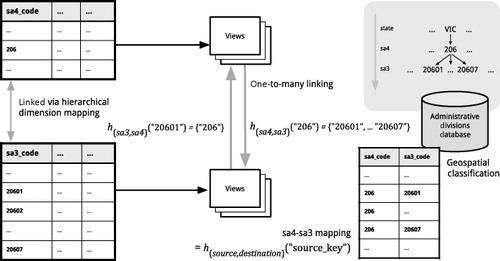
The translation in the actual coordination is supported by the geospatial classification service mentioned above, coupled with the AURIN metadata registry, which contains a necessary translation method for normalizing spatial identifiers contained in the dataset. These methods include no translation, regular expression, and lookup table (see ).
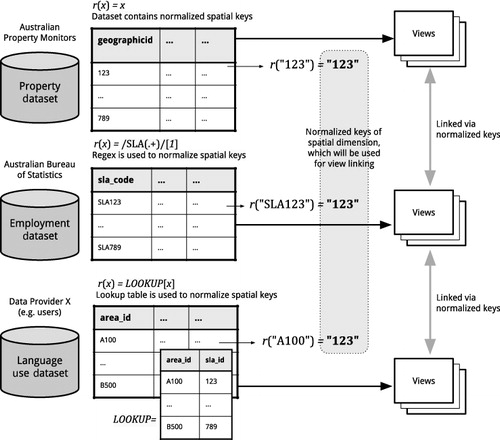
A method often used for the translation is through use of regular expressions. This is applied if and only if such normalization is required (e.g. if a federated data provider has altered a primary key, for instance, by prefixing an integer identifier by a string, such as ‘SLA’ – short for Statistical Local Area, one of the administrative divisions (regionalizations) of Australia). This regular expression is stored in the metadata registry together with aggregation level of the dataset (in this case, ‘SLA’).
Formally this linking can be described as follows:
Such spatial identifier linking is used most commonly as a one-to-one linking (see ). A one-to-one linking, where there is a bijective relationship between tuples based on a unique primary key, is the most common type of CMV linkage. The key of a tuple in the dataset C is directly mappable to a record in the dataset C′, as are any of the views of these datasets. Linking through this direct correspondence is used to emphasize focus on a single data record relating to a single real-world entity and provides visual isolation and a view of the entity in diverse contexts. This is the default behavior in many CMV applications such as GeoVISTA.
Coordination across different spatial levels
As ‘location’ is defined in the AURIN context based on a common spatial hierarchy G, it is also possible to establish linking across various spatial levels. This is done through a geospatial classification service that provides translation and partition resolution support across multiple levels and regionalizations (see ). Such cross-level linkage allows one-to-many (surjective) mapping between parent and child spatial levels (see ).
Conclusions and future research
In this paper, we have presented a model of coordination for multiple views of heterogeneous datasets. These datasets are conceptually seen as multidimensional data cubes, which own a set of structural properties: dimensions, measures, and attributes. The coordination is managed by examining the relationships across multiple independent and interdependent datasets based on these properties. This approach follows North et al.'s application of relational model on CMV (North et al. Citation2002; North and Shneiderman Citation2000b) but utilizes multidimensional data models.
We propose several strategies to automatically create render groups. Thus, linking across views can be established by exploiting the common dimensions of the cube and without requiring users to explicitly specify the linkage. These dimensions can be inherited from cube aggregation operation or some universal dimension such as a standardized hierarchy of regionalization. View linkages can be established through normalized spatial identifiers, including across different spatial aggregation level.
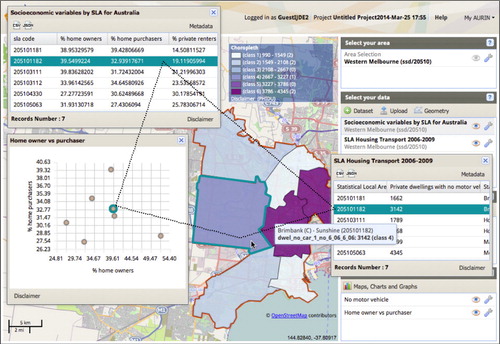
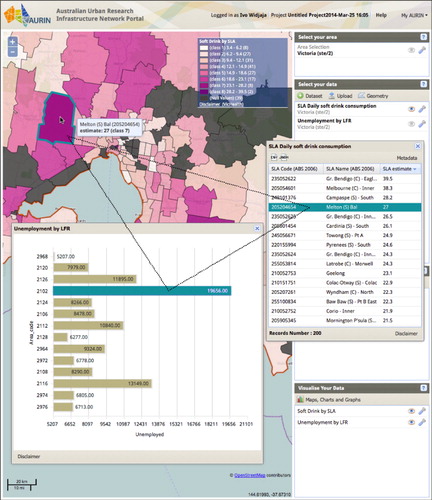
We describe the use case of this approach in the AURIN portal, where CMV are applied in a federated data environment thereby enabling urban researchers, policy, and decision-makers to explore big datasets related to Australian cities. Some distinctive themes have surfaced in this work: the enablement of CMV in a distributed, heterogeneous database system requires more complex handling of hierarchical dimensionality, particularly one that is shared across spatial aggregation levels. A metadata registry and a geospatial classification service are also needed as part of the coordination mechanism. We demonstrated this CMV approach across various forms of data views (table, charts, and choropleth maps).
Several issues in this approach need further investigation. The first one is performance. In our implementation, automatic linking across views based on common arbitrary dimensions currently relies on linear tuple scanning. This provides acceptable response time for a couple hundred tuples (or features), but a more sophisticated indexing process (such as on-demand indexing or automatic-caching of indexing) needs to be examined, particularly for point-based visualization. On-the-fly normalization and one-to-many matching can be computationally expensive. One possible solution to overcome this is the use of real-time indexing during the data prefetching or during the establishment of the views. This will be particularly useful for the interaction where response time is critical such as in brushing functionality. While some of these steps can be performed on the client side, it is also possible to offload the computationally heavy transformations (such as regular expression application) to a server-side process that is performed once, following completion of the data discovery and acquisition process.
A one-to-one linkage using spatial dimensions is handled reasonably well since the spatial identifiers are generally indexed primary keys. Linking across different spatial levels (such as between State and LGA) is supported by a geospatial classification service that relies on a relational database. The potential benefit of using tree-based indexing needs to be examined further.
Another challenge in supporting this hierarchical dimension is the fact that two spatial levels might not be nested perfectly to each other. In this situation, concordance tables may be used to allow coordination, and the best form of coordination for this fuzzy linkage is two potential research opportunities and areas of future work.
The third issue is usability. This paper takes an automatic approach in configuring coordination, which is different to the typical CMV implementations. The comparison between such an implicit automatization and explicit configuration (such as the one used in Snap-Together) requires further study. This study should also investigate if linkage using shared dimension can be cognitively beneficial or confusing to the users, particularly when greedy association is used.
More broadly, future work in AURIN will bring in a significant number of urban settlement datasets at a range of aggregate and disaggregate scales. Other than cube-like datasets, AURIN also provides relational-like datasets including nonaggregated data such as street network, point-based datasets, and graph-based dataset. There is an ongoing effort to investigate how our CMV approach can be further extended and improved to help users uncover relationships and patterns within this network of highly heterogeneous data.
Ultimately, our intention is to assist urban researchers, policy, and decision-makers in being able to visually explore and interrogate this rich tapestry of data, which will go some way in representing the urban component of Virtual Australia (Thompson et al. Citation2008).
References
- Ahlberg, C. 1996. “Spotfire: An Information Exploration Environment.” ACM SIGMOD Record 25 (4): 25–29. doi:10.1145/245882.245893.
- Ahlberg, C., and E. Wistrand. 1995. “IVEE: An Information Visualization and Exploration Environment.” Paper presented at the Information Visualization 1995, Atlanta, GA, October 30–31, 66–73.
- Andrienko, G., and N. Andrienko. 2007. “Coordinated Multiple Views: A Critical View.” Paper presented at the the 5th International Conference on Coordinated and Multiple Views in Exploratory Visualization (CMV '07), Zurich, July 2, 72–74.
- Andrienko, G. L., and N. V. Andrienko. 1999. “Interactive Maps for Visual Data Exploration.” International Journal of Geographical Information Science 13 (4): 355–374. doi:10.1080/136588199241247.
- Anselin, L., I. Syabri, and O. Smirnov. 2002. “Visualizing Multivariate Spatial Correlation with Dynamically Linked Windows.” Urbana 51: 61801.
- Baum, S., W. Mitchell, and J. H. Han. 2008. “Socio-economic Performance across Australia's Non-Metropolitan Functional Economic Regions.” Australasian Journal of Regional Studies 14 (3): 215–149.
- Baumann, A., and G. Adviser-Grinstein. 2011. “The Design and Implementation of Weave: A Session State Driven, Web-based Visualization Framework.” Doctoral Thesis. University of Massachusetts Lowell, Lowell, MA.
- Boukhelifa, N., J. C. Roberts, and P. J. Rodgers. 2003. “A Coordination Model for Exploratory Multiview Visualization.” Paper presented at the Proceedings of International Conference on Coordinated and Multiple Views in Exploratory Visualization, (CMV'03), Washington, DC, July 15, 76–85.
- Boukhelifa, N., and P. J. Rodgers. 2003. “A Model and Software System for Coordinated and Multiple Views in Exploratory Visualization.” Information Visualization 2 (4): 258–269. doi:10.1057/palgrave.ivs.9500057.
- Buja, A., D. Cook, and D. F. Swayne. 1996. “Interactive High-dimensional Data Visualization.” Journal of Computational and Graphical Statistics 5 (1): 78–99.
- Buja, A., J. A. McDonald, J. Michalak, and W. Stuetzle. 1991. “Interactive Data Visualization Using Focusing and Linking.” Paper presented at the Proceedings of IEEE Conference on Visualization 1991 (Visualization '91), San Diego, CA, October 22–25, 156–163, 419.
- Butkiewicz, T., W. Dou, Z. Wartell, W. Ribarsky, and R. Chang. 2008. “Multi-focused Geospatial Analysis Using Probes.” IEEE Transactions on Visualization and Computer Graphics 14 (6): 1165–1172. doi:10.1109/TVCG.2008.149.
- Chang, R., M. Ghoniem, R. Kosara, W. Ribarsky, J. Yang, E. Suma, C. Ziemkiewicz, D. Kern, and A. Sudjianto. 2007. “WireVis: Visualization of Categorical, Time-varying Data from Financial Transactions.” Paper presented at the IEEE Symposium on Visual Analytics Science and Technology 2007 (VAST 2007), Sacramento, CA, October 30–November 1, 155–162.
- Chen, H. 2004. “Compound Brushing Explained.” Information Visualization 3 (2): 96–108. doi:10.1057/palgrave.ivs.9500068.
- Chi, E. H. 2000. “A Taxonomy of Visualization Techniques Using the Data State Reference Model.” Paper presented at the IEEE Symposium on Information Visualization 2000 (InfoVis 2000), Salt Lake City, UT, October 9–10, 69–75.
- Codd, E. F. 1970. “A Relational Model of Data for Large Shared Data Banks.” Communication ACM 13 (6): 377–387. doi:10.1145/362384.362685.
- Craglia, M., K. de Bie, D. Jackson, M. Pesaresi, G. Remetey-Fülöpp, C. Wang, A. Annoni, L. Bian, F. Campbell, and M. Ehlers. 2012. “Digital Earth 2020: Towards the Vision for the Next Decade.” International Journal of Digital Earth 5 (1): 4–21. doi:10.1080/17538947.2011.638500.
- Datta, A., and H. Thomas. 1999. “The Cube Data Model: A Conceptual Model and Algebra for On-line Analytical Processing in Data Warehouses.” Decision Support Systems 27 (3): 289–301. doi:10.1016/S0167-9236(99)00052-4.
- Delaney, P., and C. J. Pettit. 2014. “Urban Data Hubs Supporting Smart Cities.” Paper presented at the Research@Locate '14, Canberra, April 7–9, 13–25.
- Doleisch, H. 2007. “SimVis: Interactive Visual Analysis of Large and Time-dependent 3D Simulation Data.” Paper presented at the Simulation Conference, 2007 Winter, Washington, DC, December 9–12, 712–720.
- Dykes, J. A. 1997. “Exploring Spatial Data Representation with Dynamic Graphics.” Computers & Geosciences 23 (4): 345–370. doi:10.1016/S0098-3004(97)00009-5.
- Erbacher, R. F., and D. A. Frincke. 2007. “Hierarchical Linked Views.” Paper presented at the 5th International Conference on Coordinated and Multiple Views in Exploratory Visualization, CMV'07, Zurich, July 2, 35–46.
- Foulser, D. 1995. “IRIS Explorer: A Framework for Investigation.” ACM SIGGRAPH Computer Graphics 29 (2): 13–16. doi:10.1145/204362.204365.
- Gatalsky, P., N. Andrienko, and G. Andrienko. 2004. “Interactive Analysis of Event Data Using Space-time Cube.” Paper presented at the Proceedings of the 8th International Conference on Information Visualisation 2004 (IV 2004), London, July 14–16, 145–152.
- Graham, M., and J. Kennedy. 2001. “Combining Linking and Focusing Techniques for a Multiple Hierarchy Visualisation.” Paper presented at the Proceedings of the 5th International Conference on Information Visualisation (IV 2001), London, July 25–27, 425–432.
- Gray, J., S. Chaudhuri, A. Bosworth, A. Layman, D. Reichart, M. Venkatrao, F. Pellow, and H. Pirahesh. 1997. “Data Cube: A Relational Aggregation Operator Generalizing Group-by, Cross-tab, and Sub-totals.” Data Mining and Knowledge Discovery 1 (1): 29–53. doi:10.1023/A:1009726021843.
- Guo, D. 2003. “Coordinating Computational and Visual Approaches for Interactive Feature Selection and Multivariate Clustering.” Information Visualization 2 (4): 232–246. doi:10.1057/palgrave.ivs.9500053.
- Guo, D., J. Chen, A. M. MacEachren, and K. Liao. 2006. “A Visualization System for Space-time and Multivariate Patterns (vis-stamp).” IEEE Transactions on Visualization and Computer Graphics 12 (6): 1461–1474. doi:10.1109/TVCG.2006.84.
- Haber, R. B., and D. A. McNabb. 1990. “Visualization Idioms: A Conceptual Model for Scientific Visualization Systems.” Visualization in Scientific Computing 74: 93.
- Hardisty, F., and A. C. Robinson. 2011. “The Geoviz Toolkit: Using Component-oriented Coordination Methods for Geographic Visualization and Analysis.” International Journal of Geographical Information Science 25 (2): 191–210. doi:10.1080/13658810903214203.
- Hey, A. J., S. Tansley, and K. M. Tolle. 2009. The Fourth Paradigm: Data-intensive Scientific Discovery. Redmond, WA: Microsoft Research.
- Hienert, D., B. Zapilko, P. Schaer, and B. Mathiak. 2011. “Web-based Multi-view Visualizations for Aggregated Statistics.” Paper presented at the Proceedings of the 5th International Workshop on Web APIs and Service Mashups 2011, Lugano, 11:11–11:18.
- Jacobson, A. S., A. L. Berkin, and M. N. Orton. 1994. “LinkWinds: Interactive Scientific Data Analysis and Visualization.” Communications of the ACM 37 (4): 42–52. doi:10.1145/175276.175280.
- Jern, M., S. Johansson, J. Johansson, and J. Franzen. 2007. “The Gav Toolkit for Multiple Linked Views.” Paper presented at the 5th International Conference on Coordinated and Multiple Views in Exploratory Visualization, CMV'07, Zurich, July 2, 85–97.
- Kehrer, J., P. Filzmoser, and H. Hauser. 2010. “Brushing Moments in Interactive Visual Analysis.” Computer Graphics Forum 29 (3): 813–822.
- Kehrer, J., and H. Hauser. 2013. “Visualization and Visual Analysis of Multifaceted Scientific Data: A Survey.” IEEE Transactions on Visualization and Computer Graphics 19 (3): 495–513. doi:10.1109/TVCG.2012.110.
- Kehrer, J., P. Muigg, H. Doleisch, and H. Hauser. 2011. “Interactive Visual Analysis of Heterogeneous Scientific Data across an Interface.” IEEE Transactions on Visualization and Computer Graphics 17 (7): 934–946. doi:10.1109/TVCG.2010.111.
- Kimball, R. 1998. The Data Warehouse Lifecycle Toolkit: Expert Methods for Designing, Developing, and Deploying Data Warehouses. New York: John Wiley & Sons.
- Mackinlay, J. 1986. “Automating the Design of Graphical Presentations of Relational Information.” ACM Transactions on Graphics (TOG) 5 (2): 110–141. doi:10.1145/22949.22950.
- Martin, A. R., and M. O. Ward. 1995. “High Dimensional Brushing for Interactive Exploration of Multivariate Data.” Paper presented at the Proceedings of the 6th IEEE Conference on Visualization 1995, Atlanta, GA, October 29–November 3, 271.
- McDonald, J. A., W. Stuetzle, and A. Buja. 1990. “Painting Multiple Views of Complex Objects.” Paper presented at the Proceedings of the European Conference on Object-oriented Programming on Object-oriented Programming Systems, Languages, and Applications (OOPSLA/ECOOP '90), Ottawa, October 21–25, 245–257.
- North, C., N. Conklin, K. Indukuri, and V. Saini. 2002. “Visualization Schemas and a Web-based Architecture for Custom Multiple-view Visualization of Multiple-table Databases.” Information Visualization 1 (3–4): 211–228. doi:10.1057/palgrave.ivs.9500020.
- North, C., and B. Shneiderman. 1999. “Snap-together Visualization: Coordinating Multiple Views to Explore Information.” HCIL Technical Report No. 99–10.
- North, C., and B. Shneiderman. 2000a. “Snap-together Visualization: A User Interface for Coordinating Visualizations Via Relational Schemata.” Paper presented at the Proceedings of the Working Conference on Advanced Visual Interfaces 2000 (AVI '00), Palermo, May 23–26, 128–135.
- North, C., and B. Shneiderman. 2000b. “Snap-together Visualization: Can Users Construct and Operate Coordinated Visualizations?” International Journal of Human-Computer Studies 53 (5): 715–739. doi:10.1006/ijhc.2000.0418.
- Pattison, T., and M. Phillips. 2001. “View Coordination Architecture for Information Visualisation.” Paper presented at the Proceedings of the 2001 Asia-Pacific Symposium on Information Visualisation (APVis '01), Sydney, December 3–4, 165–169.
- Pettit, C., I. Widjaja, P. Russo, R. Sinnott, R. Stimson, and M. Tomko. 2012. “Visualisation Support for Exploring Urban Space and Place.” Paper presented at the XXII ISPRS Congress, Technical Commission IV, Melbourne, August 25–September 1.
- Pillat, R. M., and C. M. Freitas. 2006. “Coordinating Views in the InfoVis Toolkit.” Paper presented at the Proceedings of the Working Conference on Advanced Visual Interfaces 2006 (AVI '06), Venezia, May 23–26, 496–499.
- Roberts, J. C. 1998. “Waltz: An Exploratory Visualization Tool for Volume Data Using Multiform Abstract Displays.” Paper presented at the Visual Data Exploration and Analysis V (Proceedings of SPIE 3298), San Jose, CA, May 14, 112–122.
- Roberts, J. C. 2004. “Exploratory Visualization with Multiple Linked Views.” In Exploring Geovisualization, edited by J. Dykes, A. M. MacEachren, and M.-J. Kraak, 159–180. Amsterdam: Elsevier.
- Roberts, J. C. 2007. “State of the Art: Coordinated & Multiple Views in Exploratory Visualization.” Paper presented at the the 5th International Conference on Coordinated and Multiple Views in Exploratory Visualization (CMV '07), Zurich, July 2, 61–71.
- Roberts, J. C. 2008. “Coordinated Multiple Views for Exploratory GeoVisualization.” In Geographic Visualization: Concepts, Tools and Applications, edited by M. Dodge, M. McDerby, and M. Turner, 25–48. West Sussex: John Wiley & Sons.
- Roth, S. F., P. Lucas, J. A. Senn, C. C. Gomberg, M. B. Burks, P. J. Stroffolino, A. Kolojechick, and C. Dunmire. 1996. “Visage: A User Interface Environment for Exploring Information.” Paper presented at the Proceedings of the 1996 IEEE Symposium on Information Visualization (INFOVIS '96), San Fransisco, CA, October 27–November 1, 3–12, 116.
- Scherr, M. 2008. “Multiple and Coordinated Views in Information Visualization.” In Trends in Information Visualization, edited by D. Baur, M. Sedlmair, R. Wimmer, Y.-X. Chen, S. Streng, S. Boring, A. De Luca, and A. Butz, 38–45.
- Sinnott, R. O., C. Bayliss, G. Galang, P. Greenwood, G. Koetsier, D. Mannix, L. Morandini, et al. 2012. “A Data-driven Urban Research Environment for Australia.” Paper presented at the Proceedings of the IEEE 8th International Conference on eScience 2012 (eScience '12), Chicago, IL, October 8–12, 1–8.
- Stalling, D., M. Westerhoff, and H.-C. Hege. 2005. “Amira: A Highly Interactive System for Visual Data Analysis.” The Visualization Handbook 38: 749–767.
- Steinberger, M., M. Waldner, M. Streit, A. Lex, and D. Schmalstieg. 2011. “Context-preserving Visual Links.” IEEE Transactions on Visualization and Computer Graphics 17 (12): 2249–2258. doi:10.1109/TVCG.2011.183.
- Stolte, C., D. Tang, and P. Hanrahan. 2003. “Multiscale Visualization Using Data Cubes.” IEEE Transactions on Visualization and Computer Graphics 9 (2): 176–187. doi:10.1109/TVCG.2003.1196005.
- Takatsuka, M., and M. Gahegan. 2002. “GeoVISTA Studio: A Codeless Visual Programming Environment for Geoscientific Data Analysis and Visualization.” Computers & Geosciences 28 (10): 1131–1144. doi:10.1016/S0098-3004(02)00031-6.
- Thompson, B., T. O. Chan, R. Slee, P. Kinne, A. Jahshan, P. Woodgate, I. Bishop, and D. McKenzie. 2008. “Virtual Australia: Its Key Elements–Know, Think, Communicate.” International Journal of Digital Earth 1 (1): 66–87. doi:10.1080/17538940701782551.
- Tomko, M., P. Greenwood, M. Sarwar, L. Morandini, R. Stimson, C. Bayliss, G. Galang, M. Nino-Ruiz, W. Voorsluys, and I. Widjaja. 2012. “The Design of a Flexible Web-based Analytical Platform for Urban Research.” Paper presented at the Proceedings of the 20th International Conference on Advances in Geographic Information Systems (SIGSPATIAL '12), Redondo Beach, CA, November 7–9, 369–375.
- Wang Baldonado, M. Q., A. Woodruff, and A. Kuchinsky. 2000. “Guidelines for Using Multiple Views in Information Visualization.” Paper presented at the Proceedings of the Working Conference on Advanced Visual Interfaces 2000 (AVI '00), Palermo, May 23–26, 110–119.
- Ward, M. O. 1994. “Xmdvtool: Integrating Multiple Methods for Visualizing Multivariate Data.” Paper presented at the Proceedings of the Conference on Visualization 1994, Washinton, DC, October 17–21, 326–333.
- Weaver, C. 2004. “Building Highly-coordinated Visualizations in Improvise.” Paper presented at the Proceedings of the IEEE Symposium on Information Visualization 2004 (InfoVis 2004), Austin, TX, October 10–12, 159–166.
- Weaver, C. 2010. “Cross-filtered Views for Multidimensional Visual Analysis.” IEEE Transactions on Visualization and Computer Graphics 16 (2): 192–204. doi:10.1109/TVCG.2009.94.