
Abstract
Sensor networks are an essential tool for environmental scientists. As scientists and engineers are beginning to utilize these new methods and devices in their fieldwork, they need to be actively involved in the future of sensor-networking development. Continued sensor network innovation is important for improved standardization, affordability, and interoperability. This article uses a storm water case study to outline an end-to-end open-innovation sensor network. Open innovation by scientists, engineers, and entities is the collaborative process of creating value for this project in permeable paver runoff data and advances within sensor networking. This article focuses on the technical implementation of the near–real-time location and temporally aware sensor network. Data are streamed in near–real-time with subliter precision to the cloud using common off-the-shelf routers. The sensors use Maxim's 1-wire™ protocol, and the unique digital serial numbers confirm the data. The data retrieved compare residence times within the permeable paver catchment basins and the control basin. Sensor network advances are made by bridging the gap between sensor protocols and communication systems. These advances enable the development of open-source representational state transfer web services. Our successful implementation serves as an example for others to study and expand upon for a variety of monitoring solutions.
1. Introduction
1.1. Problem: in situ monitoring of storm water runoff
The urban environment in the twenty-first century continues the science it has sought since the days of the Indus Valley Civilization to cleanse the city of death, disease, and inefficiency. Engineering has created solutions to sanitation, transportation, and drainage. Cities have become delivery and disposal systems supporting a network designed to deliver service to support commerce and culture. However, examining this environment with a ‘City as Infrastructure’ approach makes a new undeniable challenge apparent. Antiquated technology is prevalent throughout the infrastructure of today's cities. Here in Cincinnati the sewers that carry the urban runoff were installed in 1815, nearly 200 years ago and our water intake system was installed 150 years ago. These are just two of the many aging systems creating new problems. Are these aging infrastructures going to be able to support growing urban populations and handle potential climate changes and stresses? These difficult questions require better information relevant to these infrastructures. This paper addresses the problem of designing and building low-cost (standardized) geospatial sensor networks for monitoring storm water runoff.
Sensor networking is very complex with many moving parts; however, there have been significant technical advances. Innovations within each part of the sensor network infrastructure from the sensors to the sensor nodes and server technologies have helped to improve implementations. In particular, improvements within embedded devices have been driven by the smartphone market and the popularity surrounding the Internet of Things (IoT). The IoT may be defined as having computers sense information without the aid of human intervention expanding the Internet to include objects that are both sensing and interacting with the environment (Gubbi et al. Citation2013). Gartners IT Hype Cycle has identified the IoT as one of the emerging technologies in IT. In 2011, this interest was further justified as the number of interconnected devices on the planet passed the total number of people (Gubbi et al. Citation2013). The IoT, as characterized by Atzori, Iera, and Morabito (Citation2010), is composed of three paradigms; sensing, middleware, and the semantic. With sensor-networking research comprising these paradigms, it is essential that the IoT trends are considered and incorporated. Within these paradigms exist particular IoT elements relative to our work, including modular middleware, secure data aggregation, uniquely identifying things, and visualization (Gubbi et al. Citation2013). Along with the sensors and middleware, the web services are an area needing additional research (Liang, Croitoru, and Tao Citation2005). By innovating within web services, we are contributing toward the integration of sensor data with Linked Data. Linked data have become the most promising vision for the Future Internet and has been widely adopted by academia and industry (Janowicz et al. Citation2013). However, currently sensor networking and spatial data infrastructure can only act to a limited degree with the semantic web (Janowicz et al. Citation2013).
Along with these IoT trends is the importance of interoperability within end-to-end networks. Even with the many moving parts in sensor network implementations, there is overwhelming consensus that in situ sensing needs to provide the ability to share information across platforms through a unified framework (Gubbi et al. Citation2013; Sempere-Pay´a and Santonja-Climent Citation2012; Sang et al. Citation2006). The lack of consistent standards both raises the cost for implementation and creates isolated systems and development. The result is expensive custom in situ implementations even with the dropping cost of smart devices. There exists a standards gap in in situ sensor network standardization from the sensor to the web services (Jirka, Brring, and Stasch Citation2009). This gap is further exposed in the previous works section as sensor-networking development has traditionally been influenced by top–down large sensor platform development. The result is a challenge for affordable, easy-implementable in situ sensor networks.
Our work is striving to contribute to a modular standardized framework to create low-cost plug-and-play sensors forming in situ sensor networks while incorporating IoT elements. Data are to be streamed in near–real-time with subliter precision to the cloud using common off-the-shelf routers (COTS) to monitor permeable pavers. We consider our network to operate in near–real-time; however, the time delay is only a couple minutes from observation to publication. The sensors use Maxim's 1-wire™ protocol, and the unique digital serial numbers confirm the data authenticity and location. The data retrieved will compare residence times within the catchment basins of the various pavers and the control. Residence time is the average amount of time for a particle of water to travel through the catchment basin. The project also enables open innovation for sensor network advancement. It is vital that scientists as well as engineers play a vital role in guiding the sensor-networking revolution (Hart and Martinez Citation2006). Software and hardware testing will be incorporated into the project for increased scalability, affordability, and interoperability. The article begins by examining the previous work and study area followed by a methodology section focusing on the technical implementation of a near–real-time location and temporally aware sensor network. Each part of the sensor network architecture will be examined including the sensors, sensor relay, and servers. The article concludes with statistical and qualitative results discussing both the data and sensor advances of the open-innovation network.
1.2. Previous work
The Pacific Ocean is home to some of the most ground-breaking research regarding whales, seismic activity, and sensor networks. This research is a result of one of the first sensor networks ever implemented. The Sound Surveillance System (SOSUS) was a network of underwater acoustic sensors and shore-based listening posts (Amato Citation1993). SOSUS was implemented in the 1950s as a result of sonar innovation during World War I and World War II for defense and military operations. SOSUS was followed by air defense radars in the 1960s in which multiple sensors were used to detect aircraft and other military assets. Modern research on sensor networks began in the 1980s with the Distributed Sensor Networks program at Defense Advanced Research Projects Agency (DARPA) (Chong and Kumar Citation2003). The director of the Information Processing Techniques Office at DARPA, R. Kahn wanted to know whether the Arpanet approach for communication could be extended to sensor networks (Chong and Kumar Citation2003). Kahn's aspirations were the same goals we are still striving for today – spatially distributed low-cost sensors working together. The sensors implemented at that time were acoustic arrays including a mobile node with a truck equipped with generators and computer hardware. The technology of small yet affordable sensors was not adequately developed (Chong and Kumar Citation2003). The early research, with technology limitations and a military focus, contributed to a top–down large sensor platform standardization approach.
The comprehensive concept for sensor networks was not introduced until 1997 as ‘Sensor Web’ by Kevin Delin. Delin later defined the comprehensive concept as ‘allows for the spatial-temporal understanding of the environment through coordinated efforts between multiple numbers and types of sensing platforms, including both orbital and terrestrial and both fixed and mobile’ (Delin Citation2002; Delin et al. Citation2005). In 1998 the scientific and technology community was inspired by Vice President Al Gore who coined the term ‘Digital Earth.’ Digital Earth was the vision of a multiresolution, three-dimensional representation of the earth with vast quantities of georeferenced data (Gore Citation1998). While both a comprehensive concept and the vision of a Digital Earth provide excitement and inspiration within sensing, the difference between the vastly different end-to-end architectures within sensing must not be forgotten. In 2001 the Sensor Web standards communication was taken on by the Open Geospatial Consortium (OGC), and today the OGC standards are continually being developed within its Sensor Web Enablement (SWE). However, SWE standards are based on Simple Access Protocols (SOAP) suited for more complex processes while the developing IoT is using Representation state transfer (REST) web services demonstrating a significant gap in research. It is expected that in 2015 the first standardized RESTful approach to web services for in situ sensor networking will be published. SWE standard research and the IoT are slowly beginning to demonstrate cross-development (Br¨oring, Remke, and Lasnia Citation2012; Guinard et al. Citation2009; Janowicz et al. Citation2010, Citation2013; Mazzetti, Nativi, and Caron Citation2009). Also, an emerging concern in the Sensor Web is the ability to have plug-and-play sensors (Broering et al. Citation2010; Jirka, Brring, and Stasch Citation2009). The challenge is to create standards throughout the network from the lower level at the semiconductor protocol level, into the communication intermediary services and finally into the server layer (Br¨oring et al. Citation2011). The OGC SWE web services are based at the server layer creating significant distinction among the standards within the network and resulting in challenges for plug and play (Broering et al. Citation2010). More work needs to include the research of integrating sensor into the SWE services architecture because the details of end-to-end networks have not been specified (Jirka, Brring, and Stasch Citation2009).
Storm water sensor network research and case studies primarily began in the 1990s. The implementations would focus on three goals: (1) monitoring of storm water, (2) increase efficiency of current infrastructure with real-time controls, or (3) automation of water treatment plants (Wiese et al. Citation2003; Pfister and Cassar Citation1999; Kopecny et al. Citation1999). More recent research has not only focused on alternative storm water solutions such as green technologies but improvements within sensor networking (Sempere-Pay´a and Santonja-Climent Citation2012; Yu, Behera, and Rochac Citation2011; Ruggaber, Talley, and Montestruque Citation2007; Bliss, Neufeld, and Ries Citation2009). Sensor networks are too complex and expensive, resulting in limited coverage (Sempere-Pay´a and Santonja-Climent Citation2012). The solution to affordability and complexities is sensor-networking standardization through open innovation. The concept of open innovation (Chesbrough Citation2003) is well positioned to serve as a mediating, exploratory, and validating approach for sensor networking (Schaffers et al. Citation2011). Living lab-driven innovative ecosystems help to solve the challenge of sensor networking, urban development policies, and open user–driven innovation (Almirall and Wareham Citation2008).
2. Experiment
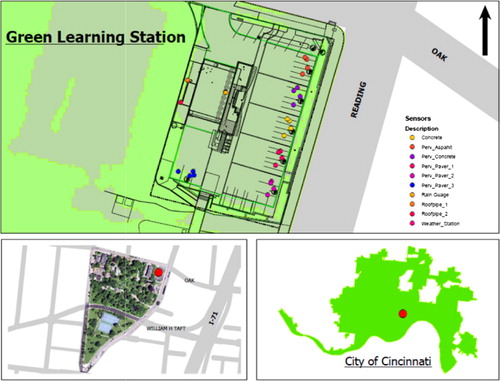
2.1. Study area: Green Learning Station at the Civic Garden Center
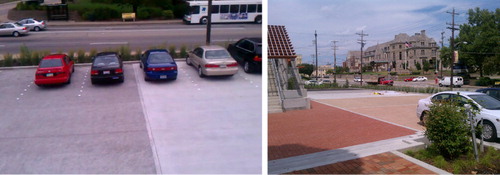
Cincinnati is plagued with storm water runoff issues because of the hilly topography, clay soils, and aging sewer infrastructure. The Green Learning Station is part of the Metropolitan Sewer District of Greater Cincinnati (MSDGC) green demonstration projects examining the storm water runoff impacts of green technologies including pervious pavements, bioswales, and rainwater harvesting. The site is located within the service region of the MSDGC within Hamilton County and the city of Cincinnati (). Phase 1 of the sensor network implementation was collecting data on the flow and volume of storm water runoff relative to precipitation on the permeable pavers. Permeable pavement allows storm water to infiltrate into either a storage basin or soil (EPA Citation1999). It has been shown that the use of permeable pavement decreases surface runoff and lowers peak discharge (Pratt, Mantle, and Schofield Citation1995; Booth, Leavitt, and Peterson Citation1996; Hunt, Stephens, and Mayes Citation2002) decreasing the number of combined sewer overflows (CSOs). The Green Learning Station project at the Civic Garden Center is a response to the municipal system challenges with storm water. More precisely, the Green Learning Station is a test site for green technologies to help reduce CSOs.
2.2. Environment
The purpose of the Green Learning Station research station was to measure residence times of various pervious pavement compared to the control. Six pavement types were used in the construction of this research area and parking lot (). Five of the pavements were facing the front of the research facility while one was on the side. Each pavement zone was 7.96 × 13.9 m (26.1 × 45.5 ft) with a 1.5-m (5 ft) concrete barrier separating the zones. The front five zones together were 41.99 × 13.9 m (137.75 × 45.6 ft). Each zone was approximately 113.4 m2 (1221 ft2) in area. The whole site was approximately 703.2 m (7570 ft2) in area. Each zone was 0.91-m (3 ft) deep with the bottom consisting of a plastic liner on top of a concrete bed. Above the concrete was a 0.3-m (1 ft) cobble-sized rock, 0.3 m (1 ft) of gravel, and 0.3 m (1 ft) of pea gravel in which the surface material was laid. Additionally, there was a baffled, T-shaped, PVC pipe running down the center line which emptied into the catchment. The slope of each zone was between 10 and 15 degrees. Zone 3 was the control zone as it was filled with nonpervious concrete. The control runoff is routed into the manhole via the holes in the manhole cover. Zones 1 and 2 were filled with pervious asphalt and pervious concrete. Zones 4, 5, and 6 were filled with different types of pervious cobblestone. Per 2.54 cm (1 in) of precipitation, each zone should have yielded approximately 2865.6 liters (757 gallons) of water. The whole site should have yielded 17,764.9 liters (4693 gallons) per 2.54 cm of precipitation assuming no evaporation or transpiration.
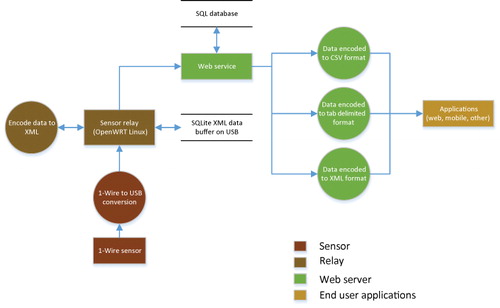
2.3. Methodology
Our methodology is summarized in a data flow diagram (). Sensor data were collected using single-board embedded systems running the OpenWRT Linux operating system, referred to herein as the sensor relay. OpenWRT was chosen because it is a small embedded Linux distribution designed specifically to work with off-the-shelf home routers. It can run on embedded Linux systems that only have 4-MB to 8-MB of storage capacity. Using off-the-shelf routers as single-board computers allowed us to reduce costs, as home routers are priced for consumer markets and, at the time of this study, were considerably cheaper than equivalent embedded boards such as the Beagle Bone series. OpenWRT had a very large and active support community, and independent developers continue to support newer products. Using OpenWRT would allow us to move to different routers and embedded boards without altering the program code. Another reasonable alternative that was considered was DD-WRT, which was based on the same project as OpenWRT, but DD-WRT was excluded as its development moved in a more commercial approach.
LtSense is a custom application written in the Python programming language. Python was chosen as our development platform because it is a modern language with a strong development community, a robust standard library, and it has an embedded interpreter that fit on the limited space of our sensor relays. Other alternatives, such as Ruby, did not have OpenWRT packages at the time or were too large to run on embed hardware. Normally, space constraints on embedded systems result in developers using C/C++, but our sensor relays had the capacity so that we could make a space trade-off for using a more modern language like Python.
1-Wire sensors were used for data collection. These sensors were affordable and could be attached to our sensor relays via Universal Serial Bus (USB). 1-Wire sensors use only a single cable for multiplexing both power and data readings. They also had existing driver support in Linux by means of an open-source project known as One Wire File System (OWFS) that had an active development community. Being able to leverage these existing drivers allowed us to quickly integrate them into our Python application.
LtSense queried 1-wire sensors wired in series at a preset sample rate of once per minute. Two sensors were wired to each test site: one temperature and one counter for a tipping bucket that served as a flow meter. The sensor network was wired, rather than wireless, in order to simplify our infrastructure. Outdoor Ethernet cable was placed in a conduit running underneath the permeable pavement connecting the sensors to the relays. One-wire uses the single wire for both the data and power requirements of the network. In addition, there were two rain gauges above the primary building at the site wired into our sensor network to monitor rainfall levels.
Our implementation streams XML from the relay to the web services on the server. No SWE standards were used in establishing this XML, but as research continues, distinctions will be made between the higher and lower level protocols to create standards throughout the network for plug-and-play applicability. Lower level and intermediary protocols must be approached differently than standardized higher level protocols. The lowest level is created and implemented to match the design and limitations of the hardware. For our network the 1-wire protocol was established by Maxim, a semiconductor company. The intermediary protocols were defined within the relay. The intermediary protocols were chosen for minimalism on the following assumptions: reduction of data redundancy, reduction of data size for streaming, reduction of local storage needs, and reduction of local power. Once the data reached our server protocols of the database, then SWE services could be implemented.
2.3.1. 1-Wire sensors
The primary sensor at each permeable paver test area is for water volume and flow. As water flows through the meter chamber, a disk seasaws or nutates about its axis (). Each seasaw of the disk allows a known volume of water to pass. A magnet in the disk trips the reed switch connected to a counting chip sensor measuring the number of seasaws. The water meter measures the amount of water volume and flow in the system for each test paver. For pavements 1, 2, 3, and 4, each tip of the rocker indicated a volume of 0.28011 liters. Pavement 5 used a modified Neptune water meter and had a rocker volume of 0.14 liters. Pavement six was monitored, but the data will not be included in the comparisons because of the inconsistent basin slope and size compared to the other surfaces.
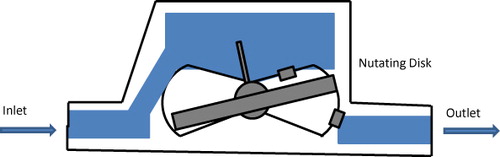
It is important to note that the seasaw is not measuring runoff itself, but the volume of water that is pumped out of each manhole or pit. The water level must reach a height approximately 0.9 m (1 ft) for the pump to activate and push the water through the sensor. If water volume increases are detected, a minimum volume rise of 227 liters (60 gallons), with a variance of ±76 liters (20 gallons), is recorded with each pumping event. Because of this method of measurement, to gain meaningful values from the data, the volume of water extracted from each pit must be aggregated over a period of time in order to gauge the effect of a rain event.
The rain gauges had tipping buckets manufactured as a RAINEW rain gauge by RainWise with a 1-wire DS2423 counter chip from Dallas Semiconductor, calibrated to measure 0.254 mm per tip of the rocker (1/100th of an inch). At the core of the rain gauge is a pair of buckets connected to a central axis like a seesaw. A funnel collects rain and empties it into one of the buckets. When the bucket fills, it tips over and the other bucket takes its place. When the buckets tip, a reed switch connected to a 1-wire counter chip is briefly closed by a magnet on the bucket. Since the bucket's volume is known, the count can be used to measure the amount of rainfall.
2.3.2. Relay queue
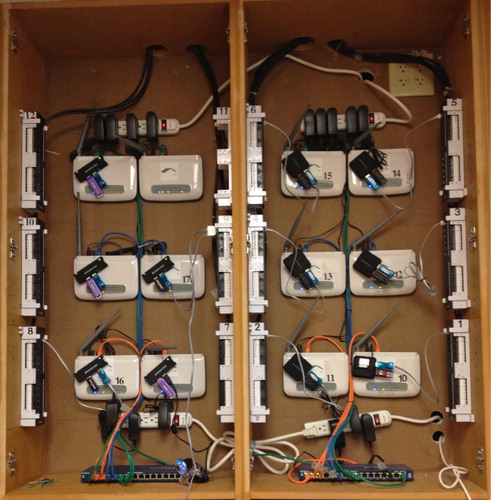
Each permeable paver test basin was equipped with its own relay (modified router) that connected the sensors to the network (). In the event that the web service was unavailable or there was a network failure, the XML data would queue on the relay until the service was restored. There were two data-queuing options at the relay level. The first was an in-memory queue, and the second involved reading and writing the queue from a SQLite database located on a USB memory drive connected to the embedded system on the relay. The advantage of using the database over the memory queue was that the queue would not persist after power outages. The in-memory queue would be reset, not only if power was cycled to the sensor relay but also if the LtSense application was restarted. Therefore, the database option was preferred and adopted. Calculations for both flow rate and volume were processed on the sensor relay (modified router) based on the count from the tipping sensors. 1-Wire only allowed us to identify a sensor by type (e.g. Temperature or Counting). With this limitation, the sensor relay had to be configured for a specific volume per tip for all counting sensors attached to it. Two counting sensors that counted fluid of different volumes could not be attached to the same sensor relay.
2.3.3. Relay security
Initially, both the sensor relays and the web service were within the same virtual private network (VPN). The web service was hosted at the Geography Department at the University of Cincinnati while the individual sensor relays were housed at the Green Learning Station. The network for the sensor relays at the Green Learning Station was separate from the rest of the center's primary network, so a VPN tunnel based on OpenVPN was established between the two sites. This initially resulted in a passive security model that depended on sensor relays being on the same network (either real or virtual). The current security model allows for the sensor relay to be on a public network, removing the previous limitation. This is accomplished using RSA (cryptosystem) keys and signature verification. The original XML data, before being transmitted, is signed digitally using a preshared RSA private key. The server can verify the authenticity of the delivered XML payload by using the RSA public key to validate the signature.
2.3.4. Web service
The data were transported in our own XML format to BigSense. BigSense is a web service written in the Scala programming language that collects and aggregates the data. Scala was chosen as our web service language because it ran on the Java Virtual Machine (JVM), a mature environment used for many large-scale web applications. It added additional functionality and provided a more easily readable and maintainable code than Java, while still maintaining full byte-code compatibility with the JVM. With Scala, we could leverage existing Java architectures and libraries while gaining language enhancements that could reduce development time.
Scala had built-in language support for XML. We decided to use our own custom XML format for the data transfer since the OGC XML were primarily designed for the user-based server level. The web service was also written in such a way that we could add new XML formats in the future should we chose to support them. Once transferred from the relay to BigSense, the XML file is parsed into a Structured Query Language (SQL) database using customized web services. The data are also published by BigSense, and the process is explained further in subsection 2.3.7.
2.3.5. Spatial data
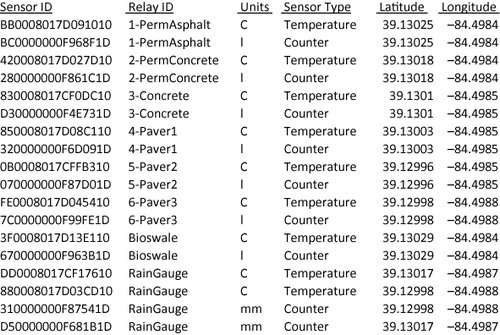
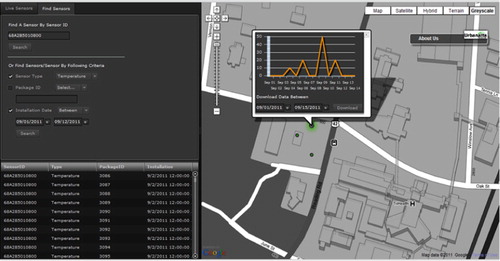
A Trimble differential Global Positioning System (GPS) unit was used to gather latitude and longitude for each sensor location. Our GPS base station was the Cincinnati/Northern Kentucky International Airport (CVG), and the coordinates were accurate to within 13 cm in the horizontal plane. World Geodetic System of 1984 was used as the standard coordinate frame for the location information. The 1-wire unique ID for each sensor was used to create a column within the spatial data to be used as a primary key. Once the 1-wire sensor was installed, the unique ID was used to register the sensor within our network. The unique ID is a 64-bit ROM ID that allows for multiple sensors to be on a single bus. Our temperature and counter sensors within each test paver are on the same bus or relay (modified router). Unique ids associated with the sensors, enable authentication and integration with sensor metadata. If a sensor is replaced, the new unique ID is recognized on the 1-wire bus and can be used for automatic registration. With the possible addition of a GPS-enabled relay, the sensor replacement could be automatically recognized and updated within the system. The ease of replacement is a result of the embedded unique 1-wire ID. shows a list of sensors by their unique identifier, the relays they are attached to, as well as the type of measurement units, type of sensor, and the latitude and longitude coordinates at which they were installed.
2.3.6. Data interpretation
The BigSense web service stored three types of data from the sensor relays: temperature, the current volume, and the current flow rate of water from a counting sensor in the manhole below each pavement test surface. Each counting sensor had a watch battery in it, allowing the count to be retained even after a power outage, regardless of what type of queue was used on the sensor relay. The latest count was always saved to the USB flash memory on the sensor relay, and all calculations for flow rates and volumes were done on the sensor relay itself. Each sensor relay was configured so that counting sensors would be given a bucket size and a unit of measure. Each counter would report to the web service as two different sensors, a volume sensor and a flow rate sensor. Volume was simply calculated as the bucket size multiplied by the current count value. Flow rate was calculated as taking the difference of two measurements at the sensor relays default sample rate, finding the unit rate (1 second), and reporting the data as the units over seconds.
2.3.7. Aggregation
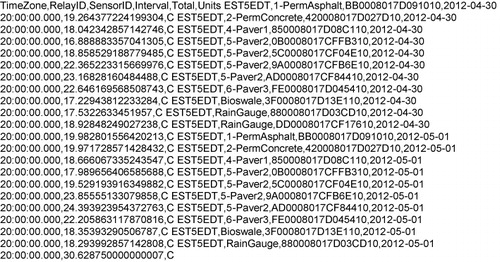
Water volumes and flow rates were dependent on when the pump for the collection pits turned on. After or during rain events, the pits would have to fill up before the pumps would activate, thereby causing the sensors to detect flow. Therefore, there were intervals with zero flow during a mild rain event. To deal with this type of system, the web service allowed for queries to average sensor results over a given amount of time. For example, the query in returns the average temperatures between the date range of 1 May 2012 to 5 May 2012 for interval ranges of 1440 minutes (1 day) in metric units for the US Eastern time zone in a comma-separated value (csv) format. An example with water measurements can be seen in . The query returns the total volume of water, measured with the counting sensors, for interval ranges of 1440 minutes (1 day) in metric units for the US Eastern time zone in a csv format.
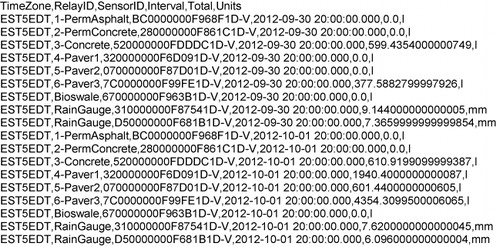
Three functions for aggregation were implemented. Aggregation could be done for average (mean) temperatures, average (mean) flow rates and total volume of water divided by a time interval in minutes. Queries could be performed either by date ranges or by UNIX time stamps in seconds. Several formats were supported including csv, tab delimited (txt), HTML data table (table.html), flat XML (flat.xml) and a proprietary XML format (go.xml). The results from the web service are human readable, but they are not intended to be consumed directly. The HTML data table format is the best for readability and diagnostics, but the reason for supporting terse formats is to allow the web service to be used by other front-end web applications that could use the service to provide both real-time and aggregate data to the end user in readable layouts, graphs, and charts. The basic pattern of the query allows developers to easily see what data are being selected as well as providing a unique location for a given dataset. This is known as a representative state transfer or REST web service.
3. Experimental results
Preliminary rain gauge data analysis was completed for December 2011. These were the first sensors to be statistically verified since the water data aggregated from the pavers were dependent on the rain gauge data collected at the Green Learning Station. Rainfall data were examined for December 2011 for two rain gauges, which will be referred to as ‘D5’ and ‘31.’ In order to determine if D5 and 31 were registering the same rainfall totals, an independent-samples t-test was performed because it compares the mean values (in this case rainfall totals) of two different groups (in this case rain gauges D5 and 31). It is important to note that all statistical assumptions were met (i.e. there were no violation of assumptions) before conducting any of the following analyses. Results from the independent-samples t-test revealed that there was no statistically significant difference in rainfall totals reported for D5 (mean = .218214286535714; standard deviation = .533791841618124) versus 31 (mean = .192500001714286; standard deviation = .489456426302576) in December 2011 (t-calculated = 0.188, p-value = 0.852, σ = 0.05). The magnitude of the differences in the means was very small (eta squared 0.000654). Next, we wanted to compare the rain gauge data from D5 to CVG for December 2011. Therefore, a second independent-samples t-test was conducted. The results revealed that there was no statistically significant difference in the mean rainfall totals registered between D5 and CVG (t-calculated = −0.103, p-value = 0.918, σ = 0.05).
Early permeable paver runoff data from the water meters were unreliable due to electromagnetic interference from outside sources. Additional shielding and shorter wires between the sensors and the Ethernet connectors resolved the interference issues. With interference resolved, the counter sensors had no other maintenance issues. Once the sensor relays went through a testing period, all the relays performed consistently without issues. Reliable permeable paver runoff data for analysis were available in late winter and spring of 2012. The MSDGC and the Environmental Protection Agency (EPA) were interested in examining the residence time of each permeable paver and compare them to the control. confirms that the data are producing reasonable results. The volume of water traveling through each permeable paver is relative to the size of the catchment areas (5 mm of rain, left chart, produces 560 liters of water per catchment area, right chart). The right chart in also shows the control pavement having the steepest rising and falling limbs. MSDGC and EPA are currently analyzing the data.
4. Discussion
Our sensor network implementation helps to solve the problem of designing and building low-cost (standardized) sensor networks for monitoring storm water runoff. It should be noted that the experimental configuration included manholes for collecting storm water runoff as designed by the EPA and MSDGC. Measuring runoff was dependent upon the activation of the water pump within the manhole. The pump would activate when the water depth exceeded 1 ft and stop when the water level returned to the 1-ft level. If runoff from the storm events did not activate the pump, the runoff would not be measured. This monitoring limitation may not allow for estimation of the total rainfall amount or the residence time, which are both important variables for CSOs. Limitations were also encountered with the use of the Maxim DS2423 1-wire counter chip. Both storing and calculating the count function was intensive and resulted in a limitation of one counting chip per sensor relay. However, using an alternative sensor or including additional sensors is made relatively easy with the use of the open-source software OWFS.
Home routers were chosen as sensor relays initially due to their low costs as single-board computers. In recent years, the introduction of the Raspberry, Pi has greatly reduced the price in the single-board market. Embedded systems like the Raspberry, Pi, the Beagle Bone, and others have several advantages such as general input/output pins, built-in analog-to-digital converters, and significantly higher storage capacity. The larger capacities mean these systems are not limited to small Linux distributions such as OpenWRT, but can run full-sized distributions such as Ubuntu and Arch. In addition to single-board computers, the Arduino has made its way into the market as a very low cost programmable microcontroller. This could help facilitate creating self-calibrating sensors, simplifying the role of the sensor relay. For example, an Arduino could be attached to both a compass and a windy direction sensor and programmed to determine which angle is North. The Arduino could then report that data to a sensor relay without the relay software needing to be specifically configured for that sensor.
The OGC SWE standards were considered for all levels of the network. The XML format for the data was originally chosen for the possible inclusion of OGC standards for the data feed. With the OGC standards primarily focused on the server and user-level standards, none of the OGC standards were implemented. Communication from the relay to the server required maximum efficiency considering energy and data size restrictions resulting in custom XML formats. Current developments are focused on using JavaScript Object Notation, an easier to use alternative for the data feed. SWE SOAP services were considered for the server but were abandoned for REST web services. REST provides a smaller footprint on the relay and server while lowering the development entry point for application integration. The REST web services were easy for the development team to query the data and integrate into the web application. The only issue with the web services was the importance to incorporate a spatial component into all the services. The web application development required additional programming to create a connection between the sensor data and sensor location without a consistent spatial component. These frustrations demonstrated the need for a standard on spatial data inclusion in a RESTful approach. The OGC and Steve Liang are currently hoping to publish a standard in the fall of 2014 for spatial data inclusion in a RESTful API. Standardization of the API would have simplified our development of both the services and the applications.
The Consortium of Universities for the Advancement of Hydrologic Science, Inc's (CUAHSI) WaterML-encoding standard also was considered at the server level as an additional service. CUAHSI recently created the most relevant XML standard, WaterML, for hydrology data publication at the server level, but this standard was not yet OGC compliant in the fall of 2011 (Ames et al. Citation2009) during the network installation. This standard was not implemented considering the lack of OGC compliance of WaterML 1.0. Database conversion to the CUAHSI's schema was possible once WaterML 2.0 was released. WaterML 2.0 was approved as an OGC standard in the fall of 2012.
5. Conclusion
Our open-innovation geospatial sensor network bridged the lower level sensor protocols into the communication layer with the development of a COTS-modified router as a sensor relay. The work contributed to sensor research and the IoT with modular relays, secure data feeds, unique identification of sensors, and web service aggregation for visualization. In addition, these advancements created affordability and scalability by utilizing and creating open-source software. These developments further enabled the implementation and testing of sensor standards and the utilization of the IoT RESTful web services approach. The simple and easy data access through the web services enabled our team to easily monitor the system during the testing and implementation phase. This access to the near–real-time data also promoted continued improvements to the web services such as improved aggregation, data format inclusion, and unit conversion. Our data demonstrated that an affordable, scalable, and interoperable system was within the capabilities of a well-rounded team of engineers working with supporting sensor and hardware providers.
The open-innovation approach to geospatial sensor networking provided some significant insights and advances. Scientists and engineers gained interest and extensive experience during the implementation. During construction, the electrician and plumber were included in meetings to understand the sensor installation and advice on the infrastructure implementation. These meetings resulted in the construction manager designing a sensor housing for installation in the permeable pavers for Phase 2 of the Green Learning Station. Phase 2 is to install pressure sensors into the catchment areas to more closely monitor the runoff process. Also, a biology professor approached us with interest in expanding our network into water quality and green roof monitoring, the 1-minute time interval would enable a new scale of modeling for his work. The WaterML 2.0 integration interested the civil and environmental engineers at the university. The semiconductor company, Maxim Integration, donated all the sensors for the project expressing interest in the possibilities to expand their sensor integration capabilities. The creative process of the project continued to enable and motivate innovation throughout the geospatial sensor network.
The result is a project that has continued to create opportunities to expand beyond its original research focus of storm water monitoring. We have recently been approached by a scientist to deploy sensors in extreme remote environments with electricity and sporadic Internet. These deployment limitations require a GPS, adjustable sensor intervals, and large data storage. The creativity within open innovation begins to develop alternative solutions to difficult challenges faced within sensor networking. The flexibility of the geospatial sensor network continues to be applied to various projects around the university and the community. Future work will discuss these implementations with advances in plug-and-play and extreme remote environment sensor networking.
References
- Almirall, E., and J. Wareham, 2008. “Living Labs and Open Innovation: Roles and Applicability.” The Electronic Journal for Virtual Organizations and Networks 10 (3): 21–46.
- Amato, I. 1993. “A Sub Surveillance Network Becomes a Window on Whales.” Science 261: 549.
- Ames, D., J. Horsburgh, J. Goodall, T. Whiteaker, D. Tarboton, and D. Maidment. 2009. “Introducing the Open Source CUAHSI Hydrologic Information System Desktop Application (HIS Desktop).” 18th World IMACS Congress and MODSIM09 International Congress on Modelling and Simulation, Modelling and Simulation Society of Australia and New Zealand and International Association for Mathematics and Computers in Simulation, Cairns, Australia, July 2009.
- Atzori, L., A. Iera, and G. Morabito. 2010. “The Internet of Things: A Survey.” Computer Networks 54: 2787–2805. doi:10.1016/j.comnet.2010.05.010.
- Bliss, D. J., R. D. Neufeld, and R. J. Ries. 2009. “Storm Water Runoff Mitigation using a Green Roof.” Environmental Engineering Science 26 (2): 407–418. doi:10.1089/ees.2007.0186.
- Booth, D. B., J. Leavitt, and K. Peterson. 1996. “The University of Washington Permeable Pavement Demonstration Project Background and First-Year Field Results.” Accessed March 10, 2014. https://digital.lib.washington.edu/xmlui/handle/1773/17031.
- Broering, A., T. Foerster, S. Jirka, and C. Priess. 2010. “Sensor Bus: An Intermediary Layer for Linking Geosensor Networks and the Sensor Web.” COM.Geo 2010: 1st International Conference on Computing for Geospatial Research and Applications, Washington D.C., June 2010.
- Bröring, A., J. Echterhoff, S. Jirka, I. Simonis, T. Everding, C. Stasch, S. Liang, and R. Lemmens. 2011. “New Generation Sensor Web Enablement.” Sensors 11: 2652–2699.
- Bröring, A., A. Remke, and D. Lasnia. 2012. SenseBox—A Generic Sensor Platform for the Web of Things. Mobile and Ubiquitous Systems: Computing, Networking, and Services. Berlin Heidelberg: Springer, 186–196.
- Chesbrough, H. W. 2003. Open Innovation: The New Imperative for Creating and Profiting from Technology. Boston, MA: Harvard Business Press.
- Chong, C. Y., and S. P. Kumar. 2003. “Sensor Networks: Evolution, Opportunities, and Challenges.” Proceedings of the IEEE 91: 1247–1256. doi:10.1109/JPROC.2003.814918.
- Delin, K. A. 2002. “The Sensor Web: A Macro-instrument for Coordinated Sensing.” Sensors 2 (7): 270–285. doi:10.3390/s20700270.
- Delin, K. A., S. P. Jackson, D. W. Johnson, S. C. Burleigh, R. R. Woodrow, J. M. McAuley, J. M. Dohm, et al. 2005. “Environmental Studies with the Sensor Web: Principles and Practice.” Sensors 5 (1): 103–117. doi:10.3390/s5010103.
- EPA. 1999. “Storm Water Technology Fact Sheet: Porous Pavement”. Accessed February 15. http://yosemite.epa.gov/water/owrccatalog.nsf/1ffc8769fdecb48085256ad3006f39fa/e60fc08b01f9dc385256d83004fd8ed!
- Gore, A. 1998. “The Digital Earth: Understanding Our Planet in the 21st Century.” Australian Surveyor 43 (2): 89–91. doi:10.1080/00050348.1998.10558728.
- Gubbi, J., R. Buyya, S. Marusic, and M. Palaniswami. 2013. “Internet of Things (IoT): A Vision, Architectural Elements, and Future Directions.” Future Generation Computer Systems 29: 1645–1660. doi:10.1016/j.future.2013.01.010.
- Guinard, D., V. Trifa, T. Pham, and O. Liechti. 2009. “Towards Physical Mashups in the Web of Things.” Networked Sensing Systems (INSS), 2009 Sixth International Conference, Pittsburgh, PA, June 2009.
- Hart, J. K., and K. Martinez. 2006. “Environmental Sensor Networks: A Revolution in the Earth System Science?” Earth-Science Reviews 78: 177–191. doi:10.1016/j.earscirev.2006.05.001.
- Hunt, W. F., S. Stephens, and D. Mayes. 2002. “Permeable Pavement Effectiveness in Eastern North Carolina.” Proceedings of 9th International Conference on Urban Drainage, ASCE, Portland, OR, September 2002.
- Janowicz, K., A. Bröring, C. Stasch, and T. Everding. 2010. “Towards Meaningful Uris for Linked Sensor Data.” Towards Digital Earth: Search, Discover and Share Geospatial Data. Workshop at Future Internet Symposium, Berlin, Germany, September 2010.
- Janowicz, K., A. Bröring, C. Stasch, S. Schade, T. Everding, and A. Llaves. 2013. “A Restful Proxy and Data Model for Linked Sensor Data.” International Journal of Digital Earth 6 (3): 233–254. doi:10.1080/17538947.2011.614698.
- Jirka, S., A. Brring, and C. Stasch. 2009. “Applying OGC Sensor Web Enablement to Risk Monitoring and Disaster Management.” GSDI 11 World Conference, Rotterdam, Netherlands, June 2009.
- Kopecny, E., S. Entem, A. Lahoud, A. Moeller, L. Yde, and M. Soulier. 1999. “Real Time Control of the Sewer System of Boulogne Billancourt: A Contribution to Improving the Water Quality of the Seine.” Proceedings of 3rd DHI Software Conference, Helsingør, Denmark.
- Liang, S. H. L., A. Croitoru, and C. V. Tao. 2005. “A Distributed Geospatial Infrastructure for Sensor Web.” Computers & Geosciences 31 (2): 221–231. doi:10.1016/j.cageo.2004.06.014.
- Mazzetti, P., S. Nativi, and J. Caron. 2009. “RESTful Implementation of Geospatial Services for Earth and Space Science Applications.” International Journal of Digital Earth 2 (1): 40–61.
- Pfister, A., and A. Cassar. 1999. “Use and Benefit of Radar Rainfall Data in an Urban Real Time Control Project.” Physics and Chemistry of the Earth, Part B: Hydrology, Oceans and Atmosphere 24: 903–908. doi:10.1016/S1464-1909(99)00101-X.
- Pratt, C. J., J. D. G. Mantle, and P. A. Schofield. 1995. “UK Research into the Performance of Permeable Pavement, Reservoir Structures in Controlling Stormwater Discharge Quantity and Quality.” Water Science and Technology 32 (1): 63–69. doi:10.1016/0273-1223(95)00539-Y.
- Ruggaber, T. P., J. W. Talley, and L. A. Montestruque. 2007. “Using Embedded Sensor Networks to Monitor, Control, and Reduce CSO Events: A Pilot Study.” Environmental Engineering Science 24 (2): 172–182. doi:10.1089/ees.2006.0041.
- Sang, Y., H. Shen, Y. Inoguchi, Y. Tan, and N. Xiong. 2006. “Secure Data Aggregation in Wireless Sensor Networks: A Survey.” Parallel and Distributed Computing, Applications and Technologies, 2006. PDCAT'06. Seventh International Conference, Taipei, Taiwan, December 2006.
- Schaffers, H., N. Komninos, M. Pallot, B. Trousse, M. Nilsson, and A. Oliveira. 2011. Smart Cities and the Future Internet: Towards Cooperation Frameworks for Open Innovation. Berlin Heidelberg: Springer.
- Sempere-Pay´a, V. M., and S. Santonja-Climent. 2012. “Integrated Sensor and Management System for Urban Waste Water Networks and Prevention of Critical Situations.” Computers, Environment and Urban Systems 36 (1): 65–80.
- Wiese, J., S. Schmitt, A. Stahl, J. Hansen, and T. G. Schmitt. 2003. Experience management for wastewater treatment. Fachgruppe Wissensmanagement der Gesellschaft f¨ur Informatik. Karlsruhe.
- Yu, B., P. K. Behera, and J. F. R. Rochac. 2011. “Advanced Sensor-computer Technology for Urban Runoff Monitoring.” SPIE Smart Structures and Materials+ Nondestructive Evaluation and Health Monitoring, 79815U. Masayoshi Tomizuka, San Diego, CA: International Society for Optics and Photonics.