
Abstract
Flood damage assessment (FDA) is a key component of risk-based method for flood management. In the current FDA approaches, generally the uniqueness of the building is disregarded in the analysis. Therefore, they are unfit for detailed applications in which case-by-case analysis of building damage is an essential requirement. This limitation is compounded by the use of incomplete and often low-quality data inputs about the building and the assumptions and approximations made regarding the geometry and materials of its components. Such shortcomings may result in incomplete and uncertain outcomes. Considering the benefits and increasing use of three-dimensional (3D) urban modeling and Building Information Model in various urban management processes, in this paper, an integrated framework for utilization of detailed 3D building models for the assessment and 3D visualization of flood damage to building according to its distinct behavior against flood is presented. A proof-of-concept demonstration of the framework in a case study underlined the feasibility of implementation of the framework, which can potentially benefit a variety of users and be used as a complementary approach to the current FDA methods for improving the resilience of the community toward floods and their adverse impacts.
1. Introduction
Floods are the most common and one of costliest natural hazards around the globe (CRED Citation2012; Kourgialas and Karatzas Citation2012). The predicted increase in frequency and intensity of future floods as a result of factors like climate change (Jha, Bloch, and Lamond Citation2012; Jalayer et al. Citation2013) has highlighted the need for effective flood risk management for mitigating the adverse impacts of such events on the community.
In the recent decades, the limitations of addressing the flood risks using traditional methods with sole focus on controlling the flood via structural measures (e.g. dams and levees) has been repeatedly acknowledged (Birkmann et al. Citation2013; Merz et al. Citation2010). In the modern flood risk management approach (also known as risk-based method) (see Hall et al. Citation2003), in addition to consideration for the hazard, the potential flood consequences are evaluated using flood damage assessment (FDA) to be used as the basis for assessing the risks and decision-making for their treatment (Thieken et al. Citation2005). A variety of FDA methods have been proposed with strong emphasis on buildings. This is due to the economic importance of buildings and their large contribution to the overall level of damage to the community (Messner et al. Citation2007; Dewals et al. Citation2008).
FDA methods are generally developed for three major analysis scales; i.e. macro, meso, and micro (Apel et al. Citation2009). While the first two target the large-scale applications with less detailed outputs and no indication of damage to individual buildings, microanalyses are employed where the investigation only considers a small spatial stretch and uses object-oriented method for the appraisal of damage for individual or a small cluster of buildings (Merz et al. Citation2010; De Risi et al. Citation2013b).
1.1. Microscale FDA methods for buildings
A variety of theoretical and practical micro-level FDA methods for different purposes have been developed that can be employed for the analysis of flood damage to a building. The review of the literature in this work classifies these methods into four general categories: ex post method, averaging, damage curves and detailed vulnerability assessment.
‘Ex post’ methods estimate the ‘actual’ damage using systematic surveys, remote sensing, or even their combination in the aftermath of a flood. This method is costly and labor-intensive and lacks predictability for future events (Merz et al. Citation2010). In addition, its results are often associated with large uncertainties that are rooted in the employed data collection methods and human error (Downton, Miller, and Pielke Citation2005). On the other hand, ‘Averaging’ such as Rapid Appraisal Method (NRE Citation2000) is a quick and cost-effective method employing the ‘mean damage cost per building’ for all buildings. Yet, by not distinguishing the damage variability of buildings, it generates high uncertainties for microscale damage analysis.
Damage curve is the internationally accepted standard method for FDA (Smith Citation1994; Merz et al. Citation2010). By generalizing the buildings into classes and coupling empirical data with a single flood parameter (commonly inundation depth), the damage to buildings is estimated and presented using a predefined curve (or function). These curves are usually specific to a particular geographic context and tend to disregard the distinct resistance of buildings against flood that is not reflected by the class. Furthermore, attributing building damage to only the inundation depth in the majority of existing curves results in an incomplete and uncertain damage estimation as no one-to-one relationship between building damage and this flood parameter exists (Merz et al. Citation2004; Pistrika and Jonkman Citation2010). These are considered as important sources of uncertainty and major impediments for applying curves for building-specific damage assessment (Merz et al. Citation2004; De Risi et al. Citation2013a).
On the other hand, curves generally focus on the quantitative damage appraisal via absolute monetary costs (absolute) or a percentage of the total building value (relative) (Merz et al. Citation2010), with no capability for indicating the mode of damage. As it often becomes crucial to understand the nature of the risks for their treatment, studies like Black (Citation1975), USACE (Citation1985), and Becker, Johnstone, and Lence (Citation2011) proposed methodologies to unveil such information about the type of damage. Despite the provision of building damage state (e.g. collapsed or not), these curves are still inadequate for presenting the details of damage (e.g. ‘where’ it may occur and ‘why’) and the quantitative losses. Schwarz and Maiwald (Citation2008) provided the only attempt for simultaneous provision of qualitative and quantitative measurement of the damage. However, despite the novelty of this method, the damage variations within building classes are still overlooked.
Rigorous methods in detailed building vulnerability assessments (e.g. Kelman Citation2002; Roos Citation2003; Nadal et al. Citation2010; Mazzorana et al. Citation2014) on the other hand adopt numerical analysis of fluid–structure interaction and accordingly estimate the damage based on the flood loads and resistance of the building. Despite the provision of a detailed analysis, in most cases, the output of these methods is incomplete and uncertain with rare consideration for water contact damages. These arise from the limited knowledge about the building in these studies (from an incomplete building surveys or use of descriptive and two-dimensional [2D] information), assumptions and approximation of the building geometries and flood parameters, and disregarding important aspects of the building such as its interior. In addition, none of the proposed methods could provide a visual representation of the damages to the building.
Due to these drawbacks and scope of analysis, consideration of any of the aforementioned methods for applications such as building design evaluation that require a detailed and complete analysis of potential damage to the building based on its uniqueness is inadvisable. Although such models have been developed for other hazards such as hurricanes or earthquakes (Vickery et al. Citation2006), no similar methods are yet considered for flood hazard and there still exists a research gap in addressing such requirements.
1.2. Three-dimensional building information modeling
Efforts within the context of digital earth initiatives (e.g. VANZI Citation2015) are ever-growing with increase in development and applications of three-dimensional (3D) urban modeling and virtual 3D city models (Zhu et al. Citation2009). Building Information Model (BIM) on the other hand, as a 3D digital representation of all aspects of a building in a single information model (Succar Citation2009), is steadily being adopted and mandated in many countries for use in planning and land development processes (Zeiss Citation2013; McGraw Hill Construction Citation2014). BIM and 3D city models, and sometimes their integration, have become the interoperable urban information management framework. They result in a paradigm shift in analysis and visualization from the traditional 2D approaches into sophisticated 3D methods for a variety of applications including sustainable development, land administration, and disaster management (Kwan and Lee Citation2005; Kolbe, Groger, and Plumer Citation2008; Amirebrahimi and Rajabifard Citation2012; Shojaei et al. Citation2014).
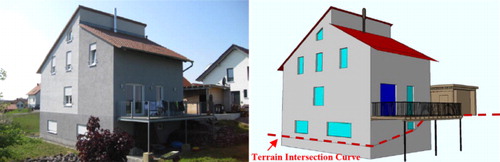
The major benefit of utilizing 3D models lies in their information richness. BIM and 3D city modeling standards such as Industry Foundation Classes (IFC) and City Geographic Markup Language (CityGML) adopt object-oriented approach and utilize semantically and geometrically coherent 3D information to represent the building in relation to their surroundings (Stadler and Kolbe Citation2007). The provided details of buildings in these models go beyond the descriptive capacities of 1D and 2D spatial information (see ); and accordingly, they can support applications that would not be possible via use of 2D data.
Note: The 3D building intersecting with the terrain is marked to accurately highlight the elevation difference around the building (adopted from OGC Citation2012).
3D models have been successfully employed for evaluation and visualization of damage to building from earthquake (e.g. Christodoulou, Vamvatsikos, and Georgiou Citation2010) and fire (e.g. Rüppel and Schatz Citation2011). Yet, despite their potential benefits for FDA and flood risk management (Isikdag and Zlatanova Citation2009), only limited efforts have been made in this area. A few studies (e.g. Kemec, Duzgun, and Zlatanova Citation2010; Mioc et al. Citation2011) have employed 3D models in flood risk management; however, their aim was solely the 3D visualization of hazard and did not include any damage evaluation.
Having highlighted the gaps for current micro-level FDA methods and with attention to the aforementioned 3D technical developments in the realm of digital earth, in this multidisciplinary research, a framework for a combined use of these technologies and employing high-quality 3D information as inputs for a microscale analysis of potential flood impacts on the building is proposed. The framework uses the spatial and temporal outputs of hazard assessment and by employing a series of analytical steps, assesses the damage to individual building components not only against the flood loads but also those induced by the water contact. It also intends to improve the communication of the building damage by a 3D visualization of the impacts to individual building components for better understanding of the degree as well as the location of each damaged component in the building. It is envisioned that by linking the proposed method to the planning and development process, insights about vulnerabilities and risks in building design can be provided to the professionals. This information can be used as input for improving the resilience in the community against floods and their adverse impacts.
The scope of this research is the micro-level appraisal of the potential direct tangible damages – those that are caused by immediate impacts of flood and can be presented in monetary terms (Merz et al. Citation2010) – to the building from riverine floods. This paper focuses on the building itself and not the content and assumes that the building components are not previously affected by any of the adverse impacts of aging, weathering, or damage from other hazards.
In the remainder of this paper, according to the provided background, the proposed framework and its components are explained and a proof-of-concept implementation of the framework in a case study is presented. Furthermore, the benefits and limitations of the framework are discussed, and finally, the concluding remarks are presented and the future research directions are proposed.
2. Flood damage assessment – an integrated 3D micro-level approach
The building damage from flood is mainly associated with the flood actions (generated by flood characteristics such as depth and velocity) and the building characteristics, including the type of components and their resistance capacity against floodwater (Kelman and Spence Citation2004; Pistrika and Jonkman Citation2010). By calculating these actions on building components and considering their resistance, damage to these components can be evaluated.
The proposed framework in this paper integrates the detailed building information from 3D models with the flood parameters from hydrological modeling and incorporates a number of concepts from Assembly-based Vulnerability (ABV) paradigm (Porter, Kiremidjian, and LeGrue Citation2001) and Limit State Design (LSD; McCormac Citation2008) for a detailed assessment and visualization of building damage. The ABV is a methodology in engineering domain that estimates the total loss as the accumulated cost of damage to each building component.
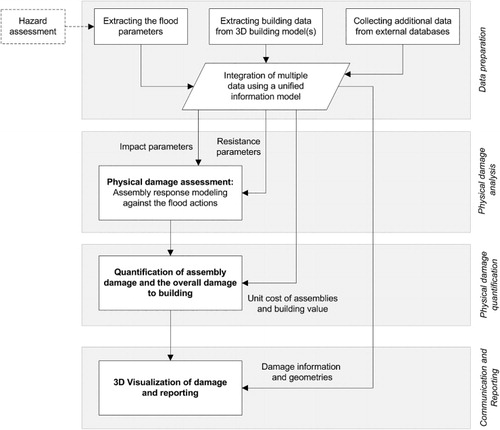
As illustrated in , the framework consists of four distinct phases; i.e. data preparation, physical damage assessment, damage quantification, and communication and reporting. In the first phase, the information requirements for FDA from different sources are combined in a unified and consistent database. This information is then used to evaluate the physical damage to each building component using engineering methods. The unit cost for each damaged component is then used to estimate the cost of damage. These costs are accumulated for all components to present the overall damage to the building. Once it is achieved, a tabular report and a 3D visualization of damage to the building and its components (based on the obtained 3D geometries in the data preparation phase) are provided. The details of the elements in each phase of the framework are further discussed in the subsequent sections.
2.1. Data preparation
The data preparation phase includes the acquisition and integration of information from various sources that would be used for damage assessment, quantification, and visualization. The four required information sets include the elevation model, spatiotemporal distribution of flood parameters, and information about the building, its components, as well as their respective repair or replacement costs.
The elevation model can be obtained from Geographic Information Systems (GIS) or the city models (e.g. CityGML). On the other hand, the information about building in this framework is mainly sourced in BIM, which includes spatial (geometry and topology) and nonspatial (e.g. type, material, use) information about individual interior and exterior building components such as walls, openings (e.g. doors and windows), floors, linings, and finishes that (1) are susceptible to flood damage or (2) play a role in infiltrating the water to inside the house.
In addition to the building components, their cost information is necessary for damage quantification. This information may either be obtained from the BIM or from other external sources such as construction cost databases (e.g. Rawlinsons in Australian context) used by quantity surveyors. The linkage between the components and their cost information is established in the data preparation phase and can be facilitated by standard taxonomies such as MasterFormat (CSI Citation2013). Such taxonomies provide industrywide standard classification codes that can be used for assembly typing and cross-referencing for project management and cost estimation.
The other important information in the framework is the flood parameters. The common flood parameters used in FDA are extent, depth, velocity, duration, and rate of rise (Merz et al. Citation2010) which are a function of 3D space and time. They are typically obtained from the hazard assessment process using hydrodynamic simulation tools. Although this step is not focused in this research, it is an important prerequisite for the damage estimation. Coherence between hazard modeling and the level of detail and scale of FDA is crucial for ensuring the suitability of the flood parameters for the requirements of the study. Recent advancements in flood modeling such as 3D Smoothed Particle Hydrodynamics and commercial tools such as TUFLOW and MIKE can be employed for this purpose. They facilitate the inclusion of buildings and other obstacles in the simulation using different representations for more realistic modeling of the water behavior in the vicinity of the buildings. Syme (Citation2008) and Smith and Wasko (Citation2012) discussed the benefits and applications of these representation methods. This becomes important in the case of micro-FDA as local conditions, geometry, and building orientation are decisive factors in determining the value of flood parameters, and in particular, the velocity. In addition, a number of functions are included in these tools that allow a multiresolution elevation model to be created for the study area. Therefore, by focusing on high-resolution modeling in the areas of interest, rather than the whole study region, the balance between resource requirements and the essential level of details can be achieved.
Flood parameters obtained from hazard assessment are stored for use in the damage analysis. Highlighting the heterogeneity of the outputs from different flood simulation tools, requirements of information from multiple sources, as well as the spatial integration issues of the resistance (building) and flood parameters, a unified information model is required in the framework to facilitate the integration of data and ensuring a consistent and uniform organization of information in the database.
2.2. Physical damage assessment
As discussed previously, the damage to building components is caused by the effects of flood actions. The flood actions, depending on the flood type may include hydrostatic, hydrodynamic, waves, buoyancy, debris, erosion, and nonphysical (Kelman and Spence Citation2004). As the focus in this research is on riverine flooding with rare presence of certain actions like waves and erosion, the discussion in here will be mainly on hydrostatic, hydrodynamic, buoyancy, and nonphysical (water contact) actions.
Hydrostatic action is the lateral pressure from the water depth difference on opposite sides of a vertical element like a wall and is calculated using the method provided by Kelman and Spence (Citation2004). Hydrodynamic action on the other hand is the lateral pressure generated by the flowing water. This pressure depends on the flow direction and is mainly related to the velocity vector component perpendicular to the building element surface. It can be positive, pushing the element inward, or negative, generating suction. This action is important for micro-level FDA where local velocity effects become important and as suggested in Section 2.1, it is necessary to include the buildings in flood modeling for the simulation of such effects. Hydrodynamic action can be calculated using the method provided by FEMA (Citation2012). Buoyancy action refers to the generated upward force by the displaced water from the volume of a submerged component. It can lift light buildings off their foundation and if it is combined with hydrodynamic action, it can transport the building, resulting in damage or its destruction (Black Citation1975). FEMA (Citation2012) provides a method for estimation of the force as the result of this action. Nonphysical action is the damage resulting from floodwater (fresh or contaminated) contacting a water-sensitive building element. Component materials as well as the duration of water contact are decisive factors for the level of damage. Although water contamination can have severe effects, its analysis is not considered in this framework due to high uncertainties.
For assessing the damage to the building components, the analysis proposed here is performed for the flooding period discretized into a series of equal time steps. As illustrated in , for each time step, a number of analytical tasks are performed to (1) calculate the flood actions on individual components and (2) profile the potential damage to each component from a particular action or combination of actions.
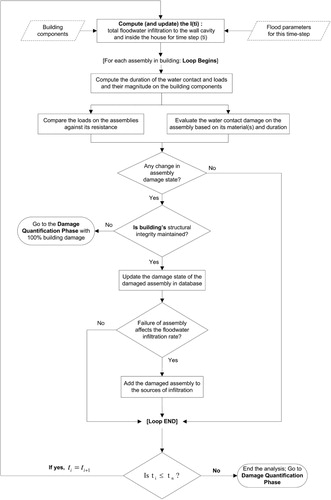
In the first step, the depth of water outside and inside the house is calculated for hydrostatic action computation. For cavity walls and their failure assessment, the water depth inside the cavity is also required. For this analysis, the theory established by Kelman (Citation2002) for calculating the water infiltration into the house was adopted. In his work, by adjusting the existing air infiltration models, Kelman developed and validated a theoretical method for floodwater infiltration into the house interior. The infiltration occurs based on fluid pressure difference () and may occur through a variety of building components such as walls, openings (e.g. doors, windows, and vents), etc. For the formulas, the reader is referred to Kelman (Citation2002). This method calculates a single infiltration rate for each relevant assembly using assumed maximum water pressure difference. For this framework, a minor modification was made to the method by Kelman (Citation2002) to allow the estimation of the infiltration level based on water depth and velocities for each time step. This modification, assumes a steady state with no significant change in depth and velocity from one time step to another. The total infiltration I(ti) for each time step ti is the product of the duration of the time step T and the sum of the infiltration of each component of the building I(n), shown in Equation 1.
Having the flood parameters outside and inside the house and the cavities for different time steps, the load duration and magnitude on each component can be calculated according to the location and geometry of the component and the methods discussed for calculation of flood actions. Using the calculated loads on each component and its resistance (e.g. based on materials, geometry and its subcomponents), the damage is evaluated. LSD concepts are used here as the main criteria for damage. The limit states are conditions which the building or part of it can no longer fulfill its intended function (McCormac Citation2008). Australian standard for structural design actions (AS/NZS Citation2002) prescribes two sets of limit states; i.e. Ultimate- and Serviceability-Limit States (ULS and SLS) that are used for the building design process. The condition defined in Equation 2 is used for failure analysis by comparing the computed flood loads against the component design upper limits. The values of LA and LD indicate the applied and maximum allowable load for ULS and SLS. If the condition can no longer be satisfied for a particular load, the limit state is exceeded and damage to the component occurs.
Beside ULS and SLS, an additional limit state for water contact damage (Equation 3) was defined in this research. Damage in here is evaluated by comparing a function of water sensitivity of the component material (ω), its exposed area (A), and the contact duration (Tc) against the material susceptibility for particular water contact duration, the . The second component, the
, can be obtained from previous studies such as FEMA (Citation2008) or HNFMSC (Citation2006). For example, FEMA (Citation2008) defines it as ‘significant damage’ for engineered wood flooring materials in contact with water for more than 72 hours and full replacement of the component is suggested. Depending on whether an interior or exterior building assembly is analyzed, the relevant water level (inside or outside) is used. The Tc
in the context of this work is calculated using the Equation 4. In here, ti
is the current time step being investigated and
represents a reference to the time step that the water contact was made first.
The above process is repeated for all time steps and at each one, the structural integrity of the building is checked based on changes in the damage state of the structural and load-bearing components as well as the structural connections in the building. For any compromise to the structural integrity, the analysis is stopped and full damage is reported. Otherwise, the damage states of the components are updated in the damage profile database and a check occurs to assess whether any of them affected the water infiltration rate. If infiltration can occur through the damaged component (e.g. windows with failed panels), it is included in the infiltration calculations in the next time step.
2.3. Physical damage and loss quantification
In this phase, the details of the monetary damage to the building are calculated. The damage cost of each building element An is quantified according to its damage state, DSn, its treatment approach, Gn (repair or replace), and its unit cost, Cn (see Equation 5). Linking damage state to the treatment method requires careful attention as a variety of factors (e.g. expert judgment, interrelationships between components, and whether the building is insured or not) may affect the decision for treating the damaged component. A number of developed guidelines and standards such as BSA (Citation2010) and CIRIA (Citation2005) can be used to facilitate the implementation of this aspect of the framework. On the other hand, costs should be up-to-date or adjusted to reflect any effect of building or component value depreciation.
As discussed earlier, the total building damage (DB) in this framework is calculated as the sum of all damages to its individual components (Equation 6).
To avoid double counting, ‘flagging’ can be used to mark each assembly in the model once its damage cost is considered. In addition, hierarchies and assembly relationships defined in the 3D model (e.g. damaged window from the failure of wall) can be employed to prevent errors in counting the damage to components and its subcomponents.
2.4. Communication and reporting
After the assessment and valuation of the damage, a report regarding the damage to the building and its components is generated. Such reports should contain the number, type and details of damaged components, their damage state, and the cost of the required treatment option. In addition to the report, the geometry of the individual building elements can be color coded in a 3D model by their damage states to visualize their damage. Depending on the visualization requirements of the user, a desktop or web visualization tool can be developed or adopted. This tool should allow for functionalities such as show/hide component category (e.g. doors or walls), camera movement at an object zoom level as well as selection and inquiry about the details of a particular component. In this way, susceptible assemblies and their locations in the building can be visually inspected and queried to assist the decision-making.
3. Case study: a typical Australian house in the City of Maribyrnong
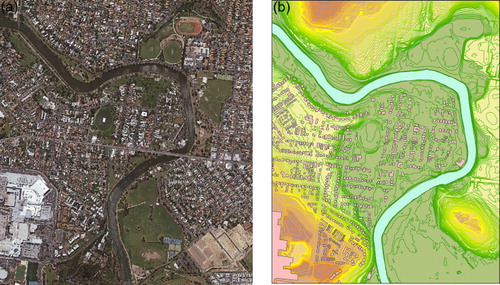
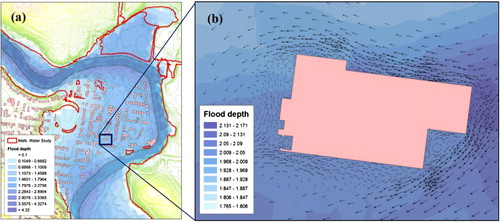
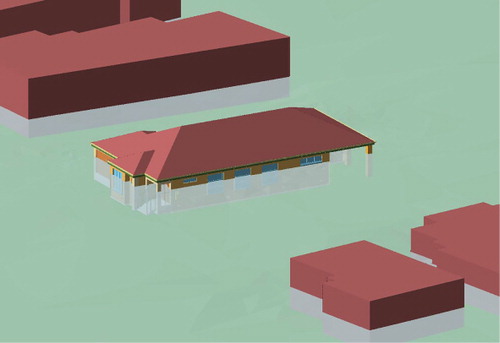
Following the overview of the proposed framework and its components in Section 2, in this section a case study as a proof-of-concept demonstration of the implementation of the framework in close collaboration with Maribyrnong City Council and Melbourne Water (MW), the floodplain management authority in the Melbourne metropolitan area, is presented. It involves the assessment and 3D visualization of the potential damages of a 1-in-100 year flood (commonly used for planning in Australia) to a residential house located in Maribyrnong Council in Melbourne. The area, as illustrates, is low-lying land and prone to flooding. It has been seriously affected by floods in 1906, 1974, 1983, 1987, 1993, and 2011. The 1974 flood with approximate severity of a 1-in-100-year event inundated over 370 buildings resulting in economic damage of over $16.5 million in 1974 dollars (SES Citation2012). The building in focus in this study is a common Australian house type (Geoscience Australia Citation2014) with slab-on-ground masonry veneer walls, plasterboard lining, and integral garage. The slab of the house is raised to about 0.7 m to reduce the flood damage to the building.
3.1. Extracting the building information and assembly costs
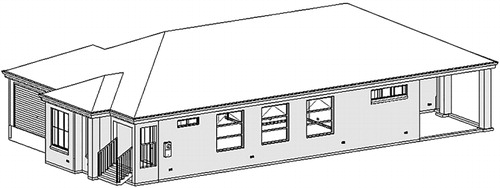
The building information, as discussed in Section 2.1, is a crucial data for this case study. For acquiring this data, due to inaccessibility to a ready-to-use BIM model for this building, the acquired 2D architectural and structural plans of the house from the council were used for development of a georeferenced 3D BIM model of the house (see ) using Autodesk Revit. In addition, based on the type of the building components used for construction of the house, their replacement costs were acquired from the up-to-date Australian construction cost guide (Rawlinsons Citation2014). On the other hand, the value of the building was obtained according to the cost of construction of the building in the submitted documents to the council.
3.2. Hazard simulation and extraction of the flood parameters
To obtain the flood parameters, MIKE 21 hydrodynamic simulation software (DHI Citation2015) was employed and a 1-in-100 year flood in the study area was simulated. Discharges from the river and other required parameters (e.g. boundary conditions) for the simulation were provided by MW based on their earlier flood mapping studies. The simulation also incorporated a detailed elevation model of the study area (0.5-m contours), spatial distribution of building footprints provided by the council and the outputs generated for 10-minute intervals. As indicated by Schubert et al. (Citation2008) as the most suitable method to illustrate the building effects on flood characteristics, the buildings in the study area were blocked out from the used elevation model in the flood simulation. The footprint of the building under investigation was refined in the flood simulation according to the external walls in the BIM model (see ). On the other hand, rather than a fixed grid for the elevation model, the simulation employed a flexible triangular mesh that allowed it to be denser in the vicinity of the house and coarse in other locations for computational efficiency. The outputs of the model comprised the spatiotemporal distribution of water depth and velocity, which largely agreed with the results of the MW flood study in this area (see ). These were exported to GIS (shapefile) using Mike2Shp toolbox in MIKE, creating a shapefile for every time step. The spatial distribution of depth and velocity vector components were extracted from each file using an in-house–developed tool and a single Extensible Markup Language (XML) file was created containing a set of distinct points including their geographic coordinates as well as their depth and velocity values for all time steps.
3.3. Data integration using unified information model
For integrating the acquired information into a single database, according to the data requirements for the analysis of damage (discussed in Section 2.1), a data model was designed as a profile of Geographic Markup Language (GML) (OGC Citation2007), which allows for a unified and consistent storage of these requirements from BIM and GIS. The data model consists of seven categories of information organized in their relevant packages, i.e. core, terrain, flood, building, utilities, materials, and valuation. It was then implemented using XML schema to allow the information storage in a GML file. A detailed explanation of the extraction of the design of the data model is provided in Amirebrahimi et al. (Citation2015). While the acquired elevation model from the council could be simply converted to GML format, importing the data from BIM to the data model was not straightforward. In spite of the previous efforts for conversion between IFC and GML (e.g. Li, Tor, and Zhu Citation2006; Wu and Hsieh Citation2007), there was no tool found that could provide a smooth conversion for all the required information. Therefore, a semiautomatic process (illustrated in ) was designed to import building information from the IFC file.
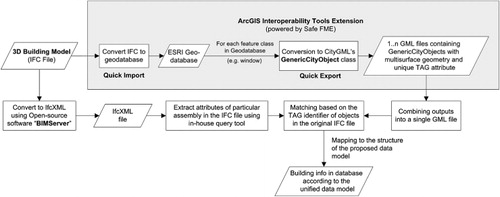
On the other hand, the created XML file containing the spatiotemporal flood parameters was parsed and the flood information was mapped to the structure of the designed data model. Altogether, the building and its assembly costs information, flood parameters, and the elevation model were transformed and stored in the implemented database in GML file for further use in the building damage evaluation.
3.4. Calculation of water depth inside the house
Prior to the assessment of damage to the building, first the relevant flood actions on the building components had to be computed. The calculation of the hydrostatic forces, as one of the considered actions here, requires the depth of water for inside the house in addition to the outside. For this purpose, the potential sources of floodwater infiltration were identified and the depth of water for inside as well as the cavity was computed for each time step using the method described in Section 2.2. To achieve this, the point distribution of flood parameters was retrieved from the GML file and a Voronoi diagram of these points was generated in ArcGIS (see ). The Voronoi diagram is induced by a set of points and subdivides the plane in the way that the created regions correspond to areas that are closest to each point. Using the generated regions in the GIS environment and overlapping them with building facade elements, the effective application areas of each flood point could be identified. According to these application areas, the facade lines (obtained from external walls outline in BIM) were broken down into these smaller elements and assigned a particular depth and velocity value at each time step. In this way, the pressure distribution on each external building component as a result of combined hydrostatic and hydrodynamic actions could be estimated using the referred methods in Section 2.2.

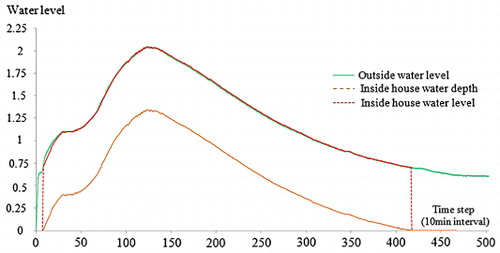
By employing the calculated depth and pressure difference for the components that could infiltrate the water to house’s interior (e.g. windows, doors, vents) and applying the modified Kelman’s method (refer to Section 2.2), the amount of water infiltration for each time step and total volume of water and its depth inside the house were estimated. illustrates these values for the first four days of the flood. As it can be seen, due to sufficient infiltration sources, the water could easily infiltrate to the house interior and after a number of time steps, the inside water depth reached the outside depth resulting in a small and balancing the hydrostatic pressure.
3.5. Physical damage assessment
According to the calculated depth of floodwater inside and outside of the house, the relevant loads for each external component of the building (e.g. window glazing panels and wall cladding) were calculated. Doors (except external glass sliding doors that were treated as windows) in this study were only considered for water contact damage due to a high level of uncertainty in their analysis against lateral pressures. The damage to the brick cladding was calculated using the suggested method by Lawrence and Page (Citation1999) to evaluate the combined effect of cavity ties and the brickwork’s bending capacity against the flood lateral loads. The ULS and SLS criteria used here were obtained from the Australian standard for masonry structures (AS Citation2011). The damage to window panels as the most vulnerable window part (Nadal et al. Citation2010) was calculated using a simple finite element model in ANSYS. Rich information about the window panels and their materials from BIM allows for such analysis. The ANSYS model evaluated the resulting stress level in the glazing from flood actions against the allowable stress (ULS) discussed in Australian Standard 1288 (AS Citation2006). As this analysis incorporates the panel evaluation for each time step, the user was asked to manually indicate whether a glazing panel would fail against a particular or not.
The doors, external electrical components (e.g. meter box and switches), and other interior components, (e.g. interior doors, wall lining and insulation, joineries, floors, etc.) were evaluated against the water contact damage only. It was assumed here that all interior doors are open and the inside house water velocity is negligible. While electrical devices become instantly damaged on water contact, for other components, the previous studies regarding the material resistance against floodwater (e.g. Wingfield, Bell, and Bowker Citation2005; HNFMSC Citation2006; FEMA Citation2008; Snow and Prasad Citation2011; ICA Citation2013) were employed to assess their potential damage. The important factors for this analysis include (1) the base height of the assembly obtained from local placement property of the component in BIM; (2) water contact duration calculated using the Equation 4; and (3) vulnerability of material to water contact acquired from the aforementioned studies.
The result of damage analysis suggested that nearly all the damage to the building in this case study was due to water contact. This is because of small flood velocities and the negligible hydrostatic action due to a small depth difference between the inside and outside of the house. In addition, due to sufficient water infiltration to inside the house, no significant buoyancy action was generated to cause damage. While external cladding remained undamaged, nearly all internal linings, wall insulations, skirting, as well as interior and exterior electrical devices required replacement. The moldings, ceiling, ceiling lights, aluminum windows, and ceramic tiles flooring remained unaffected. Other flooring types (carpet and timber floor) and one instance of timber frame external window required replacement. According to the aforementioned assessment of damage, the damage state of each assembly was updated in the damage profile section of the GML file to be used for the purpose of damage quantification.
3.6. Physical damage and risk quantification
At the end of damage analysis and according to the updated database, the damage states of the damaged assemblies, their overall units, as well as unit costs were retrieved from the database and were used to calculate the damage to individual components. The sum of all these damage costs (see for details) constitutes the total damage to the building.
Table 1. Summary of damage to the components and the total damage to the building (the unit costs are based on Rawlinsons Citation2014).
On the basis of the estimated losses, the risk can be quantified according to Equation 7 (adopted from Jonkman et al. Citation2008). The risk to the building for a 1-in-100 year flood (1% probability of occurrence) in this case study is calculated by
3.7. Communication and reporting
Once the damage costs to each component as well as the overall damage to the building is calculated, the results including the type of damaged components, their number, the overall damaged units, cost of damage to each, as well as the total damage to the building is presented in a tabular format and reported to the decision maker. An example of this report is illustrated in .
In addition to the tabular format for presenting the damage cost details, by using the geometry of elevation model, flood, buildings, etc., a 3D visualization of the floodwater around the house can be presented to the user in a 3D GIS environment to improve their perception of the water levels. A snapshot of water levels in this case study is illustrated in .
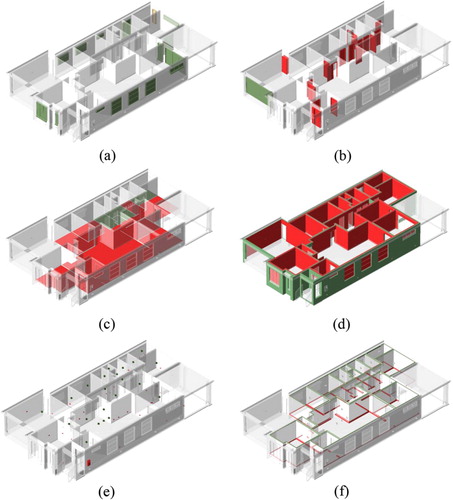
Furthermore, by using the damage state of the each component, their geometry was color coded to visualize the damage in ArcScene, an interactive 3D desktop GIS application. As illustrates, damage to different components can be queried and presented in 3D for communication of the level and the location of the damage for decision-making. For example, the red doors in represent the damaged ones and must be replaced. On the other hand, as shown in , due to material damage, the wall linings must all be replaced. However, as this figure illustrates, the cladding does not require any repair or replacement and is therefore shown in green. The grey elements are used for putting the turned on damaged items into the building context and represent those that the user has turned their layer off for damage inspection.
4. Discussion and conclusions
This paper presented an integrated framework that by taking an engineering perspective and utilization of rich 3D information allows for a case-by-case analysis of flood damage to a building and its components. The proposed framework incorporates time-varying flood actions in the analysis and unveils their effects on the building. In here, the breakdown of the damage to individual components allows for a better understanding of the impacts of flood that can be used to adopt effective strategies to minimize its adverse effects. For example, the flooring in the demonstration of the framework – its susceptibility to floodwater can potentially result in incurring approximately $21,000 damage – can be replaced with a more flood-resilient alternative to reduce the overall damage cost if a flood occurs.
The implementation of the framework in a case study suggested the feasibility of the application of digital earth technologies as well as the adoption of the developments in the 3D modeling of buildings (e.g. BIM) for estimation of building damage from floods. By including such rich and detailed 3D building information in the analysis, the proposed framework could present the detail of damage in both quantitative and qualitatively way using costs as well as information about where and why the damage occurs. It, as a decision support tool, can be profitably used for a number of theoretical and practical applications which the current micro-level FDA methods are not sensitive toward. It can assist building designers or engineers to evaluate their designs for identification of flood risks and to seek appropriate alternatives for their treatment (Isikdag, Zlatanova, and Underwood Citation2011). This can accommodate the evident shift in practice from classic code-conforming designs to the performance-based methods where buildings are tailored to the performance requirements of the owner or a particular application (Van de Lindt and Taggart Citation2009; Christodoulou, Vamvatsikos, and Georgiou Citation2010). In addition, by providing not only the vulnerability but also the costs of damage to components, a cost–benefit analysis can be employed for the selection of the most effective alternatives. On the other hand, the feedback from Maribyrnong City Council in this study indicated that councils and relevant authorities can increase the confidence in their decisions for evaluating the proposed development for issuing planning or building permits in flood-prone areas. Similarly, via incorporating the distinct design of buildings in the analysis, and distinguishing their detailed risk levels, insurance companies can differentiate their premiums for policy holders. Finally, replacing the use of complex engineering language with an easy-to-understand 3D visualization of potential vulnerabilities, the owners can make more informed decisions for adoption of flood-resilient building materials or suitable risk reduction measures.
This framework is intended for microscale studies and its application beyond individual or a small cluster of buildings would be challenging. This is mainly due to high costs of employing this method for large-scale applications, which can be an impediment for extending the proposed approach to city or regional scale. In addition, in respect to the type of decisions at those levels, the in-depth damage analysis to the building is unnecessary and the requirements can be fairly addressed by employing the existing FDA methods such as damage curves.
The proposed framework in this paper is best applicable to new buildings or for those in their preconstruction phase for assessing their risks based on the potential consequences of flood. This stems from the underlying assumptions from ABV and also by not taking into account a number of effects like aging, adverse impacts from weathering, or previous events which may influence their resistance. Therefore, the use of the proposed method for existing buildings should be undertaken with caution, taking into account the uncertainties of such factors.
While in this paper, the feasibility of implementation of the framework was explored using the case study, the predicted results should also be verified through further investigations. As a future research direction, this will be addressed by a systematic comparison between the predictions with either empirical data from a real event or synthetic results from laboratory experiments. In addition, future research will investigate the inclusion of all the flood actions in the framework to improve its applicability to any flooding situation.
To conclude, the proposed framework was designed to complement the current FDA approaches (e.g. damage curves) where their capabilities fall short in providing effective outcomes. With consideration of the benefits of each for their effective scale and applications, a multiscale framework can be developed to provide a more comprehensive understanding of flood risks at different levels of the community as well as facilitating more informed decisions toward improving its resilience against floods and their adverse impacts.
Acknowledgements
We acknowledge the kind support of the Australian Research Council, the Maribyrnong City Council, and Melbourne Water for providing us with invaluable resources and their feedback for this work. In addition, we present our appreciation to Dr Vidal Paton-Cole, Dr Eleanor Gee, Dr Damith Mohotti, the reviewers of this paper, the members of Centre for Spatial Data Infrastructures and Land Administration, and Centre for Disaster Management and Public Safety in the University of Melbourne whose kind and constructive comments helped us for enriching this research.
Disclosure statement
No potential conflict of interest was reported by the authors.
Funding
The work was supported by the Australian Research Council [grant number LP0990135].
References
- Amirebrahimi, S., and A. Rajabifard. 2012. “An Integrated Web-based 3D Modeling and Visualization Platform to Support Sustainable Cities.” Paper presented at Proceeding of the XXII International Society for Photogrammetry & Remote Sensing Congress, Melbourne, Australia, August 25–September 1.
- Amirebrahimi, S., A. Rajabifard, P. Mendis, and T. Ngo. 2015. “A Data Model for Integrating GIS and BIM for Assessment and 3D Visualisation of Flood Damage to Building.” Paper presented at Locate 15, Brisbane, Australia, March 10–12.
- Apel, H., G. T. Aronica, H. Kreibich, and A. H. Thieken. 2009. “Flood Risk Analyses—How Detailed Do We Need to Be?” Natural Hazards 49: 79–98. doi:10.1007/s11069-008-9277-8.
- AS. 2006. AS1288: Glass in Buildings – Selection and Installation. Australia: Standards Australia.
- AS. 2011. AS3700: Australian Standard for Masonry Structures. Australia: Standards Australia.
- AS/NZS. 2002. AS/NZS1170: Structural Design Actions. Sydney, Australia and Wellington, New Zealand: Joint Publication by Standards Australia and Standards New Zealand.
- Becker, A. B., W. M. Johnstone, and B. J. Lence. 2011. “Wood Frame Building Response to Rapid-Onset Flooding.” Natural Hazards Review 12: 85–95. doi:10.1061/(ASCE)NH.1527-6996.0000029.
- Birkmann, J., O. D. Cardona, M. L. Carreño, A. H. Barbat, M. Pelling, S. Schneiderbauer, S. Kienberger, et al. 2013. “Framing Vulnerability, Risk and Societal Responses: The MOVE Framework.” Natural Hazards 67: 193–211. doi:10.1007/s11069-013-0558-5.
- Black, R. D. 1975. Flood Proofing Rural Structures: A ‘Project Agnes’ Report. New York, NY: National Technical Information Service.
- BSA. 2010. Contractor's Guide for Restoring a House after a Flood. Queensland, Australia: Building Services Authority.
- Christodoulou, S. E., D. Vamvatsikos, and C. Georgiou. 2010. “A BIM-based Framework for Forecasting and Visualizing Seismic Damage, Cost and Time to Repair.” Paper presented at 8th European Conference on Product and Process Modelling (ECCPM), Cork, Ireland, September 14–16.
- CIRIA. 2005. Standards for the Repair of Buildings Following Flooding. London: CIRIA.
- CRED. 2012. 2012 Disasters in Numbers. Belgium: Centre for Research on the Epidemiology of Disasters (CRED), Université catholique de Louvain.
- CSI. 2013. “MasterFormat.” Accessed July 13. http://www.csinet.org/Home-Page-Category/Formats/MasterFormat.
- De Risi, R., F. Jalayer, I. Ievolino, G. Manfredi, and S. Carozza. 2013a. “VISK: A GIS-Compatible Platform for Micro-scale Assessment of Flooding Risk in Urban Areas.” Paper presented at 4th ECCOMAS Thematic Conference on Computational Methods in Structural Dynamics and Earthquake Engineering, Kos Island, Greece, June 12–14.
- De Risi, R., F. Jalayer, F. De paola, I. Iervol, M. Giugni, M. E. Topa, E. Mbuya, A. Kyessi, G. Manfredi, and P. Gasparini. 2013b. “Flood Risk Assessment for Informal Settlements.” Natural Hazards 69 (1): 1003–1032. doi:10.1007/s11069-013-0749-0.
- Dewals, B. J., E. Giron, J. Ernst, W. Hecq, and M. Pirotton. 2008. “Integrated Assessment of Flood Protection Measures in the Context of Climate Change: Hydraulic Modelling and Economic Approach.” Environmental Economics and Investment Assessment II 108: 149–159. doi:10.2495/EEIA080151.
- DHI. 2015. “Mike 21 Hydraulic and Hydrodynamic Modelling Software.” http://www.mikepoweredbydhi.com/products/mike-21.
- Downton, M. W., J. Z. B. Miller, and R. A. Pielke, Jr. 2005. “Reanalysis of U.S. National Weather Service Flood Loss Database.” Natural Hazards Review 6 (1): 13–22. doi:10.1061/(ASCE)1527-6988(2005)6:1(13).
- FEMA. 2008. Flood Damage-Resistant Materials Requirements – Technical Bulletin 2. Washington, DC: Federal Emergency Management Agency.
- FEMA. 2012. Engineering Principles and Practices for Retrofitting Flood-Prone Residential Structures FEMA P-259. Washington, DC: Federal Emergency Management Agency.
- Geoscience Australia. 2014. “National Exposure Information System (NEXIS).” Accessed November 17. http://www.ga.gov.au/scientific-topics/hazards/risk-impact/nexis.
- Hall, J. W., I. C. Meadowcroft, P. B. Sayers, and M. E. Bramley. 2003. “Integrated Flood Risk Management in England and Wales.” Natural Hazards Review 4 (3): 126–135. doi:10.1061/(ASCE)1527-6988(2003)4:3(126).
- HNFMSC. 2006. Reducing Vulnerability of Buildings to Flood Damage: Guidance on Building in Flood Prone Areas. Parramatta, NSW, Australia: Hawkesbury-Nepean Floodplain Management Steering Committee.
- ICA. 2013. “Building Resilience Rating Tool.” Accessed October 28. http://buildingresilience.org.au/brrt.
- Isikdag, U., and S. Zlatanova. 2009. “A SWOT Analysis on the Implementation of Building Information Models within the Geospatial Environment.” Paper presented at proceedings of the Urban Data Management Society symposium 2009, Ljubljana, Slovenia, June 24–26.
- Isikdag, U., S. Zlatanova, and J. Underwood. 2011. “An Opportunity Analysis on the Future Role of BIMs in Urban Data Management.” In Urban and Regional Data Management – UDMS Annual 2011, edited by M. Rumor, 25–36. London: Taylor & Francis.
- Jalayer, F., R. De Risi, G. Manfredi, F. De Paola, M. E. Topa, M. Giugni, E. Bucchignani, et al. 2013. “From Climate Predictions to Flood Risk Assessment for a Porfolio of Structures.” Paper presented at 11th International Conference on Structural Safety and Reliability (ICOSSAR 2013), Columbia University, New York, NY, June 16–20.
- Jha, K. A., R. Bloch, and J. Lamond. 2012. Cities and Flooding – A Guide to Integrated Urban Flood Risk Management for the 21st Century. Washington, DC: The World Bank.
- Jonkman, S. N., M. Bockarjova, K. Kok, and P. Bernardini. 2008. “Integrated Hydrodynamic and Economic Modelling of Flood Damage in the Netherlands.” Ecological Economics 66 (1): 77–90. doi:10.1016/j.ecolecon.2007.12.022.
- Kelman, I. 2002. Physical Flood Vulnerability of Residential Properties in Coastal, Eastern England. Cambridge, UK: University of Cambridge.
- Kelman, I., and R. Spence. 2004. “An Overview of Flood Actions on Buildings.” Engineering Geology 73 (3–4): 297–309. doi:10.1016/j.enggeo.2004.01.010.
- Kemec, S., H. S. Duzgun, and S. Zlatanova. 2010. “A Framework for Defining a 3D Model in Support of Risk Management.” In Geographic Information and Cartography for Risk and Crisis Management – Towards Better Solutions, edited by M. Konecny and S. Zlatanova. New York: Springer.
- Kolbe, T. H., G. Groger, and L. Plumer. 2008. “CityGML – 3D City Models for Emergency Response.” In Geospatial Technologies for Emergency Response, edited by S. Zlatanova, 257–274. London: Taylor & Francis.
- Kourgialas, N. N., and G. P. Karatzas. 2012. “A Hydro-economic Modelling Framework for Flood Damage Estimation and the Role of Riparian Vegetation.” Hydrological Processes 27 (4): 515–531. doi:10.1002/hyp.9256.
- Kwan, M.-P., and J. Lee. 2005. “Emergency Response after 9/11: The Potential of Real-time 3D GIS for Quick Emergency Response in Micro-spatial Environments.” Computers, Environment and Urban Systems 29(2): 93–113. doi:10.1016/j.compenvurbsys.2003.08.002.
- Lawrence, S. J., and A. W. Page. 1999. Design of Clay Masonry for Wind and Earthquake. Artarmon, NSW, Australia: Clay Brick and Paver Institute.
- Li, J., Y. K. Tor, and Q. Zhu. 2006. “Research and Implementation of 3D Data Integration between 3D GIS and 3D CAD.” Paper presented at XXIII FIG Congress, Munich, Germany, October 8–13.
- Mazzorana, B., S. Simoni, C. Csherer, B. Gems, S. Fuchs, and M. Keiler. 2014. “A Physical Approach on Flood Risk Vulnerability of Buildings.” Hydrology and Earth System Sciences 18: 3817–3836.
- McCormac, J. C. 2008. Structural Steel Design. New Jersey, NY: Pearson and Prentice Hall.
- McGraw Hill Construction. 2014. “The Business Value of BIM for Construction in Major Global Markets: How Contractors around the World Are Driving Innovation with Building Information Modeling.” SmartMarket Report. McGraw Hill Construction Research and Analytics. Bedford, MA, US.
- Merz, B., H. Kreibich, R. Schwarze, and A. Thieken. 2010. “Review Article ‘Assessment of Economic Flood Damage’.” Natural Hazards and Earth System Science 10 (8): 1697–1724. doi:10.5194/nhess-10-1697-2010.
- Merz, B., H. Kreibich, A. Thieken, and R. Schmidtke. 2004. “Estimation Uncertainty of Direct Monetary Flood Damage to Buildings.” Natural Hazards and Earth System Science 4 (1): 153–163. doi:10.5194/nhess-4-153-2004.
- Messner, F., E. Penning-Rowsell, C. Green, V. Meyer, S. Tunstall, and A. Van der Veen. 2007. Evaluating Flood Damages: Guidance and Recommendations on Principles and Methods. Wallingford, UK: Integrated Flood Risk Analysis and Management Methodologies.
- Mioc, D., F. Anton, B. Nickerson, M. Santos, P. Adda, T. Tienaah, A. Ahmad et al. 2011. “Flood Progression Modelling and Impact Analysis.” In Efficient Decision Support Systems – Practice and Challenges in Multidisciplinary Domains, edited by C. Jao, 227–246. InTech.
- Nadal, N. C., R. E. Zapata, I. Pagán, R. López, and J. Agudelo. 2010. “Building Damage due to Riverine and Coastal Floods.” Journal of Water Resources Planning and Management 136 (3): 327–336. doi:10.1061/(ASCE)WR.1943-5452.0000036.
- NRE. 2000. Rapid Appraisal Method (RAM) for Floodplain Management. Melbourne, Australia: Read Sturgess and Associates for Department of Natural Resources and Environment, Victoria.
- OGC. 2007. Geography Markup Language (GML) Encoding Standard. Open Geospatial Consortium.
- OGC. 2012. OGC City Geography Markup Language (CityGML) Encoding Standard (Version 2.0). Open Geospatial Consortium.
- Pistrika, A. K., and S. N. Jonkman. 2010. “Damage to Residential Buildings due to Flooding of New Orleans after Hurricane Katrina.” Natural Hazards 54: 413–434. doi:10.1007/s11069-009-9476-y.
- Porter, K. A., A. S. Kiremidjian, and J. S. LeGrue. 2001. “Assembly-based Vulnerability of Buildings and Its Use in Performance Evaluation.” Earthquake Spectra 17 (2): 291–312. doi:10.1193/1.1586176.
- Rawlinsons. 2014. Rawlinsons Australian Construction Handbook 2014. 32nd ed. Welshpool, Western Australia: Rawlinsons.
- Roos, W. 2003. Damage to Buildings. Delft Cluster, The Netherlands: TNO, Built Environment and Geosciences.
- Rüppel, U., and K. Schatz. 2011. “Designing a BIM-based Serious Game for Fire Safety Evacuation Simulations.” Advanced Engineering Informatics 25: 600–611. doi:10.1016/j.aei.2011.08.001.
- Scawthorn, C., P. Flores, N. Blais, H. Seligson, E. Tate, S. Chang, E. Mifflin, et al. 2006. “HAZUS-MH Flood Loss Estimation Methodology. II. Damage and Loss Assessment.” Natural Hazards Review 7 (2) ( Special Issue: Multihazards Loss Estimation and HAZUS): 72–81. doi:10.1061/(ASCE)1527-6988(2006)7:2(72).
- Schubert, J. E., B. F. Sanders, M. J. Smith, and N. G. Wright. 2008. “Unstructured Mesh Generation and Landcover-based Resistance for Hydrodynamic Modeling of Urban Flooding.” Advances in Water Resources 31: 1603–1621. doi:10.1016/j.advwatres.2008.07.012.
- Schwarz, J., and H. Maiwald. 2008. “Damage and Loss Prediction Model Based on the Vulnerability of Building Types.” Paper presented at 4th International Symposium on Flood Defence: Managing Flood Risk, Reliability and Vulnerability, Toronto, Ontario, Canada, May 6–80.
- SES. 2012. Local Flood Guide Maribyrnong: Flood Information for the Maribyrnong River at Maribyrnong Township. Melbourne, Australia: Victorian State Emergency Services.
- Shojaei, D., A. Rajabifard, M. Kalantari, I. D. Bishop, and A. Aien. 2014. “Design and Development of a Web-based 3D Cadastral Visualisation Prototype.” International Journal of Digital Earth 1–20. doi:10.1080/17538947.2014.902512.
- Smith, D. I. 1994. “Flood Damage Estimation – A Review of Urban Stage Damage Curves and Loss Functions.” Water SA 20 (3): 231–238.
- Smith, G., and C. Wasko. 2012. Two Dimensional Simulations in Urban Areas – Representation of Buildings in 2D Numerical Flood Models. Manly Vale, New South Wales, Australia: The University of New South Wales.
- Snow, M., and D. Prasad. 2011. Change Adaptation for Building Designers: An Introduction. Australia: Environmental Design Guide.
- Solin, L., and P. Skubincan. 2013. “Flood Risk Assessment and Management: Review of Concepts, Definitions and Methods.” Geographical Journal 65: 23–44.
- Stadler, A., and T. H. Kolbe. 2007. “Spatio-Semantic Coherence in the Integration of 3D City Models.” Paper presented at 5th International ISPRS Symposium on Spatial Data Quality ISSDQ, Enschede, the Netherlands, June 13–15.
- Succar, B. 2009. “Building Information Modelling Framework: A Research and Delivery Foundation for Industry Stakeholders.” Automation in Construction 18 (3): 357–375. doi:10.1016/j.autcon.2008.10.003.
- Syme, W. J. 2008. “Flooding in Urban Areas – 2D Modelling Approaches for Buildings and Fences.” Paper presented at Engineers Australia, 9th National Conference on Hydraulics in Water Engineering, Darwin Convention Centre, Darwin, Australia, September 23–26.
- Thieken, A., M. Muller, H. Kreibich, and B. Merz. 2005. “Flood Damage and Influencing Factors: New Insights from the August 2002 Flood in Germany.” Journal of Water Resources Research 41 (12): W12430.
- USACE. 1985. Business Depth-damage Analysis Procedures. Alexandria, VA: Engineering Institute for Water Resources.
- Van de Lindt, J. W., and M. Taggart. 2009. “Fragility Analysis Methodology for Performance-based Analysis of Wood-Frame Buildings for Flood.” Natural Hazards Review 10 (3): 113–123. doi:10.1061/(ASCE)1527-6988(2009)10:3(113).
- VANZI. 2015. “Virtual Australia and New Zealand.” Accessed March 5. http://www.vanzi.com.au.
- Vickery, P. J., P. F. Skerlj, J. Lin, L. A. Twisdale, Jr., M. A. Young, and F. M. Lavelle. 2006. “HAZUS-MH Hurricane Model Methodology. II: Damage and Loss Estimation.” Natural Hazards Review 7 (2) (Special Issue: Multihazards Loss Estimation and HAZUS): 94–103. doi:10.1061/(ASCE)1527-6988(2006)7:2(94).
- Wingfield, J., M. Bell, and P. Bowker. 2005. Improving the Flood Resilience of Buildings through Improved Materials, Methods and Details: Review of Existing Information and Experience. Leeds: CIRIA.
- Wu, I.-C., and S.-H. Hsieh. 2007. “Transformation from IFC Data Model to GML Data Model: Methodology and Tool Development.” Journal of the Chinese Institute of Engineers 30: 1085–1090. doi:10.1080/02533839.2007.9671335.
- Zeiss, G. 2013. “Widespread Adoption of BIM by National Governments.” Accessed February 28. http://geospatial.blogs.com/geospatial/2013/07/widespread-adoption-of-bim-by-national-governments.html.
- Zhu, Q., M. Hu, Y. Zhang, and Z. Du. 2009. “Research and Practice in Three-Dimensional City Modeling.” Geospatial Information Sciences 12 (1): 18–24.