
Abstract
Volunteered geographic information (VGI) is the assembly of spatial information based on public input. While VGI has proliferated in recent years, assessing the quality of volunteer-contributed data has proven challenging, leading some to question the efficiency of such programs. In this paper, we compare several quality metrics for individual volunteers’ contributions. The data were the product of the ‘Cropland Capture’ game, in which several thousand volunteers assessed 165,000 images for the presence of cropland over the course of 6 months. We compared agreement between volunteer ratings and an image's majority classification with volunteer self-agreement on repeated images and expert evaluations. We also examined the impact of experience and learning on performance. Volunteer self-agreement was nearly always higher than agreement with majority classifications, and much greater than agreement with expert validations although these metrics were all positively correlated. Volunteer quality showed a broad trend toward improvement with experience, but the highest accuracies were achieved by a handful of moderately active contributors, not the most active volunteers. Our results emphasize the importance of a universal set of expert-validated tasks as a gold standard for evaluating VGI quality.
Introduction
Citizen involvement in natural and social science data collection and processing has grown quickly over the last decade. Although citizens have been involved in scientific research and conservation activities for a considerable time now (Miller-Rushing, Primack, and Bonney Citation2012), the recent widespread participation has been facilitated through the interactivity of Web 2.0, open access to high-resolution satellite imagery and the proliferation of mobile devices which can record photographic and location-based information. Citizen science has benefitted from digital earth innovations which provide geographical context and base data for citizen tasks. Citizen science can in turn enhance digital earth products, for instance by refining maps with tasks that machine learning algorithms struggle to perform. However, accompanying the growth of citizen science has been a growth in the need for tools to evaluate it and in the need for potentially costly expert validations as an external standard for evaluating the quality of such data. In this paper, we address several pressing questions about citizen science data evaluation and provide guidance not just on how best to evaluate data after collection, but also on how to guide its collection so that eventual analysis can be carried out more effectively.
There are many terms in the literature to refer to this citizen involvement in science. These include ‘crowdsourcing’ (Howe Citation2006) which is often used for commercial micro tasks, ‘volunteered geographic information’ (VGI; Goodchild Citation2007) for the collection of georeferenced information, and ‘citizen science’ (Bonney et al. Citation2009) which is the broader involvement of citizens in a range of scientific activities from data collection to data analysis and research design. However, regardless of the specific terminology, all of these activities share in common the distributed completion of small, clearly defined tasks.
Citizen science projects have successfully contributed to many fields of research such as the classification and discovery of new galaxies via Galaxy Zoo (Clery Citation2011), the identification of bird species via eBird (Sullivan et al. Citation2014), understanding the three-dimensional structures of proteins through the Fold-It game (Khatib et al. Citation2011), and land-cover classification of satellite imagery in Geo-Wiki, an application built using the Google Earth API (Fritz et al. Citation2009, Citation2012). Yet the quality of data collected by non-specialists remains an overarching concern (Flanagin and Metzger Citation2008), especially given the desire to integrate citizen-collected data with more authoritative sources (Coleman Citation2013) and the expected growth in this source of data in the future (See, Fritz, and de Leeuw Citation2013). Data quality considerations depend on the specific goal of the assigned task, such as whether they are from a commercial crowdsourcing platform such as Amazon Turk, for species identification and environmental monitoring, or for the collection of VGI, where the emphasis is on the spatial aspects of data and the mapping of objects. In this paper, we focus on quality considerations in a simple VGI task although the results presented here are relevant to many other types of simple crowdsourced tasks.
Data quality of VGI can be assessed via a number of different attributes. These include credibility of the data based on the existence of metadata or past performance of the contributors, the positional accuracy of data, the thematic quality or the tags associated with georeferenced objects, the spatial and attribute completeness of the data, how up-to-date the data is, and the logical consistency of data (Fonte et al. SubmCitationitted). Many recent studies have focused on quality assessment of OpenStreetMap, a very successful VGI initiative to map many different types of features such as roads and points of interest around the world (Ramm, Topf, and Chilton Citation2011). These studies have mainly examined the positional accuracy (Haklay Citation2010; Haklay et al. Citation2010; Neis, Zielstra, and Zipf Citation2011; Canavosio-Zuzelski, Agouris, and Doucette Citation2013), the completeness (Haklay Citation2010; Neis, Zielstra, and Zipf Citation2011; Hecht, Kunze, and Hahmann Citation2013), and the currency (Jokar Arsanjani et al. Citation2015) of OpenStreetMap, with the study by Girres and Touya (Citation2010) covering a broader range of accuracy assessment measures of French OpenStreetMap data. Other studies have examined the thematic quality of image classifications in Geo-Wiki (Comber et al. Citation2013; Foody et al. Citation2013; See et al. Citation2013) and shown varying levels of performance across contributors and across land-cover types. However, one of the issues with this dataset was not having sufficient data from multiple contributors at individual locations to develop statistically robust relationships between contributor performance, land-cover type, and other factors such as image resolution, location, etc. For this reason, we developed a simplified game version of Geo-Wiki called ‘Cropland Capture’ in which many images were rated by multiple contributors over a 6-month period.
There are many approaches to quality control for volunteer-contributed data. Allahbakhsh et al. (Citation2013) group these into eight classes. Some of these categories involve managing tasks to reduce the risk of poor-quality work (e.g. ‘real-time support’ and ‘workflow management’). Others, like ‘contributor evaluation’ assess the quality of a reviewer and assign this rating to all of their work. However, if no information other than the reviewer's work is available for this assessment, then this quickly becomes a chicken and egg problem. The remaining five approaches directly assess data quality, rather than managing it or using proxies. However, some of these approaches are essentially the same, at least in the context of land-cover validation. ‘Expert review’ is necessarily the source of gold standards for ‘ground truth.’ ‘Output agreement’ is simply ‘majority consensus’ between two workers. The final category, ‘input agreement,’ is defined as ‘Independent workers receive an input and describe it to each other. If they all decided its’ a same input, it's accepted as a quality answer’ (Allahbakhsh et al. Citation2013). In our view, this approach is not relevant to land-cover classification. If two workers are independently given images and rate them as cropland, they could be analyzing the same image, but this certainly does not prove it. Thus, the list of Allahbakhsh et al. (Citation2013) contains two approaches, ‘expert review’ and ‘majority consensus’ that are relevant to land-cover validation. To this, we add a third measure: the consistency of a volunteer with their previous ratings when an image is rated additional times.
In this paper, we use a simple binary crowdsourcing task to assess how best to evaluate volunteer quality and accuracy and use these results to provide guidance on the design of online games for VGI and other types of tasks. While schemes have long been sought for evaluation of task accuracy in the absence of external/expert validation (Dawid and Skene Citation1979; Bachrach et al. Citation2012; Digital Globe Citation2014), it is thought that, at least in some cases, reference data is required for true standardization of volunteer-contributed data (Bird et al. Citation2014). We show that the latter view is true, at least in our example of land-cover validation, by turning the approaches outlined in the previous paragraph into quantitative metrics and comparing their performance. Before we address these questions, we begin with an overview of the Cropland Capture game and the data that were collected during the game and the methods by which we analyze it.
The Cropland Capture game
Because games are now the most common smartphone application type (dotMobi Citation2014), and serious games (games with a purpose) and gamification of existing applications are becoming more common (Michael and Chen Citation2005; Deterding et al. Citation2011), Geo-Wiki was moved into a gaming environment in an attempt to increase participant numbers and to collect more data. As with previous Geo-Wiki crowdsourcing projects (Perger et al. Citation2012; Fritz et al. Citation2013), the goal of this game is to provide data that can improve global land-cover maps, in this case focusing on cropland. Although cropland cover is available globally from remotely sensed global land-cover products such as GLC-2000 (Fritz et al. Citation2003), MODIS (Friedl et al. Citation2010), GlobCover (Defourny et al. Citation2006), and the recent 30 m Chinese land-cover product (Yu et al. Citation2013), these products are not accurate enough for many applications. The ultimate goal of the game was to improve global cropland mapping by gathering data for training and validation, something that will be a part of future research.
In Cropland Capture, volunteer players (hereafter called ‘volunteers’) labeled imagery (either from satellites or ground-based photographs) to gain points and to become eligible for a prize drawing at the end of the game. The game ran for a period of 6 months from mid-November 2013 until early May 2014. Incentives for participation were prizes awarded at the end of the game, which included smartphones and tablets. To become part of the final draw, a volunteer had to rank among a week's top three scorers; scores were reset to 0 on a weekly basis at midnight each Friday. Some individuals made it into the top three in many different weeks so they increased their chances of winning the prizes at the end. Special weekly prizes were added in the last 5 weeks of the game to motivate additional participation. Although prizes are no longer offered, the game can still be played online at www.geo-wiki.org/games/croplandcapture. The data analyzed in this paper come only from the 6-month period noted above.
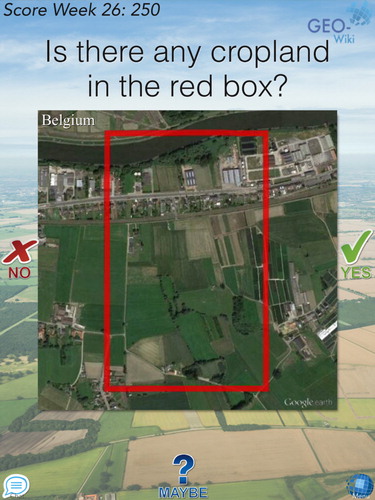
shows the game interface with an example image. The user is asked ‘Is there cropland in the red box?’ and chooses from three choices: ‘cropland,’ ‘not cropland,’ and ‘maybe cropland.’ If even a small fraction of the image contains cropland, then it should be rated as ‘cropland.’ Cropland is defined as arable land and permanent crops based on the FAO definition (http://faostat.fao.org/site/375/default.aspx). Arable land consists of temporary agricultural crops, land under market and kitchen gardening and land temporarily fallow (less than 5 years) while permanent crops include cocoa and coffee but not forest plantations. Permanent meadows and pastures for grazing are not included in this definition, but land regularly mowed for hay is included. Volunteers were provided with a gallery of images to illustrate different types of cropland that they might see and to emphasize that the presence of any cropland at all, no matter how small, should result in a rating of ‘cropland.’
The bulk of the images came from locations in the global validation dataset of Zhao et al. (Citation2014). These images were satellite-derived and roughly square, ranging from 100 m to 1 km on a side. Regardless of the scale of the presented scene, all images showed up as about the same size on the volunteer's device. Most of these images were high resolution, but some Landsat images were included where better resolution was not available. In addition to these satellite-based images, we used ground-based photos from the Degree Confluence Project (http://confluence.org). The dates associated with the imagery were recorded separately.
In this paper, we take the term ‘classification’ to mean a decision made about the content of an image. For our purposes, this can be based either on expert validation, or on the majority of volunteer responses (excluding ratings of ‘maybe’). For clarity, we use the term ‘rating’ to refer to a single decision by a single volunteer about a single image, in contrast to the collective, majority classification. We recognize that the majority classification is not necessarily correct and that in extreme cases some images may not even be classifiable, for example because of insufficient resolution or clouds obscuring the landscape. We address these issues of external validity using expert validations in the following section.
For each correct rating, the volunteer receives a single point. In this paper, we use the word ‘rating’ to mean the decision made by an individual volunteer about whether an image is cropland or not. For incorrect answers, the volunteer loses one point. If a volunteer answers ‘maybe,’ then they do not gain or lose any points. For the purpose of awarding points, correct answers were defined solely by the game's participants and gave some benefit of the doubt when there was not a strong majority classification. If ≥80% of an image's ratings (excluding responses of ‘maybe’) were cropland, then only responses of ‘yes’ were considered correct. Similarly, if ≤20% of all non-maybe answers were ‘cropland,’ then ‘no’ was the only correct answer. However, if the proportion of cropland ratings was between 20% and 80%, or if the image had never previously been rated, either ‘yes’ or ‘no’ was credited as a correct response. While not having an explicit empirical basis, the values of 20% and 80% represent a tradeoff between identifying correct answers and penalizing wrong answers. Had these values been looser (i.e. closer to 0% and 100%), a few careless ratings of an easy image would result in all ratings being considered correct. On the other hand, if the values had been more stringent (i.e. closer to 50%), many potentially correct ratings of confusing and controversial images would be penalized.
We took several steps to reduce the possibility of playing the game in a way that provided little useful information. First, the proportion of images with and without cropland was approximately balanced (). This reduced the possibility for point accrual from random guessing. However, since both cropland and non-cropland were rewarded as correct answers for certain images (see previous paragraph), this problem could not be ruled out completely. To ensure that random play did not bias our results, we manually examined patterns of agreement with majority classifications for the most active participants (those rating at least 1000 images), and found no evidence of insincere participation. All participants took breaks and worked at uneven rates, so it is unlikely that any were bots. It is also possible that volunteers would over-use the ‘maybe’ rating, providing information only on the easiest images. This did not happen. Because image acquisition was automated, and it was impossible to check the quality of 165,000 images, some images entered rotation but were later decided by expert review to be unclassifiable. Examples include clouds, extremely low resolution and a few that were blank due to failed downloads. Even in these extreme cases, the proportion of ‘maybe’ ratings almost never exceeded 50%, suggesting that most volunteers erred toward guessing on hard images rather than toward caution, in spite of the risk of losing points.
Table 1. The volunteer-specific metrics used in this article.
Table 2. Error matrix for agreement of individual volunteer ratings with the majority classification of all volunteers for images in the Cropland Capture game.
We also took measures to reduce other sources of bias in our findings. It is possible that volunteers would perform better in evaluating images from familiar landscapes, particularly from regions where they live or have lived. While a ‘home field advantage’ cannot be ruled out, it should have little or no impact on our findings as all participants were given randomly selected images from all regions of the world; thus, all volunteers enjoyed this advantage occasionally, unless they came from a place with absolutely no agriculture. Similarly, variation in the difficulty of images is unlikely to affect outcomes of this research. While we show that such variation certainly exists, the random assignment of images again prevents systematic bias. It is possible that chance drawing of particularly easy or difficult sets of images could bias the metrics for a volunteer who contributed only a small number of ratings. However, our results were quite robust to inclusion of only contributors with >1000 images rated, suggesting that task difficulty does not bias our findings.
Analytical methods
To compute volunteer quality metrics, it was first necessary to compute some image-specific metrics. We summed the number of times each image was rated in each of the three categories, and computed the proportion of responses in each category. Each image was then classified either as cropland or non-cropland based on which of these two possibilities received the most ratings from the volunteers. Note that these classifications were on the basis of a simple majority vote, and that this is different from the procedure described above for awarding points. Some images had an equal number of ratings in the cropland and no cropland categories so were classified as ties and not used in subsequent analyses. In determining the majority classification of an image, ratings of ‘maybe’ were omitted, no matter how frequently they were used.
For each volunteer, we computed several performance measures which form the basis for these analyses. A summary of these metrics is seen in . Total output was measured with the number of images rated (including repeats) or the number of images receiving a non-maybe (i.e. cropland or non-cropland) rating. The quality of volunteer output was assessed in several ways. Each contributor's rate of agreement with majority-based classifications (see above) was calculated. For images rated more than once by a volunteer, a self-agreement rate was computed as the proportion of subsequent ratings agreeing with initial ratings. Ratings of ‘maybe’ were not counted in either the majority-agreement or self-agreement ratings. However, the ratio of ‘maybe’ ratings to all ratings was computed as a metric of caution. Ability to detect the two different cover types was assessed by separately calculating the proportion of cropland and non-cropland ratings that were correct.
We used regression analysis to test the relationship between different aspects of contributors’ performance. For certain variable pairs, we have reasons to hypothesize a causal relationship, for instance, the hypothesis that accuracy increases with experience. Because the independent variable (total images rated) is measured without error, it is appropriate to use standard ordinary least squares (OLS) regression in this case. However, for other variable pairs, there is no theoretical reason to expect most metrics to be more accurately measured than others as we believe that all such metrics are reflections of an underlying (and unobserved) quality variable. Thus, it is inappropriate to use OLS regression because it assumes that all error is contained in the dependent variable. Instead, we employ major-axis regression (also known as type II regression) as implemented in the R package lmodel2. This method does not assume any underlying differences between the variables being analyzed, and unlike OLS regression, returns the same result when the identity of the variables is switched (Legendre and Legendre Citation1988). For some variables, log transformations were used to improve homoscedasticity. A side effect of this fix is that it eliminates values of zero. To circumvent this problem, we added one-half of the smallest non-zero value to variables containing values of zero before log transformation. Because neither of these methods is perfectly suited to our data, we report both as complementary outcomes.
In some cases, we were interested to uncover not just patterns among typical volunteers, but also patterns among top volunteers as they contribute disproportionately to the eventual land-cover classification goals of Cropland Capture. For this purpose, we used quantile regressions (Cade and Noon Citation2003), implemented in the R package quantreg. Quantile regression does not rely on the distributional assumptions of OLS regression so is particularly suited to the heteroskedastic patterns seen between many of the quality metrics. However, quantile regression still assumes error only in the dependent variable, so is best suited to relationships where one variable is precisely known. Another limitation of quantile regression is that it is not possible to compute an R 2 value in the classical sense, so instead we compute a pseudo-R 2, known as ‘ρ,’ as an estimate of goodness of fit (Koenker and Machado Citation1999).
To analyze patterns of learning, we plotted learning curves based on the proportion of each 100 ratings that agreed with the majority classification (ratings of ‘maybe’ and images for which the classification was a tie vote between ‘cropland’ and ‘non-cropland’ were omitted). While a few participants showed visibly recognizable learning curves, most did not, either showing consistent performance or occasional valleys of very poor performance. Because these curves were so heterogeneous, they do not lend themselves to quantitative analysis and we do not report further on them.
As a more quantitative approach to the question of contributor learning, we examined the direction of change (relative to the majority classification) when a participant changed their rating from ‘cropland’ to ‘non-cropland’ or vice versa between the first and second viewing of the same image. In total, this happened 38,344 times (ratings of ‘maybe’ were omitted). To assess possible learning over time, we evaluated whether switches toward agreement with the majority classification were more common than changes away from the majority classification. This was evaluated statistically with a binomial test with an expected probability of 50% (i.e. that changes were random).
In addition to volunteer ratings, 342 images were selected at the end of the game for expert validation to provide a baseline for evaluation of volunteers. These were not selected at random, but rather chosen to include different types of easy and difficult images. Easy images were roughly split between those where the majority classification overwhelmingly agreed on ‘cropland’ and ‘non-cropland.’ Difficult images came from several categories: images with many ratings in both the non-cropland and cropland categories, images with many ‘maybe’ ratings, images for which top volunteers (as assessed by majority-agreement rate) did not agree with the majority classification, and images where top raters disagreed with one another.
In the expert validation process, two remote sensing specialists (authors LS and SF) independently evaluated the 342 selected images in the same way as game volunteers, i.e. giving a response of ‘yes,’ ‘no,’ or ‘maybe.’ Images for which the two specialists disagreed in their rating, or for which they both responded ‘maybe,’ were reviewed in a group to determine whether one of them failed to notice some feature on the landscape. In some cases, input from regional experts was sought to interpret unexplained landscape features or additional local imagery was viewed either to provide landscape context or view questionable features in more detail. However, the ultimate determination for each image was made based on whether a skilled viewer could reasonably be expected to rate that image with no external information, and if so, what the correct rating would be.
Results
A total of 2783 volunteers contributed ratings to Cropland Capture between November 2013 and May 2014. The game included 165,439 different images. Of these, 50.3% were satellite images, and 49.7% were ground-based photographs. Combining all volunteers and images, a grand total of 4,547,038 ratings were delivered. This total figure includes images that were seen more than once by a particular user to test repeatability of their ratings. For a typical contributor, the percentage of repeat images was small although the total value was inflated to 38.3% of ratings due to a small number of volunteers who contributed more ratings than the number of available images. The number of ratings performed by individual volunteers is log-normally distributed and ranges from 2 to 593,572. Volunteers came from all regions of the world, but with a bias toward wealthier countries.
Overall, volunteers disagreed with the majority classification of images 5.6% of the time (). Majority-agreement rate for contributors with more than 1000 ratings ranged from 83.4% to 98.8%. When volunteers rated an image more than once, they agreed with their initial rating 96.5% of the time. Among those who rated more than 1000 images, self-agreement with previous ratings ranged from 88.8% to 100%. The average user gave a response of ‘maybe’ on 4.3% of ratings. For those rating >1000 images, this rate ranged from 0.0% to 15.4%.
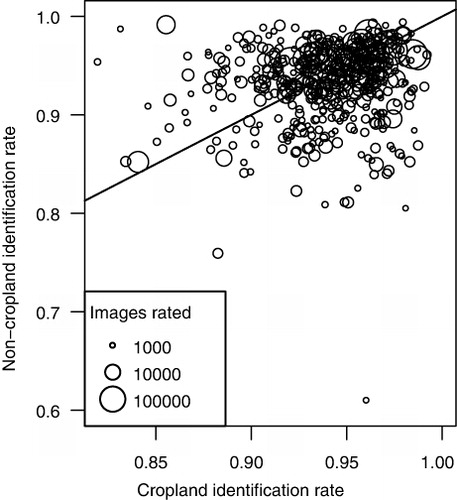
Across contributors, ratings showed very little bias toward either cropland or non-cropland (, ). The rates of correctly identifying cropland and non-cropland were nearly identical (). User's and producer's accuracies were virtually identical for both image types; all values fell between 94.3% and 94.5% (). However, many individual volunteers showed some bias toward cropland or non-cropland. Those with very many images rated showed both lower bias and higher overall accuracy (; note the concentration of large circles in the upper right corner of the figure). Among volunteers who rated fewer images, biases were more strongly exhibited ().
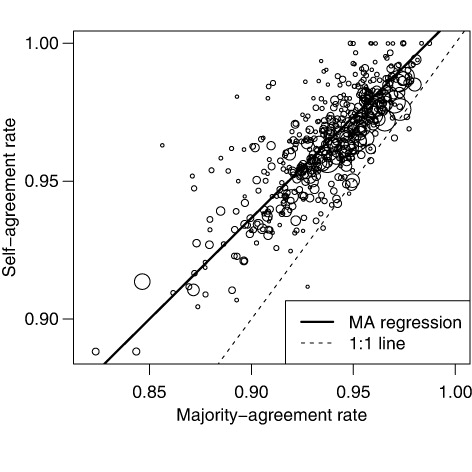
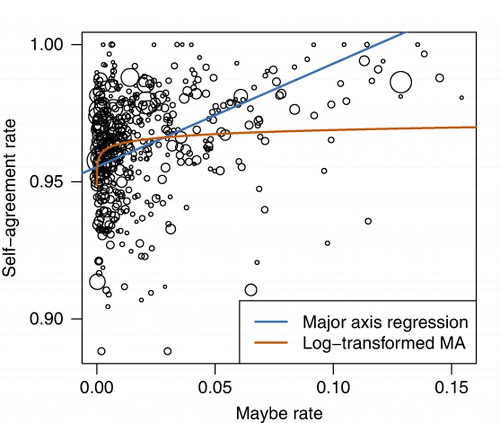
Nearly all volunteers showed greater self-agreement than majority-agreement (). Even so, there was a strong positive relationship between these variables, with volunteers who are more self-consistent showing greater majority-agreement (; major-axis regression; p<.0001; R 2=.634). Volunteer self-agreement increased with use of the ‘maybe’ response (). This trend was seen regardless of whether we used the raw variables (p<.0001, R 2=.0864) or log-transformations of the variables (p<.0001, R 2= .0362).
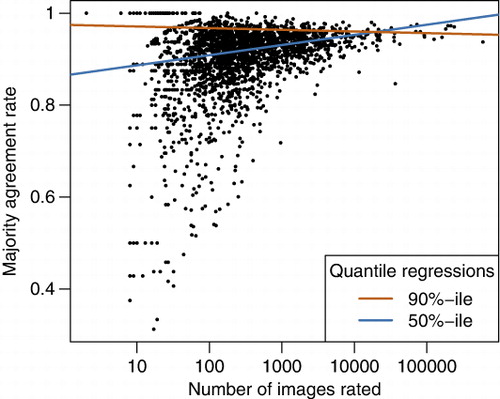
The total number of images rated by a volunteer shows a complex relationship with rating quality. Volunteers’ median rate of majority-agreement increases significantly with total images rated in the game (quantile regression with τ=.5; p<.0001, ρ=.65; ; note that ‘τ’ is the quantile level of the regression and that ‘ρ’ is a measure of goodness of fit, analogous to R 2 in OLS regression). However, among top performing volunteers, this relationship is reversed (quantile regression with τ=.9; p=.0005, ρ=.93; ). When only contributors with substantial experience (>1000 images rated) were considered, some of these relationships changed considerably. Median volunteers still showed improved majority-agreement rate as images rated increased (p < .0001, ρ=.05), but the slope of 90th percentile volunteers became significantly positive (p=.0002; ρ=.09).
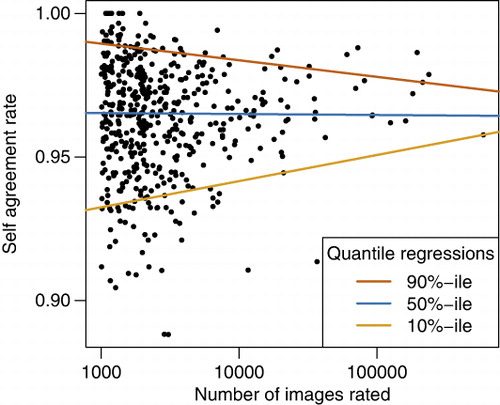
Volunteer self-agreement rate showed similar patterns to majority-agreement rate with increasing experience (). Because volunteers received only occasional repeat images (to reduce the likelihood of them remembering having seen it before), this calculation was only possible for contributors who performed large numbers of ratings. As above, we used a minimum of 1000 ratings as the cutoff. In contrast to majority-agreement rate, the median user's self-agreement rate decreased slightly but non-significantly with experience (p=.728). The top volunteers (90th percentile of self-agreement rate) showed a more strongly negative trend toward less self-agreement with increasing experience (p=.018, ρ=.019). Only the lowest ranking contributors (10th percentile of self-agreement rate) showed an increase in self-agreement rate with experience (p=.0015, ρ=.014). More direct evidence for volunteer learning was provided by the directional analysis of self-contradictions. Overall, 54.7% of changed ratings between the first and second viewing of an image were in the direction of agreement with the majority classification and 45.3% were in the opposite direction. This trend is statistically strong (binomial test, p<.0001).
Among volunteers who rated more than 15 images that were validated by experts, expert-agreement rate ranged from 5% to 93%. This value was consistently less than the majority-agreement rate. Each volunteer disagreed with the experts more than with the majority classification, typically by a very wide margin (). However, there was still a positive association between volunteers’ majority- and expert-agreement rates although with little predictive power (logit-transformed major-axis regression, p=.001, R 2=.113). The rate of disagreeing with one's previous ratings of the same image also underestimated expert-validated accuracy rates; all volunteers disagreed with experts more than with themselves, and in nearly all cases this discrepancy was large.
![Figure 7. The relationship between the majority-agreement rate and expert-agreement rate of volunteers in the Cropland Capture game. Each point represents a single volunteer who rated at >15 images that were also classified by experts. The solid line is a 1:1 line, showing that all volunteers agreed with the majority classification more often than with experts. The dashed line shows the correlation between the two variables using major-axis regression. The line is not straight because expert agreement rate was logit transformed before regression to avoid predictions beyond the possible range of [0,1].](/cms/asset/a8bf4f4b-1201-481e-b8b1-9392b8e67a06/tjde_a_1039609_f0007_b.jpg)
Discussion
This paper has compared agreement with experts, agreement with the majority of other volunteers and consistency in repeated ratings of an image as metrics to compare the quality of performance on a simple land-cover identification task. While all of these metrics are somewhat correlated with one another, they give insight into different facets of volunteers’ performance, a subject elaborated on below. We have shown that many volunteers exhibit a clear and quantifiable bias in their ratings, and are more likely to correctly identify ‘cropland’ than ‘non-cropland’ or vice-versa. We have also demonstrated limited effects of improved quality of responses with increased game play. Finally, this work has shown that majority-agreement and self-agreement are not fully able to substitute for experts to validate the quality of crowdsourced tasks. In the process, we have uncovered certain design habits that promote easier downstream extraction of information from games for the solicitation of VGI. All of this information has important implications for the design of serious games and the choice of metrics used to evaluate and compensate their volunteers.
The independence of volunteers’ true positive and true negative rates has consequences for devising schemes for volunteer scoring and compensation. We do not provide specific guidance here as this is a decision that depends on the goals of a game and the relative benefit of correct answers and cost of incorrect answers. However, it is worth keeping in mind that because individuals can show very different patterns of these errors, not taking into account their strengths and weaknesses may inadvertently lead to less efficient accrual of the information that game managers seek. This would waste the time of volunteers, expert validators, and game managers.
That the direction of the relationship between the number of images rated to majority-agreement rate changes with quantile suggests that more than one process governs this relationship. Our interpretation is that volunteers do learn to better identify cropland with experience, as shown by the analysis of switched responses when re-rating images. However in order to rate a really big number of images, it is not possible to spend much time on individual images. Therefore, the most active raters can be expected to have a somewhat higher error rate than the best intermediate-experience volunteers. However, this conclusion should be drawn with caution as these patterns seem to weaken when only contributors who have rated >1000 images are included.
At first glance, the comparison of the different metrics of volunteer quality suggests that volunteers are highly effective at rating photographs and satellite imagery for the presence of cropland. Consistency was high relative both individual volunteers’ previous ratings of the same images, and with other volunteers’ ratings of those images. Further, self-agreement rate and majority-agreement rate are positively correlated. The subtle differences between these two metrics seem to indicate that volunteers are generating meaningful data. Self-agreement rate can be interpreted in two ways. It could be seen as a direct indicator of undesirable sloppiness, or at least indecisiveness. It could also be an indicator of learning; in reality, it is likely a combination of both. As an indicator of learning, we found direct evidence – disagreement with one's previous ratings of an image shows a significant tendency toward agreement with the majority classification. In spite of the statistical strength of this relationship, the split between switching to and from agreement with the majority classification was less than 10 percentage points (54.7% vs. 45.3%). That there is much more noise than signal in this shift, suggesting that self-contradiction can be useful as a measurement of sloppiness or indecisiveness, in spite of the toward-crowd bias. Self-agreement is an assessment of volunteer quality that can be made independently of any knowledge of the correctness of responses, but the rate of agreement with the majority classification is not a judgment made in a vacuum; it depends on the responses of many other volunteers. Taken together, the correlation among these two metrics shows that volunteers who are careful (i.e. rarely contradict their previous answers to repeated images) are also more likely to agree with the majority classification. That volunteers who are unequivocally better in one respect (they are self-consistent) are also in greater agreement with the majority classification suggests that the crowd is providing useful information.
Unfortunately, results from expert validation temper this apparent good news. In spite of self-consistent volunteers’ also agreeing better with majority classifications of images, few volunteers exhibited anything close to the level of agreement with experts that they shared with the other volunteers in the game (). This shows that there is a collective behavior of the crowd that, in spite of being shared among many volunteers, is at odds with the explicit goal of the game. The incoherence of results derived in these two ways suggests that extracting a reliable signal from crowdsourced data without guidance from expert validations is not possible for this type of task. This is not a difficult problem to surmount, but it does mean that a certain degree of effort is required to plan campaigns so that the crowd is channeled into the desired way of rating images.
The need for expert validations calls to attention another problem that arises when many raters evaluate a huge number of tasks. The problem is that in some situations, it is impossible to choose validation images at the end of a competition such that most volunteers have looked at enough of them for volunteer-specific comparison with expert ratings. In our study, only 194 of the 2,783 participants performed at least 15 ratings of images that were chosen for validation by experts (shown in ). While these images were selected to include a range of difficulties rather than to maximize the number of expert-validated images rated by volunteers, selecting for the latter goal would not have greatly increased the overlap between expert- and volunteer-viewed images. When tasks from a very large pool are more or less randomly assigned to a much smaller number of raters, it is inevitable that the number of validated tasks necessary to robustly compare volunteers is prohibitively large. The solution is having a pre-defined set of tasks that are assigned to most or all volunteers. While it may seem pointless to have a group of individual images that are each rated by thousands of different people, this pattern of play is necessary to robustly evaluate contributor quality, and also simplifies implementing the other metrics discussed in this paper.
Disclosure statement
No potential conflict of interest was reported by the authors.
Additional information
Funding
References
- Allahbakhsh, M., B. Benatallah, A. Ignjatovic, H. R. Motahari-nezhad, E. Bertino, and S. Dustdar. 2013. “Quality Control in Crowdsourcing Systems.” IEEE Internet Computing 17 (2): 76–81. doi:10.1109/MIC.2013.20.
- Bachrach, Y., T. Minka, J. Guiver, and T. Graepel. 2012. “How to Grade a Test without Knowing the Answers – A Bayesian Graphical Model for Adaptive Crowdsourcing and Aptitude Testing.” ArXiv, 1206.6386. http://arxiv.org/abs/1206.6386.
- Bird, T. J., A. E. Bates, J. S. Lefcheck, N. A. Hill, R. J. Thomson, G. J. Edgar, R. D. Stuart-Smith et al. 2014. “Statistical Solutions for Error and Bias in Global Citizen Science Datasets.” Biological Conservation 173: 144–154. doi:10.1016/j.biocon.2013.07.037.
- Bonney, R., C. B. Cooper, J. Dickinson, S. Kelling, T. Phillips, K. V. Rosenberg, and J. Shirk. 2009. “Citizen Science: A Developing Tool for Expanding Science Knowledge and Scientific Literacy.” BioScience 59: 977–984. doi:10.1525/bio.2009.59.11.9.
- Cade, B. S., and B. R. Noon. 2003. “A Gentle Introduction to Quantile Regression for Ecologists.” Frontiers in Ecology and the Environment 1: 412–420. doi:10.1890/1540-9295(2003)001[0412:AGITQR]2.0.CO;2.
- Canavosio-Zuzelski, R., P. Agouris, and P. Doucette. 2013. “A Photogrammetric Approach for Assessing Positional Accuracy of OpenStreetMap© roads.” ISPRS International Journal of Geo-Information 2: 276–301. doi:10.3390/ijgi2020276.
- Clery, D. 2011. “Galaxy Zoo Volunteers Share Pain and Glory of Research.” Science 333 (6039): 173–175. doi:10.1126/science.333.6039.173.
- Coleman, D. 2013. “Potential Contributions and Challenges of VGI for Conventional Topographic Base-mapping Programs.” In Crowdsourcing Geographic Knowledge, edited by Sui, D. S. Elwood, and M. Goodchild, 245–263. Dordrecht: Springer.
- Comber, A., L. See, S. Fritz, M. Van der Velde, C. Perger, and G. Foody. 2013. “Using Control Data to Determine the Reliability of Volunteered Geographic Information about Land Cover.” International Journal of Applied Earth Observation and Geoinformation 23: 37–48. doi:10.1016/j.jag.2012.11.002.
- Dawid, A. P., and A. M. Skene. 1979. “Maximum Likelihood Estimation of Observer Error-rates using the EM Algorithm.” Applied Statistics 28 (1): 20–28. doi:10.2307/2346806.
- Defourny, P., C. Vancustem, P. Bicheron, C. Brockmann, F. Nino, L. Schouten, and M. Leroy. 2006. “GLOBCOVER: A 300m Global Land Cover Product for 2005 using ENVISAT MERIS Time Series.” Proceedings of the ISPRS Commission VII Mid-Term Symposium: Remote Sensing: From Pixels to Processes. Enscede NL.
- Deterding, S., M. Sicart, L. Nacke, K. O’Hara, and D. Dixon. 2011. Gamification: using Game-design Elements in Non-gaming Contexts. New York: ACM Press, 2425.
- Digital Globe. 2014. DigitalGlobe Crowdsourcing. https://www.digitalglobe.com/sites/default/files/Crowdsourcing-DS-CROWD.pdf
- dotMobi. 2014. Global Mobile Statistics 2013 Section E: Mobile Apps, App Stores, Pricing and Failure Rates. Accessed 7 March 2014. http://mobithinking.com/mobile-marketing-tools/latest-mobile-stats/e#popularappcatagories.
- Flanagin, A., and M. Metzger. 2008. “The Credibility of Volunteered Geographic Information.” GeoJournal 72 (3–4): 137–148. doi:10.1007/s10708-008-9188-y.
- Fonte, C. C., L. Bastin, L. See, G. M. Foody, F. Lupia, and R. Vatseva. Submitted. “Usage of VGI for Validation of Land Cover Maps.” International Journal of Geographical Information Science.
- Foody, G. M., L. See, S. Fritz, M. Van der Velde, C. Perger, C. Schill, and D. S. Boyd. 2013. “Assessing the Accuracy of Volunteered Geographic Information Arising from Multiple Contributors to an Internet based Collaborative Project.” Transactions in GIS 17: 847–860. doi:10.1111/tgis.12033.
- Friedl, M. A., D. Sulla-Menashe, B. Tan, A. Schneider, N. Ramankutty, A. Sibley, and X. Huang. 2010. “MODIS Collection 5 Global Land Cover: Algorithm Refinements and Characterization of New Datasets.” Remote Sensing of Environment 114 (1): 168–182. doi:10.1016/j.rse.2009.08.016.
- Fritz, S., E. Bartholomé, A. Belward, A. Hartley, H.-J. Stibig, H. Eva, and P. Mayaux. 2003. Harmonisation, Mosaicing and Production of the Global Land Cover 2000 Database (Beta Version). Luxembourg: Office for Official Publications of the European Communities, No. EUR 20849EN.
- Fritz, S., I. McCallum, C. Schill, C. Perger, R. Grillmayer, F. Achard, F. Kraxner, and M. Obersteiner. 2009. “Geo-Wiki.Org: The Use of Crowdsourcing to Improve Global Land Cover.” Remote Sensing 1 (3): 345–354. doi:10.3390/rs1030345.
- Fritz, S., I. McCallum, C. Schill, C. Perger, L. See, D. Schepaschenko, M. van der Velde, F. Kraxner, and M. Obersteiner. 2012. “Geo-Wiki: An Online Platform for Improving Global Land Cover.” Environmental Modelling & Software 31: 110–123. doi:10.1016/j.envsoft.2011.11.015.
- Fritz, S., L. See, M. van der Velde, R. A. Nalepa, C. Perger, C. Schill, I. McCallum et al. 2013. “Downgrading Recent Estimates of Land Available for Biofuel Production.” Environmental Science & Technology 47: 1688–1694.
- Girres, J.-F., and G. Touya. 2010. “Quality Assessment of the French OpenStreetMap Dataset.” Transactions in GIS 14: 435–459. doi:10.1111/j.1467-9671.2010.01203.x.
- Goodchild, M. F. 2007. “Citizens as Sensors: The World of Volunteered Geography.” GeoJournal 69 (4): 211–221. doi:10.1007/s10708-007-9111-y.
- Haklay, M. 2010. “How Good is Volunteered Geographical Information? A Comparative Study of OpenStreetMap and Ordnance Survey Datasets.” Environment and Planning B: Planning and Design 37: 682–703. doi:10.1068/b35097.
- Haklay, M., S. Basiouka, V. Antoniou, and A. Ather. 2010. “How Many Volunteers does it take to Map an Area Well? The Validity of Linus’ Law to Volunteered Geographic Information.” The Cartographic Journal 47: 315–322. doi:10.1179/000870410X12911304958827.
- Hecht, R., C. Kunze, and S. Hahmann. 2013. “Measuring Completeness of Building Footprints in OpenStreetMap over Space and Time.” ISPRS International Journal of Geo-Information 2: 1066–1091. doi:10.3390/ijgi2041066.
- Howe, J. 2006. “The Rise of Crowdsouring.” Wired Magazine, 14 (6). http://archive.wired.com/wired/archive/14.06/crowds_pr.html.
- Jokar Arsanjani, J., M. Helbich, M. Bakillah, and L. Loos. 2015. “The Emergence and Evolution of OpenStreetMap: A Cellular Automata Approach.” International Journal of Digital Earth 8: 1–15.
- Khatib, F., F. DiMaio, F. C. Group, F. V. C. Group, S. Cooper, M. Kazmierczyk, M. Gilski et al. 2011. “Crystal Structure of a Monomeric Retroviral Protease Solved by Protein Folding Game Players.” Nature Structural & Molecular Biology 18: 1175–1177. doi:10.1038/nsmb.2119.
- Koenker, R., and J. A. F. Machado. 1999. “Goodness of Fit and Related Inference Processes for Quantile Regression.” Journal of the American Statistical Association 94: 1296–1310. doi:10.1080/01621459.1999.10473882.
- Legendre P., and L. Legendre. 1988. Numerical Ecology. Number 20 in Developments in Environmental Modelling. 2nd ed. Amsterdam: Elsevier.
- Michael, D. R., and S. L. Chen. 2005. Serious Games: Games that Educate, Train, and Inform. Cincinnati, OH: Muska & Lipman/Premier-Trade.
- Miller-Rushing, A., R. Primack, and R. Bonney. 2012. “The History of Public Participation in Ecological Research.” Frontiers in Ecology and the Environment 10: 285–290. doi:10.1890/110278.
- Neis, P., D. Zielstra, and A. Zipf. 2012. “The Street Network Evolution of Crowdsourced Maps: OpenStreetMap in Germany 2007–2011.” Future Internet 4 (4): 1–21. doi:10.3390/fi4010001.
- Perger, C., S. Fritz, L. See, C. Schill, M. van der Velde, I. McCallum, and M. Obersteiner. 2012. “A Campaign to Collect Volunteered Geographic Information on Land Cover and Human Impact.” In GI_Forum 2012: Geovisualisation, Society and Learning, edited by Jekel, T., A. Car, J. Strobl, and G. Griesebner, 83–91. Berlin/Offenbach: Herbert Wichmann Verlag.
- Ramm, F., J. Topf, and S. Chilton. 2011. OpenstreetMap: Using and Enhancing the Free Map of the World. Cambridge: UIT Cambridge.
- See, L., A. Comber, C. Salk, S. Fritz, M. van der Velde, C. Perger, C. Schill, I. McCallum, F. Kraxner, and M. Obersteiner. 2013. “Comparing the Quality of Crowdsourced Data Contributed by Expert and Non-experts.” PLoS One 8 (7): e69958. doi:10.1371/journal.pone.0069958.t012.
- See, L., S. Fritz, and J. de Leeuw. 2013. “The Rise of Collaborative Mapping: Trends and Future Directions.” ISPRS International Journal of Geo-Information 2: 955–958. doi:10.3390/ijgi2040955.
- Sullivan, B. L., J. L. Aycrigg, J. H. Barry, R. E. Bonney, N. Bruns, C. B. Cooper, T. Damoulas et al. 2014. “The eBird Enterprise: An Integrated Approach to Development and Application of Citizen Science.” Biological Conservation 169: 31–40. doi:10.1016/j.biocon.2013.11.003.
- Yu, L., J. Wang, N. Clinton, Q. Xin, L. Zhong, Y. Chen, and P. Gong. 2013. “FROM-GC: 30 m Global Cropland Extent Derived through Multisource Data Integration.” International Journal of Digital Earth 6: 550–562. doi:10.1080/17538947.2011.628414.
- Zhao, Y., P. Gong, L. Yu, L. Hu, X. Li, C. Li, H. Zhang et al. 2014. “Towards a Common Validation Sample Set for Global Land-cover Mapping.” International Journal of Remote Sensing 35: 4795–4814. doi:10.1080/01431161.2014.930202.