
ABSTRACT
Geothermal data are published using different IT services, formats and content representations, and can refer to both regional and global scale information. Geothermal stakeholders search for information with different aims. E-Infrastructures are collaborative platforms that address this diversity of aims and data representations. In this paper, we present a prototype for a European Geothermal Information Platform that uses INSPIRE recommendations and an e-Infrastructure (D4Science) to collect, aggregate and share data sets from different European data contributors, thus enabling stakeholders to retrieve and process a large amount of data. Our system merges segmented and national realities into one common framework. We demonstrate our approach by describing a platform that collects data from Italian, French, Hungarian, Swiss and Icelandic geothermal data providers.
1. Introduction
Providers of geothermal information tend to differ in terms of data-sharing services. Each provider usually designs and builds its own information system independently. Scientists, operators and consultants organize and use geothermal databases, which contain underground data and provide maps (e.g. temperature and heat flow distributions), which are seldom accessible to the public. Regional, national and European administrations produce, collect and organize regulations, documents, reports, descriptions and maps of geothermal leases and authorizations, together with energy production values. Information providers publish general information (e.g. definitions, terms) in the form of texts and figures. Manufacturers have their own form, none of which looks at a more general picture of the geothermal world. Funding and insurance agencies require and organize the information required to create risk management and economic analyses.
The data sets and services produced in this heterogeneous scenario are usually aimed at national stakeholders, and are provided in the local language with specialized applications.
Managing a large quantity of heterogeneous data (e.g. geothermal maps, well data, regulatory documents, monitoring data, list of training courses) requires a structured data organisation and information analysis and recovery systems that produce results quickly and efficiently.
In the geothermal domain as well as in other geosciences, many solutions have been found having the same aims as the Digital Earth vision (Gore Citation1999). In fact, a crucial point in the Digital Earth vision is the integration of services, tools and data (Grossner, Goodchild, and Clarke Citation2008).
Thanks to the technological evolution of data management systems and the developments in EU regulations (EU Commission Citation2010; INSPIRE directive Citation2007), data integration and analysis can be performed through platforms that manage both structured and unstructured data. In particular, regulations establish the specifications for the interoperability of spatial data sets and services. For example, they advise (i) the extension of geographical grid systems to accommodate multi-resolution grids based on geographic coordinates, (ii) the identification of geodetic datums by means of specific metadata, (iii) the (hierarchical) code lists and reference vocabularies required to describe data and metadata, (iv) the allowed types and attributed for spatial features. E-Infrastructures are collaborative platforms that can effectively address this data heterogeneity and the related management issues.
In this paper, we describe a prototype for a European Geothermal Information Platform (EGIP). The design and the implementation are based on the D4Science e-Infrastructure (Candela, Castelli, and Pagano Citation2009) that collects and aggregates data sets from different European contributors that have harmonized data according to the INSPIRE requirements and technical recommendations (EU Commission Citation2010). In the end, D4Science produces a unique geothermal information system. The e-Infrastructure also supports statistical analysis and data aggregation services. Our aim is to challenge the existing fragmentation of the information systems in geothermal science. Our approach formulates a new strategy to bring together segmented and national (INSPIRE-based) realities into a common framework.
The paper is organized as follows. Section 2 reports the requirements of information systems for geothermal science and defines the e-Infrastructure facilities. Section 3 describes how a geothermal science network can be supported using e-Infrastructure facilities. Section 4 reports the EGIP platform as a case study to demonstrate the application of our idea. Section 5 provides the conclusions.
2. Overview
Many geothermal databases (GDBs) are currently developed either on national (local, regional and national GDB) or on international scales, for example, the GDBs developed in projects such as GEOELEC (Dumas and Angelino Citation2013a), GEODH (Dumas and Angelino Citation2013b), TransEnergy (Nádor et al. Citation2013) and the IGA GDB on energy production (International Geothermal Association Citation2015; Trumpy et al. Citation2015). These mostly manage underground data and resource features (e.g. well data, heat flow, geophysical and geochemical data) or exploitation parameters (e.g. installed capacity, produced energy) (Khan, Rasul, and Khan Citation2004).
However, exploiting and managing geothermal energy entail not only knowing the underground conditions and technologies, but also understanding (i) regulatory, economic and social (including environmental) aspects, (ii) research roadmaps and training, (iii) the energy demand and market requirements. Current data and information systems depict a complex picture, in which information is heterogeneous and poorly connected. Data are often available online, but spread over different databases, platforms or web pages. Thus, they do not constitute a complete and coherent set of information.
International organizations are already promoting standardization processes for geospatial data to manage this heterogeneity of information. For example, the International Organization for Standardization (active since 1947, ISO Citation2015) and the European Committee for Standardization (operative since 2013, CEN Citation2015) promote technical specifications of standards to describe several kinds of products, materials, services and processes. Furthermore, the Open Geospatial Consortium (OGC) and the INSPIRE directive (Citation2007) support the harmonization and distribution of spatial information as well as the sharing of data and services across Europe.
E-Infrastructures can be used to improve this scenario. E-Infrastructures enable researchers in different locations across the world to collaborate in the context of their home institutions or in national or multinational scientific initiatives (Belief Citation2008; Zoppi, Castelli, and Simon Citation2010). Researchers can work together by having shared access to unique or distributed scientific facilities (including data, instruments, computing and communications). E-Infrastructures have been used in several European projects (e.g. the i-Marine European Project, Castelli et al. Citation2013; the D4Science-II European Project, Castelli and Michel Citation2011; the ENVRI European Project, Sorvari and Brus Citation2012) to manage data in very different domains, ranging from biological to environmental data.
E-Infrastructures can have different implementations (Chen et al. Citation2014; Fraser Citation2005; Schwartz Citation2000): a large significant subset are Data e-Infrastructures, defined as digital infrastructures that promote data sharing and consumption in a community of practice (see definition in Wikipedia Citation2015). Data e-Infrastructures managing geospatial data usually distribute pre-processed data sets containing environmental information (e.g. the World Ocean Atlas, Locarnini et al. Citation2006). In some cases, data are automatically produced after user's selection of a geographical range and of environmental features (e.g. MyOcean, Blanc Citation2008). In these cases, the data providers contributing to these e-Infrastructures require information to be compliant with representation standards (e.g. NetCDF-CF, Hankin et al. Citation2010).
Computational e-Infrastructures, instead, support the processes required by a community of practices, using GRID and Cloud computing facilities (Candela et al. Citation2013). Another more recent type of e-Infrastructure is the Hybrid Data Infrastructure (Candela, Castelli, and Pagano Citation2010), that is, a Data and Computational e-Infrastructure that adopts a delivery model for data management, in which computing, storage, data and software are made available as a service. Hybrid Data e-Infrastructures have been used in the Belief (Citation2008) and the i-Marine (Citation2011) European projects and are still supported by European funding (EUDAT Citation2015). Each e-Infrastructure is very different from the other, as they focus on functionalities oriented to a particular application domain. A good overview can be found in Fraser (Citation2005) and in Schwartz (Citation2000).
E-Infrastructures usually organize data and users in Virtual Research Environments (VREs) (Carusi and Reimer Citation2010; Fraser Citation2005). These are web-based working environments, where groups of scientists have transparent and seamless access to a shared set of remote resources (data, tools and computing capabilities). VREs support collaborations across institutions, disciplines, and nations.
Equivalent initiatives have also been launched in other parts of the world. For example, the US National Geothermal Data System (Anderson et al. Citation2013; Lee et al. Citation2013) has several aspects in common with EGIP.
3. Method
In this section, we describe the technology used to build an e-Infrastructure for a prototype EGIP. We defined and set up an e-Infrastructure and adapted its visualization, access and processing tools to manage, share and reuse the EGIP data sets. The e-infrastructure revolved around a data and service catalogue based on a network of geospatial services in order to organize the information from the different EGIP contributors. Connecting an e-Infrastructure to a geothermal data and service catalogue maximizes the modularity of our solution: partners can maintain and provide their own data sets and services, while the e-Infrastructure adapts information indexing, processing and representation. Our approach is thus based on a standard and authoritative directive (INSPIRE directive Citation2007) to both represent and publish data and metadata.
The INSPIRE European Directive, promotes community best practices and, if available and relevant, authoritative standards (e.g. ISO 19100 and OGC). Furthermore, it defines the interoperability implementing rules (IR) that should be followed covering all the five major components of European Spatial Data Infrastructures: metadata, geospatial services, data and services interoperability, sharing of data and monitoring/reporting of the status of their implementation to the EU Member States, including some European Free Trade Association countries (Switzerland, Island, Norway). Some of the INSPIRE best practices are already followed in the geoscience field (e.g. GeoSciML in OneGeology, Laxton, Serrano, and Tellez-Arenas Citation2010; EarthResourceML in Minerals4EU, Cassard et al. Citation2014).
The prototype EGIP respects SEIS (as mentioned in EU Commission Citation2008) pillars: content, infrastructure and cooperation (European Environment Agency Citation2015). Data are owned, located, and updated at the producer level. Furthermore, EGIP aims at meeting also the seven SEIS principles by using e-Infrastructure facilities, even if there is still margin for enhancing its compliancy with these principles. In particular, it deals with information (i) managed as close as possible to its source (by using a federated geospatial services network), (ii) collected once and then shared (by using e-Infrastructure sharing facilities), (iii) readily available for reporting (by using native monitoring and reporting e-Infrastructure features, Andrade et al. Citation2009), (iv) easily accessible (by using a Web portal and standards for data publishing), (v) enabling comparison at the appropriate geographical scale (by using standards for data representation and processing techniques to compare heterogeneous data), (vi) fully available to the general public (by using free-access VREs), (vii) supported through common, free open software (by using Open Source and free software, Candela, Castelli, and Pagano Citation2010). The next sections clarify the details of the EGIP features addressing these topics.
3.1. Management layer: the hybrid data e-Infrastructure
In order to support the EGIP contributors, we used a Hybrid Data e-Infrastructure named D4Science (Candela, Castelli, and Pagano Citation2009). D4Science is a ‘system of systems’, that is, an e-Infrastructure that can also exploit other infrastructures, services and information systems. D4Science is used as support to communities in computational biology (Castelli et al. Citation2013), fisheries management (Castelli and Michel Citation2011), and oceanography (Sorvari and Brus Citation2012). It currently has links to other infrastructures such as the European Grid Infrastructure, the Global Biodiversity Information Facility (GBIF), the Ocean Biogeographic Information System, myOcean, the World Ocean Atlas, the FAO Data repository and the Catalogue of Life and SeaDataNet. D4Science integrates these systems to exploit their respective synergies, thus providing its community of practice with a set of novel and enhanced services. D4Science also supports the creation and operation of VREs. By means of VREs, D4Science manages security and access issues: it assigns a role to each user of the e-Infrastructure and makes different applications and functionalities available through VREs. Users’ access to a VRE is moderated by higher level/role users and each VRE grants access to a subset of resources, databases and data. Thus, the D4Science e-Infrastructure maps access policies and security regulations onto VREs access and user role mechanisms. A distributed accounting system controls users’ operations and periodically reports aggregated summaries to the managers.
D4Science has been built in the course of several European and international projects (e.g. the i-Marine European Project, i-Marine Citation2011, and the EUBrazilOpenBio project, Amaral et al. Citation2015) and some of the authors of this paper have contributed to its development. We chose this system not only because we were familiar with it (which speeded the implementation of EGIP up), but also because it covers a large spectrum of the facilities needed to deliver scientific applications as a service. D4Science is based on cutting-edge technologies and includes authoritative data (e.g. FishBase, Froese and Pauly Citation2000; SeaLifeBase, Palomares and Pauly Citation2010) and methods (Coro and Candela Citation2014) from several scientific communities, which could be reused also in the context of geothermal information. D4Science currently connects more than 1500 scientists and is used by more than 20,000 users per month (for more details, see Candela et al. Citation2014). The D4Science facilities we used to build EGIP approximately correspond to the data transfer facilities of the EUDAT (EUDAT Citation2015) e-Infrastructure (B2STAGE) and to its federated repositories (B2SAFE). A plan to collaborate with the EUDAT research data network (in the B2FIND service) and to provide EUDAT access to the EGIP data is currently under evaluation.
D4Science, in fact, ensures robust, safe and highly available distributed replication services for its owned services. On the other hand, D4Science requires providers of external services to ensure the availability of their services. In the case of the geospatial services provided by the EGIP contributors, D4Science hosts and maintains only the metadata of the EGIP geospatial information. Contributors are required to ensure that their geospatial services correctly work when invoked, possibly by replicating them. On the other hand, D4Science comes with monitoring systems, for example, Nagios (Barth Citation2008) and Ganglia (Massie, Chun, and Culler Citation2004), that periodically check the availability of the external services connected to the e-Infrastructure and alter their owners in case of issues, thus helping EGIP contributors to monitor their services.
D4Science comes with an integrated and flexible computer-assisted environment supporting key phases of reuse, that is, data acquisition, data preparation and data processing. Data acquisition and preparation are realized by means of a working environment (CNR Citation2015a) that allows managing tabular resources and code lists. This platform allows users to import, manipulate (i.e. aggregate, filter, etc.), explore (i.e. produce charts and summary statistics) and analyse their data.
In order to support EGIP, we used the following facilities:
Geospatial services: to connect to a distributed data and service catalogue
A web portal (D4Science for EGIP, egip.d4science.org) that acts as a unique information access point for applications and data catalogues
Computational capabilities: to process data and create aggregated representations of the energetic scenarios of the contributing countries
Visualization tools: to allow users access to data sets, GIS layers and processing results
Social network facilities: to allow users to share results and data sets with other colleagues
D4Science was not modified for the purpose of building EGIP because it is based on standards to make web services communicate between them and to extract information from geospatial data sets. A set of processing algorithms to produce charts and statistics were the only further implementation we added to support EGIP. For this activity, we used the D4Science process integration and development platform described in Coro and Italiano (Citation2012) and in Coro et al. (Citation2013). This platform allows for fast development and integration of new processes. It comes with connectors to the e-Infrastructure that allow discovering, accessing and extracting information from geospatial data sets. These connectors reduce issues due to managing heterogeneous descriptions and formats of geospatial data sets. Our EGIP processes were implemented with the Java programming language and ported on D4Science using the integration strategies described in Coro et al. (Citation2014b). The implementation relies on the D4Science geospatial connectors, thus we did not find particular issues.
3.1.1. Geospatial data representation and indexing
Metadata preparation is fundamental for data organization, and entails describing and cataloguing the information collected. Metadata operations involve different kinds of data, for example, documents, services, software and data sets. For the EGIP purposes, we created geospatial metadata compliant with the authoritative INSPIRE Metadata Implementing rules, which are based on the EN ISO 19115 and EN ISO 19119 standards (ISO Citation2005, Citation2014). We used the INSPIRE format to register data sets and services in a geospatial catalogue, whereas we adopted the Dublin core format (DCMI Citation2015) to describe textual documents.
We used the D4Science services to make the data and service catalogue available to EGIP users. depicts the conceptual architecture of our solution. D4Science offers a service for discovering and accessing distributed environmental data and maps based on several geospatial services instances, which rely on OGC standard and protocols such as the Web Map Service (De la Beaujardiere Citation2002), the Web Coverage Service (Evans Citation2003), and the Web Feature Service (Vretanos Citation2005). This discovery service balances user requests on the several geospatial services. This service is a GeoNetwork instance (GeoNetwork Opensource Citation2015) and stores and indexes the EGIP metadata according to their content, indicating which geospatial service hosts them. GeoNetwork provides a search engine for metadata based on the OGC CSW protocol. At the D4Science level, a set of PostGIS databases stores values and geometries, while the geospatial services publish them according to the aforementioned OGC standards using several geospatial services (based on GeoServer (Deoliveira Citation2008) and Mapserver (Brent Hall and Leahy Citation2008).
Figure 1. Conceptual schema of the EGIP platform.
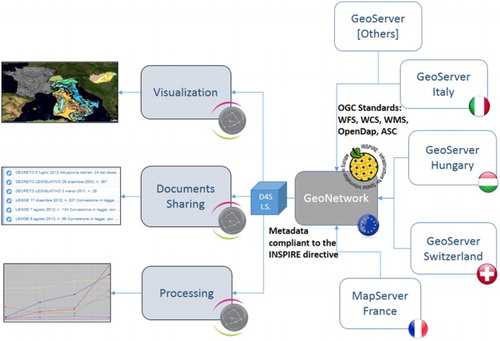
As a result, D4Science collects information from distributed information sources, consolidates this information and makes it available for further reuse either via user interfaces or standard OGC web services (CSW, WMS, WFS, WCS).
3.1.2. Visualization
The GeoExplorer portlet (CNR Citation2015b), displayed in , is one of the visualization facilities offered by D4Science. It is a web application through which users can discover and interact with spatial layers and other data that are indexed by D4science. It interacts with the infrastructure metadata catalogue (GeoNetwork) in order to explore the spatial information available. In order to get the list of layers and to search for a layer name, GeoExplorer sends CSW calls to GeoNetwork. When a user selects a layer, the corresponding Geoserver hosting the layer is invoked via WMS and is visualized. The information about this Geoserver is included in the GeoNetwork metadata sent via CSW. When the user clicks on a specific location, GeoExplorer uses WFS to extract features (i.e. attached information) for that location and then it visualizes them as a table.
Figure 2. The GeoExplorer portlet for accessing EGIP data.
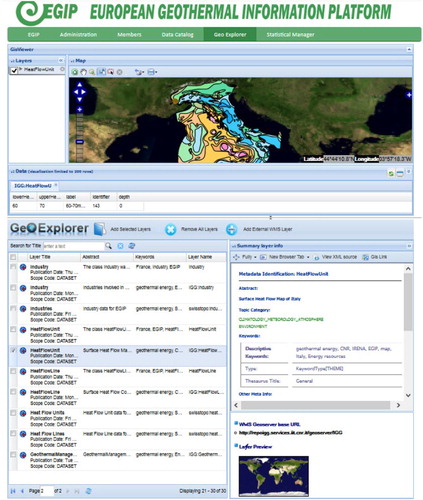
Overall, the GeoExplorer portlet provides the following facilities: layer exploration (preview, sorting, filtering, multi-selection); visual correlation analysis of several overlying layers; CQL visual filters of one or more layers; tabular spatial data retrieval of one or more layers; transect chart production; a rich set of base layers; and visualization of external WMS layers.
Visualization is only supported for geospatially explicit data, while documents only have metadata reported. The upper part of the interface displays maps, while the upper left part enables superposition order and transparencies of layers to be changed. The toolbar at the top of the map allows panning, zooming, and extracting information from the map. The panel in the middle reports the extracted information. The lower panels contain a list of data sets, which can be filtered using the search box. The lower right panel reports a user-friendly visualization of the metadata and if desired a thumbnail map. The interface also enables the source XML of the metadata descriptions to be retrieved.
3.1.3. Processing
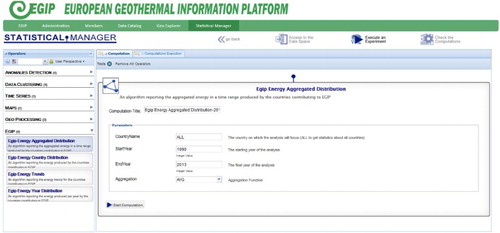
D4Science offers a dynamic web interface for data processing (). The interface is dynamically generated from the description of the algorithms residing in the e-Infrastructure services. The interface allows users to select the algorithms, execute them, and monitor their execution via a plain web browser. The interface interacts with the e-Infrastructure services and retrieves the descriptions and the parameters of the processes. It is also able to summarize the output of a computation when it has finished. shows the interface used to invoke an algorithm in EGIP. The list of capabilities grouped according to a user-oriented perspective is shown on the left-hand side. In the right-hand panel, the web interface automatically generates the required fields from the inputs of the algorithm and displays them with the proper format. The StartComputation button starts the execution.
Figure 3. The D4Science interface for data processing.
The processing facilities are made up of two parts: a periodic automatic process analyses the catalogue of geothermal data sets and produces a summary table. In addition, a set of processes generate trends after aggregating the information in the summary table. Our processes use OGC communication standards for geospatial data access and retrieval (e.g. WFS, WCS and OpenDAP). This allows EGIP contributors to update data sets or connect new ones to the e-Infrastructure easily: since our algorithms rely on OGC standards, it is straightforward to apply them to new data sets using the same standards. The interface uses the D4Science Cloud computing facilities to execute and distribute calculations. These allow processing large data sets and managing multi-user requests. Furthermore, they store the experiments history and allow their reproducibility. The processes use D4Science-provided Java libraries to manage heterogeneous formats and standards of infrastructure data. We leave further details about this service to Coro et al. (Citation2014b) and to Candela et al. (Citation2013).
3.1.4. Sharing
The aim of the D4Science networking facilities (Assante et al. Citation2014) is to enhance collaboration between users. The EGIP e-Infrastructure hosts a VRE that has five key social networking tools: (i) a continuously updated list of events/news produced by users and applications ((a)); (ii) a file system-like online area (Workspace, (b)) for uploading and sharing of files, data sets and folders; (iii) a messaging facility for participants in the same VRE, (iv) a user profile interface, which can be connected to widely used social networks (e.g. Facebook and Twitter), and (v) a computational space for each user, containing the history of the computations that have been executed, along with the input parameters and the output.
Figure 4. D4Science social networking facilities: (a) the list of user events and news, (b) file-system storage and sharing area (Workspace).
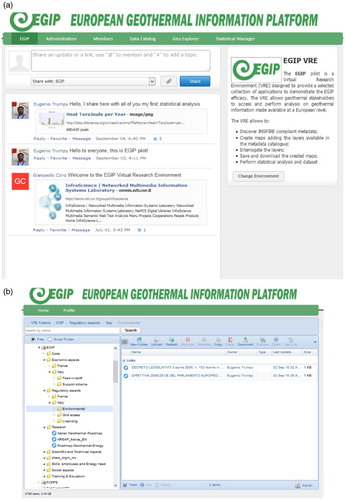
The Workspace is one of the principal functionalities of D4Science, where users can exchange data sets or organize documents. Behind the scenes, it uses a distributed storage system and supports standard files storage as well as D4Science representations of tabular data, processing workflows and GIS maps. These storage facilities are meant to guarantee high availability and backup of the stored data sets. The Workspace allows files to be associated with direct http links and to be shared with scientists external to the e-Infrastructure. In the case of proprietary representations (e.g. GIS layers), the http link takes the external user to a D4Science visualization interface.
Sharing the results and the parameters of experiments supports replicability and repeatability. Once an EGIP process has been run, the user can share the resulting images with other colleagues via the Workspace, or the parameters via the messaging system. The D4Science networking facilities thus enable fast knowledge brokerage, from the producer to the user. Fastening knowledge brokerage, and at the same time providing efficient computational capabilities, data representation and access, is the main added value of using an e-Infrastructure to support a community of practice in geothermal science.
4. Use case
The prototype e-Infrastructure for a EGIP falls within the framework of the Geothermal ERA-NET project (Geothermal ERA-NET Citation2015; Johannesson et al. Citation2015), and was created thanks to a joint activity by a part of the project consortium. Its main aim is to show the benefits of this platform to scientific, political and industrial stakeholders. EGIP is designed as a distributed system: each (national) data contributor delivers its data according to a common standard data model and to common descriptions. Furthermore, it tries to cover the major components of European Spatial Data Infrastructure, because it relies on OGC standards for metadata and data consumptions and by means of these, its services guarantee interoperability and sharing of data even outside of the e-Infrastructure. The D4Science infrastructure monitoring, accounting and reporting facilities (Andrade et al. Citation2009) provide updated and periodic summary of services and data usage. Thus, EGIP tries to meet the INSPIRE directive recommendations and OGC standards, ensuring coordinated efforts at a minimum cost. The INSPIRE EU directive (INSPIRE directive Citation2007) requires European countries to make their geospatial data and services compliant to its recommendations before 2020 (INSPIRE Implementation Roadmap Citation2015). At a national level, each data contributor shares data and documents (managed by its own information system) within the EGIP e-infrastructure according to well-established policy agreements and in compliance with INSPIRE principles.
The EGIP e-infrastructure exploits the metadata stored in the catalogue in order to offer access and processing services. The result is an overall European project, made up of national contributions. Current EGIP contributors come from Italy (Institute of Geosciences and Earth Resources of the National Research Council, IGG-CNR), Hungary (Magyar Földtani és Geofizikai Intézet, MFGI), Switzerland (Swiss Federal Office of Topography, Swisstopo), France (Bureau de Recherches Géologiques et Minières, BRGM), and Iceland (National Energy Authority of Iceland, Orkustofnun). New partners are welcome, both coming from the Geothermal ERA-NET consortium and from outside. In order to join, partners have to follow the instructions available on the ‘Join EGIP pilot’ page of the EGIP pilot website (Geothermal ERA-NET Citation2014). This page allows downloading of three help files that give guidance in data preparation and provisioning according to the EGIP requirements.
The following section examines the content of EGIP and the processes applied to the contributors’ data.
4.1. The EGIP data collection
Textual documents in EGIP are registered in the metadata catalogues using the Dublin Core metadata specification. Data sets are described along with the specific attributes that identify their content type and country of origin. In more general terms, the attributes attached to the EGIP data enable the information provided by different countries to be compared. reports the list of the information collected in EGIP. It is the result of a collaboration process between the contributing countries. In order to create these data sets, we started from the assumption that each data provider already owned a national geothermal data repository (typically a database). One example of a national database is the Italian geothermal database, described in Barbier, Bellani, and Musmeci (Citation2000) and in ENEL et al. (Citation1988), which can be consulted online (IGG-CNR Citation2012). The idea was to map the structure of the several national databases onto a common standard data model based on the INSPIRE indications. The result of this process was a set of UML diagrams reporting the INSPIRE objects (and their relations) that corresponded to the concepts we wanted to model. Thus, INSPIRE classes were reused to describe the corresponding concepts of our model. When it was not possible to reuse the INSPIRE classes, we defined classes that were in accordance with the INSPIRE data specifications. The classes belonged either to the INSPIRE general concept model (INSPIRE Citation2007, Citation2013a) or to the INSPIRE Energy Resources data theme (INSPIRE Citation2013b). We delegate the details of these diagrams to the technical document in EGIP (Citation2014) and to the Appendix 2 of the Geothermal ERA-NET (Citation2013) feasibility study. For concepts mapping, each contributor reinterpreted its national data descriptions according to the common model. For example, a ‘lower values’ column in a ‘temperature’ table was mapped onto the TemperatureUnit class of the reference data model. Furthermore, each national dictionary was mapped by the contributors onto the INSPIRE code lists (INSPIRE Citation2007, Citation2013a, Citation2013b) as far as possible.
Table 1. The list of data in our prototype e-Infrastructure for EGIP.
4.1.1. Temperature maps
Temperature maps show the temperature value at a certain depth below the ground or at a certain sea level. This is the most common type of information used in Europe. Usually, temperature values are represented as isolines or polygons, and occasionally as raster data sets.
In the case of vectorial maps, the EGIP model requires the following attributes to be specified: (i) a unique ID and a label for each geometry, (ii) an upper and lower temperature limit in each geometry/location (in °C), and (iii) a label that indicates the visualization GIS style of the map.
If the vectorial data are polylines (e.g. for isolines), the contributor should also specify the isolines temperature value and whether the line has been inferred or is the result of real measures.
4.1.2. Surface heat flow
Since the 1980s, heat flow maps have been released and periodically updated in the European Geothermal Resource Atlas. Heat flows are generally represented at the surface level, either as polylines/polygons or as raster data. As with temperature maps, vectorial maps have IDs and labels attached to the geometries, and the values refer to lower and upper heat flow limits (expressed in mW/m2). In addition, the contributor should specify the heat flow value in a certain point and whether or not that value was inferred.
4.1.3. Licencing
Information on licencing is collected by ministries, energy agencies or local authorities. It generally consists of collections of reports, maps, underground surveys, well logs and analyses, and so on. Boundaries for licensing areas are represented as either polylines or polygons, and highlight the limits of the effects of the licence.
The EGIP contributors attach the following attributes to the geometries: (i) a unique ID for each area; (ii) the type of licence according to a predefined vocabulary; (iii) a licence name; (iv) a position label (on-shore/off-shore); (v) the area in m2 (only for polygonal maps); (vi) the perimeter; (vii) the licence start and expiry dates; (viii) at least one public http link to a licence document.
4.1.4. Training centres
This data set lists universities and research centres that deal with geothermal courses and activities in the contributing country.
The data set is in a table format and includes, for each centre: (i) a unique ID, (ii) its type (i.e. university or research centre), (iii) the name, (iv) the location (possibly geospatially explicit) and (v) a link to a website.
4.1.5. Industry
This data set contains the catalogue of industries involved in geothermal activities, that is, all the companies that produce components for power production and for a direct use of heat. The data set is a country-specific table containing, for each industry: (i) a unique ID for each industry, (ii) the type of industry (chosen from a pre-defined vocabulary), (iii) the name, (iv) the location (possibly with geographical coordinates), (v) a link to a website.
4.2. Data organization and visualization
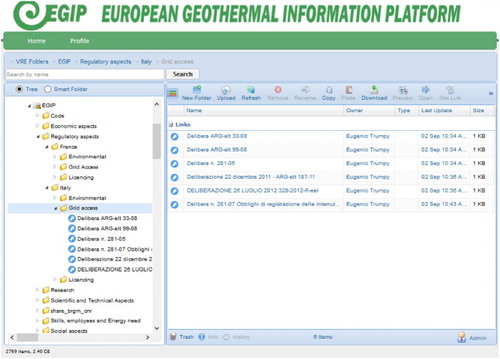
We used the D4Science Workspace to organize information collected from the providers and organized by thematic categories. The Workspace enables http links to the documents to be produced as well as links to their metadata stored in the GeoNetwork catalogue. We prepared the following subdirectories under the root directory (EGIP) provided by the VRE: Economic, Regulatory aspects, Research, Training and Education. In each directory, the documents are divided by country ().
Figure 5. Organization of the D4Science Workspace in EGIP.
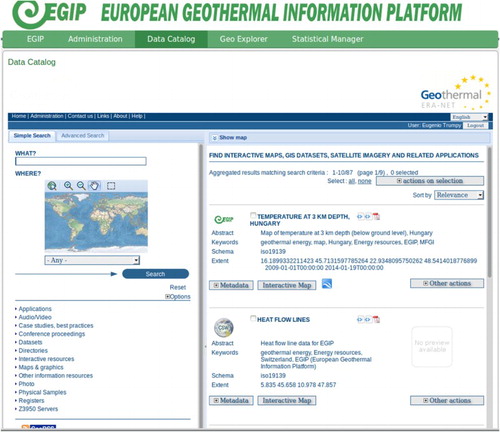
Each contributor is asked to provide data and metadata via geospatial services (e.g. OGC CSW, WMS, WFS, CSW). The D4Science was then configured to access and index them. The D4Science web portal for EGIP enables metadata to be searched directly through the GeoNetwork interface or to visualize information via the GeoExplorer ().
Figure 6. The EGIP metadata catalogue based on the GeoNetwork web interface, accessed through the D4Science web portal for EGIP.
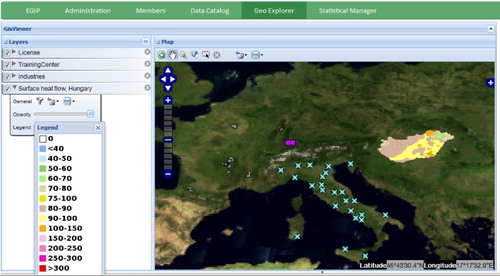
shows an example of the visualization of EGIP data on GeoExplorer. The map displays the location of licences in France, training centres in Italy, industries in Switzerland and heat flow in Hungary.
Figure 7. The D4Science GeoExplorer used to visualize heterogeneous data in the EGIP data catalogue.
4.2.1. Summary-table producer
Within the VRE, we developed a processing service that produces a summary of the information provided by the contributors. This process runs for a period of three hours. It scans the consolidated catalogue at the EGIP central node level (GeoNetwork), using the CSW protocol, and assembles a table containing the most important information on the geothermal energy produced by a country, considering the direct use of the heat and power production.
We refer to this table as the summary table and it contains one row for each country. For each row, a number of columns contain indications aggregated at a five-year resolution. This includes the following information for each country: (i) the available thermal power (in thermal megawatts, MWth), (ii) the heat produced (in tera-joules per year, TJ/y), (iii) the electric power available (in electrical megawatts. MWe).
The summary table contains three columns referring to five years of production. Missing information is reported as empty values. This enables the information from all the countries to be automatically aligned and prevents further alignment in the subsequent steps. An example of output is shown in . Our process produces a layer on a GeoServer, which is indexed on the D4Science GeoNetwork. The result can be visualized using GeoExplorer ().
Figure 8. Visualization of the summary table in GeoExplorer, with details on values for Italy.
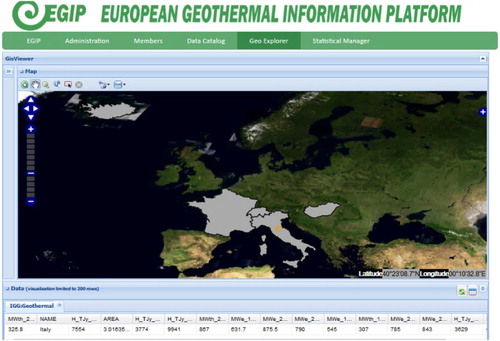
Table 2. Summary table periodically produced by aggregating information on the D4Science GeoNetwork.
4.2.2. Data processing
The EGIP data processing session uses the Cloud computing facilities provided by the D4Science e-Infrastructure. These include general-purpose data mining algorithms, to which we added specific processes for EGIP. The objective of these custom processes is to produce an aggregated visualization of the energy trends and the information provided by the contributors.
The general-purpose algorithms hosted by D4Science include advanced signal processing and data mining techniques (Coro and Candela 2014). These include, for example, algorithms to (i) detect periodicities in a time series (e.g. Singular Spectrum Analysis, Hossein Citation2007), (ii) to classify and cluster data (e.g. Artificial Neural Networks, Bebis and Georgiopoulos Citation1994; X-Means, Pelleg and Moore Citation2000; DBScan, Ester et al. Citation1996) and (iii) to compare GIS maps (Coro, Pagano, and Ellenbroek Citation2014a).
Apart from these algorithms, we developed four processes that use the information in the summary table. These algorithms retrieve information using the WFS standard directly from the GeoServer hosting the summary table. The WFS URL of the summary table is retrieved from the GeoNetwork. The output of these algorithms can be used as input to the advanced processing algorithms hosted by D4Science to further analyse the data, for example, to detect periodicities in the energy trends and to classify different kinds of energy usage/production profiles.
Below, we detail the implemented processes. The social networking features of D4Science enable the figures produced and the parameters of these processes to be exchanged with other participants in the e-Infrastructure.
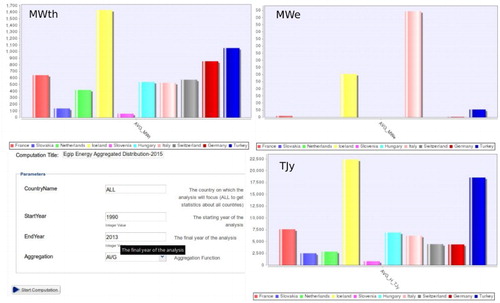
Energy aggregated distribution: an algorithm reporting either the average (AVG) or the overall (SUM) energy available and produced by the EGIP contributors, in a certain year range. Energy is reported for electric MegaWatts, thermal MegaWatts and tera-joules produced per year. The inputs of the procedure are: the name of the specific country to focus on (or all the countries), the range of years the process will focus on, the aggregation function to use on the quantities (either sum or average). The output is made up of (i) three histograms for AVG, reporting the aggregated quantities for each country, and (ii) one histogram for SUM (). The SUM aggregation function is only applied to the produced tera-joules per year.
Figure 9. Example of the configuration of the energy aggregated distribution algorithm, with corresponding output. A simulated summary table is reported because of privacy issues.
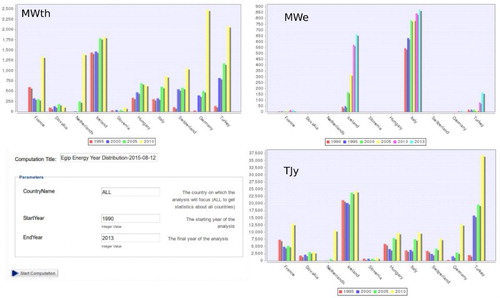
Energy 5-year distribution: an algorithm reporting the energy available and produced by the EGIP contributors, with details on each five-year period. The input is the same as for the Energy Aggregated Distribution algorithm. The output reports a histogram for each energy production type. Each chart contains several sub-histograms focusing on the countries, where each column represents the quantity in one year ().
Figure 10. Example of configuration of the energy 5-year distribution algorithm, with corresponding output using a simulated summary table.
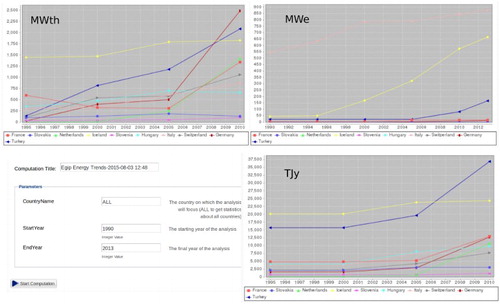
Energy trends: an algorithm reporting the aggregated energy trends of the EGIP contributors. The difference from the previous algorithms is that this reports three charts, each displaying the trend of one type of energy production for each country ().
Figure 11. Example of configuration of the energy trends algorithm, with corresponding output using a simulated summary table.
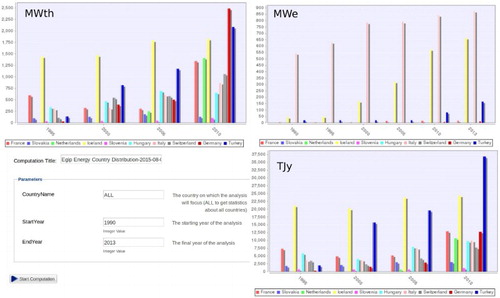
Energy per country distribution: an algorithm reporting the aggregated energy, focusing on the countries. The output reports a histogram for each type of energy supply. Each histogram reports a sub-histogram for each year, with one column for each country ().
Figure 12. Example of configuration of the energy per country distribution algorithm, with corresponding output using a simulated summary table.
5. Conclusions
We have defined and set up an e-Infrastructure to build a prototype for a European Geothermal Information Network and highlighted the benefits for the contributing countries. The e-Infrastructure (i) favours the harmonization of geothermal information at a European level; (ii) guarantees data interoperability (information retrieval, visualization and access); (iii) enhances information access and retrieval; (iv) preserves the ownership of the data, that is, each country remains as the owner of its data, maintains them and decides on the publication policies; and (v) adds modularity and flexibility, that is, it is easy for a new country to participate.
The aim of EGIP is to increase communication between international geothermal energy users. It gives national and supranational decision-makers, stakeholders, companies, and scientists a way to access geothermal information at a European scale. This exchange is expected to reduce information fragmentation, enhance data provisioning, promote the harmonization of the European geothermal sector and reduce economic risks in geothermal projects. The data produced by EGIP can be further refined and processed by other e-Infrastructures to create synergies across different domains. For example, these data could be used by ecological models (Armstead Citation1978; Patterson Citation2002) or could be used even to discover species habitat preferences (Coro et al. Citation2015).
From a technical point of view, EGIP can be extended with new features and can incorporate other data than the ones we have shown. The platform could benefit also from other methods and data already hosted by D4Science or possibly coming from other e-Infrastructures. The functionalities we have shown give insights into the potential of our proposal. On the other hand, we want to underline that our platform has been realized, thanks to the diligence and the contribution of institutions that wished to build up a network of geothermal information. This is not always the case, because making the concepts of e-Infrastructures, data sharing and information exchange accepted in a new domain is normally difficult. The main difficulty is to make scientists appreciate the new tools and processes they can ‘reach’ and how these can change their usual approaches. We consider these aspects the most difficult challenges we have to face in promoting our approach, although we consider EGIP a step forward to address this challenge. EGIP also aims to increase awareness on geothermal energy, by providing an overview of its applications at a European scale. A major expected consequence is the increase in investment in the geothermal energy sector.
Acknowledgements
The present work was performed within the framework of the Geothermal ERA-NET Project, funded by the European Union's Seventh Programme for research, technological development and demonstration under grant agreement No. 291866. The authors would like to acknowledge the management and supervisory board of the Geothermal ERA-NET Project, and in particular, Guðni Jóhannesson, Hjalti Pall Ingolfsson and Thorvaldur Bragason of Orkustofnun (Iceland), Paul Ramsak of Rijksdienst voor Ondernemend Nederland, Stephan Schreiber of Julich (Germany), Paul Kaajk and Martino Lacirignola of Ademe (France), Marion Alcanié, Jean-Jacque Serrano of BRGM (France), Nils Oesterling of Federal Office of Topography Swisstopo (Switzerland), Lazlo Sores of MGFI (Hungary), Kaan Karaoz of Tubitak (Turkey), Andrej Lapanje of GeoZS (Slovenia) and Lubos Slovak of Ministry of Education, Science, Research and Sport (Slovak Republic). The authors would also like to thank Massimiliano Assante (ISTI-CNR) and Francesco Mangiacrapa (ISTI-CNR) for their technical support.
Disclosure statement
No potential conflict of interest was reported by the authors.
ORCID
Eugenio Trumpy http://orcid.org/0000-0002-4823-0417
References
- Amaral, R., R. M. Badia, I. Blanquer, R. Braga-Neto, L. Candela, D. Castelli, D. Flann, et al. 2015. “Supporting Biodiversity Studies with the EUBrazilOpenBio Hybrid Data Infrastructure.” Concurrency and Computation: Practice and Experience 27 (2): 376–394. doi:10.1002/cpe.3238.
- Anderson, A., D. Blackwell, C. Chickering, T. Boyd, R. Horne, M. MacKenzie, J. Moore, D. Nickull, S. Richard, and L. A. Shevenell. 2013. “National Geothermal Data System (NGDS) Geothermal Data: Community requirements and Information Engineering.” https://www.geothermal-library.org/index.php?mode=pubs&action=view&record=1030619.
- Andrade, P., L. Candela, D. Castelli, A. Manzi, and P. Pagano. 2009. “The D4Science Production Infrastructure.” Technical Report 2009-TR-054, Istituto di Scienza e Tecnologie dell'Informazione “A. Faedo”, CNR.
- Armstead, H. C. 1978. Geothermal Energy. Somerset, NJ: John Wiley & Sons.
- Assante, M., L. Candela, D. Castelli, F. Mangiacrapa, and P. Pagano. 2014. “A Social Networking Research Environment for Scientific Data Sharing: The D4Science Offering.” The Grey Journal 10 (2): 65–71.
- Barbier, E., S. Bellani, and F. Musmeci. 2000. “The Italian Geothermal Database.” Proceedings of the World Geothermal Congress, Kyushu-Tohoku, Japan, 28 May–10 June.
- Barth, W. 2008. Nagios: System and Network Monitoring. San Francisco, CA: No Starch Press.
- Bebis, G., and M. Georgiopoulos. 1994. “Feed-forward Neural Networks.” IEEE Potentials 13 (4): 27–31. doi: 10.1109/45.329294
- Belief. 2008. “The Belief European Project.” http://www.beliefproject.org/.
- Blanc, F. 2008. “MyOcean Information System.” Proceedings of EuroGOOS 2008, Exeter: Sandy Park, May 20–22.
- Brent Hall, G., and M. G. Leahy. 2008. “Mapserver.” Chap. 4. In Open Source Approach in Spatial Data Handling. Berlin: Springer. doi:10.1007/978-3-540-74831-1.
- Candela, L., D. Castelli, G. Coro, P. Pagano, and F. Sinibaldi. 2013. “Species Distribution Modeling in the Cloud.” Concurrency and Computation: Practice and Experience. doi:10.1002/cpe.3030.
- Candela, L., D. Castelli, A. Manzi, and P. Pagano. 2014. “Realising Virtual Research Environments by Hybrid Data Infrastructures: the D4Science Experience.” Proceedings of the International Symposium on Grids and Clouds (ISGC), Taipei, Taiwan: Academia Sinica, March 23–28.
- Candela, L., D. Castelli, and P. Pagano. 2009. “D4Science: An e-Infrastructure for Supporting Virtual Research Environments.” Proceedings of IRCDL 2009, Padova, Italy, January 29–30.
- Candela, L., D. Castelli, and P. Pagano. 2010. “Making Virtual Research Environments in the Cloud a Reality: The gCube Approach.” ERCIM News 83: 32–33.
- Carusi, A., and T. Reimer. 2010. Virtual Research Environment Collaborative Landscape. JISC Bristol.
- Cassard, D., F. Tertre, G. Bertrand, A. Tellez-Arenas, F. Schjøth, J. Tulstrup, T. Heijboer, J. Vuollo, D. Cápová, J. Šinigoj, S. Gruijters, R. Tomas, and C. Schubert. 2014. “The Minerals4EU Knowledge Data Platform for Managing Web-based Mineral Resources Information in Europe.” Proceedings of Minerals in Circular Economy Conference (MINCE), Espoo, Finland, November 26–27.
- Castelli, D., and J. Michel. 2011. “D4SCIENCE-II – Data Infrastructures Ecosystem for Science. Project final report. Data Infrastructures Ecosystem for Science.” Deliverable DNA1.7.
- Castelli, D., M. Taconet, S. Garavelli, and S. Parker. 2013. “iMarine Infrastructure for Data Driven Decision Making and Research: Position Paper.” Presentation at the Workshop on iMarine e-infrastructure for data-driven decision making and research, Brussels, Belgium, May 14–15.
- CEN. 2015. “The European Committee for Standardization.” www.cen.eu.
- Chen, Y., A. Hardisty, A. Preece, P. Martin, M. Atkinson, Z. Zhao, B. Magagna, H. Schentz, and Y. Legre. 2014. “Analysis of Common Requirements for Environmental Science Research Infrastructures.” Proceeding of Science (PoS) SISSA, the International School for Advanced Studies of Trieste. http://pos.sissa.it/archive/conferences/179/032/ISGC%202013_032.pdf.
- CNR. 2015a. “The Tabular Data Manager Software.” http://gcube.wiki.gcube-system.org/gcube/index.php/Tabular_Data_Manager.
- CNR. 2015b. “The GeoExplorer Software.” http://gcube.wiki.gcube-system.org/gcube/index.php/GeoExplorer.
- Coro, G., and L. Candela. 2014. “gCube Statistical Manager: The Algorithms.” Istituto di Scienza e Tecnologie dell'Informazione “A. Faedo” CNR Technical Report n. 2014-TR-027.
- Coro, G., L. Candela, P. Pagano, A. Italiano, and L. Liccardo. 2014b. “Parallelizing the Execution of Native Data Mining Algorithms for Computational Biology.” Concurrency and Computation: Practice and Experience. doi:10.1002/cpe.3435.
- Coro, G., A. Gioia, P. Pagano, and L. Candela. 2013. “A Service for Statistical Analysis of Marine Data in a Distributed e-Infrastructure.” Bollettino di Geofisica Teorica e Applicata 54: 68–70.
- Coro, G., and A. Italiano. 2012. Statistical Manager Developer's Guide. http://gcube.wiki.gcube-system.org/gcube/index.php/How-to_Implement_Algorithms_for_the_Statistical_Manager.
- Coro, G., C. Magliozzi, A. Ellenbroek, and P. Pagano. 2015. “Improving Data Quality to Build a Robust Distribution Model for Architeuthis Dux.” Ecological Modelling 305: 29–39. doi: 10.1016/j.ecolmodel.2015.03.011
- Coro, G., P. Pagano, and A. Ellenbroek. 2014a. “Comparing Heterogeneous Distribution Maps for Marine Species.” GIScience & Remote Sensing 51 (5): 593–611. doi: 10.1080/15481603.2014.959391
- DCMI. 2015. “Dublin Core specifications.” http://dublincore.org/.
- De la Beaujardiere, J. 2002. “Web Map Service Implementation Specification.” Open Geospatial Consortium. http://portal.opengeospatial.org/files/index.php.
- Deoliveira, J. 2008. “GeoServer: Uniting the GeoWeb and Spatial Data Infrastructures.” Proceedings of the 10th International Conference for Spatial Data Infrastructure. Trinidad: St. Augustine, February 25–29.
- Dumas, P., and L. Angelino. 2013a. “GEOELEC Project: Develop Geothermal Electricity in Europe to have a Renewable Energy Mix.” Proceedings of the European Geothermal Congress, Pisa, June 3–6.
- Dumas, P., and L. Angelino. 2013b. “GEODH Project: Promote Geothermal District Heating System in Europe.” Proceedings of the European Geothermal Congress, Pisa, June 3–6.
- EGIP. 2014. “The EGIP Data Model.” http://egip.igg.cnr.it/images/download/EGIP_Pilot_data_model_1.0.pdf.
- ENEL, ENI-AGIP, CNR and ENEA. 1988. “Inventario delle Risorse Geotermiche Nazionali – Indagine D'insieme Sul Territorio Nazionale [Inventory of the Italian national geothermal resources. Global survey of the national territory].” Ministero dell'Industria, del Commercio e dell'Artigianato. [Ministry of Industry, Commerce and Handicrafts], Rome, 75 pp. + enclosures.
- Ester, M., H. P. Kriegel, J. Sander, and X. Xu. 1996. “A Density-based Algorithm for Discovering Clusters in Large Spatial Databases with Noise.” Kdd 96: 226–231.
- EU Commission. 2008. “Towards a Shared Environmental Information System (SEIS).” http://eur-lex.europa.eu/LexUriServ/LexUriServ.do?uri=COM:2008:0046:FIN:EN:PDF.
- EU Commission. 2010. “COMMISSION REGULATION (EU) No 1253/2013 of 21 October 2013 Amending Regulation (EU) No 1089/2010 Implementing Directive 2007/2/EC as Regards Interoperability of Spatial Data Sets and Services.” http://inspire.ec.europa.eu/index.cfm/pageid/241/documentid/3311.
- EUDAT. 2015. “The EUDAT web site.” http://eudat.eu/.
- European Environment Agency. 2015. “Shared Environmental Information System.” http://www.eea.europa.eu/about-us/what/shared-environmental-information-system-1.
- Evans, J. D. 2003. “Web Coverage Service (WCS), version 1.0.0.” Open Geospatial Consortium. http://www.opengeospatial.org/standards/wcs.
- Fraser, M. 2005. “Virtual Research Environments: Overview and Activity.” On the Ariadne website. http://www.ariadne.ac.uk/issue44/fraser.
- Froese, R., and D. Pauly. 2000. “FishBase: A Global Information System on Fishes.” FishBase, Los Baños, Philippines.
- GeoNetwork Opensource. 2015. “The GeoNetwork Software.” http://geonetwork-opensource.org.
- Geothermal ERA-NET. 2013. “Feasibility Study for a European Geothermal Information Platform, Deliverable D3.2.” http://www.geothermaleranet.is/media/frettir/Geothermal-ERA-NET-D-3-2-final-v02.pdf.
- Geothermal ERA-NET. 2014. The EGIP Pilot Web Site. http://egip.igg.cnr.it.
- Geothermal ERA-NET. 2015. “The Geothermal ERA-NET Project Web Site.” http://www.geothermaleranet.is/.
- Gore, A. 1999. “The Digital Earth: Understanding our Planet in the 21st Century.” Photogrammetric Engineering and Remote Sensing 65 (5): 528–530.
- Grossner, K., M. F. Goodchild, and K. Clarke. 2008. “Defining a Digital Earth System.” Transactions in GIS 12 (1): 145–160. Chichester, West Sussex: Wiley. doi: 10.1111/j.1467-9671.2008.01090.x
- Hankin, S. C., J. D. Blower, T. Carval, K. S. Casey, C. Donlon, O. Lauret, T. Loubrieu. 2010. “NetCDF-CF-OPeNDAP: Standards for Ocean Data Interoperability and Object Lessons for Community Data Standards Processes.” Proceedings of Oceanobs 2009, Venice, Italy, September 21–25.
- Hossein, H. 2007. “Singular Spectrum Analysis: Methodology and Comparison.” Journal of Data Science 5 (2): 239–257.
- IGG-CNR. 2012. “The Geothopica Web Application Based on the Italian National Geothermal Database.” Accessed May 2015. http://geothopica.igg.cnr.it/.
- i-Marine. 2011. “The i-Marine European Project.” http://www.i-marine.eu.
- INSPIRE. 2007. “Metadata Implementing Rules: Technical Guidelines Based on EN ISO 19115 and EN ISO 19119.” http://inspire.ec.europa.eu/documents/Metadata/INSPIRE_MD_IR_and_ISO_v1_2_20100616.pdf.
- INSPIRE. 2013a. “Data Specification on Energy Resources – Technical Guidelines.” http://inspire.ec.europa.eu/documents/Data_Specifications/INSPIRE_DataSpecification_ER_v3.0.pdf.
- INSPIRE. 2013b. “Generic Conceptual Model.” http://inspire.ec.europa.eu/documents/Data_Specifications/D2.5_v3.4rc3_vs_3.4rc2.pdf.
- INSPIRE Directive. 2007. “2/ec of the European Parliament and of the Council of 14 March 2007 Establishing an Infrastructure for Spatial Information in the European Community (inspire).” Official Journal of European Union. 25th April.
- INSPIRE Implementation Roadmap. 2015. “The Implementation Roadmap.” http://inspire.ec.europa.eu/index.cfm/pageid/44.
- International Geothermal Association. 2015. “The International Geothermal Association Web Site.” http://www.geothermal-energy.org/.
- ISO. 2005. “ISO 19119:2005, Geographic Information – Services.” http://www.iso.org/iso/catalogue_detail.htm?csnumber=39890.
- ISO. 2014. “ISO 19115-1:2014, Geographic Information -- Metadata -- Part 1: Fundamentals.” http://www.iso.org/iso/iso_catalogue/catalogue_tc/catalogue_detail.htm?csnumber=53798.
- ISO. 2015. “The International Organization for Standardization.” http://www.iso.org.
- Johannesson, G., H. P. Ingolfsson, J. Ketilsson, P. Ramsak, A. Manzella, S. Schreiber, G. Siddiqi, and S. Bjornsson. 2015. “International Cooperation on Geothermal Research Through the Geothermal ERA-NET.” Proceedings of the World Geothermal Congress, Melbourne, AU, April 16–25.
- Khan, K. H., M. G. Rasul, and M. M. K. Khan. 2004. “Energy Conservation in Buildings: Cogeneration and Cogeneration Coupled with Thermal Energy Storage.” Applied Energy 77 (1): 15–34. doi: 10.1016/S0306-2619(03)00100-4
- Laxton, John, Jean-Jacques Serrano, and Agnes Tellez-Arenas. 2010. “Geological Applications Using Geospatial Standards: An Example from OneGeology-Europe and GeoSciML.” International Journal of Digital Earth 3 (S1): 31–49. doi: 10.1080/17538941003636909
- Lee, A. M., C. Chickering, K. Patten, A. Anderson, and S. M. Richard. 2013. “Sustaining the National Geothermal Data System: Considerations for a System Wide Approach and Node Maintenanc.” GRC Transactions 37: 531–538. https://www.geothermal-library.org/index.php?mode=pubs&action=view&record=1030618.
- Locarnini, R., A. V. Mishonov, J. I. Antonov, T. P. Boyer, H. E. Garcia, and S. Levitus. 2006. “The World Ocean Atlas 2005 Volume 1: Temperature [+ DVD].” Noaa atlas nesdis 61 (1). Broadway Boulder, CO: NOAA.
- Massie, M. L., B. N. Chun, and D. E. Culler. 2004. “The Ganglia Distributed Monitoring System: Design, Implementation, and Experience.” Parallel Computing 30 (7): 817–840. doi: 10.1016/j.parco.2004.04.001
- Nádor, A., A. Rotár Szalkai, J. Prestor, G. Tóth, G. Goetzl, A. Lapanje, N. Rmanet al. . 2013. “Transboundary Geothermal Energy Resources of Slovenia, Austria, Hungary and Slovakia (TRANSENERGY) – Contributions to Integrated Resource Management Policies and Regional Development Transboundary geothermal energy resources of Slovenia, Austria, Hungary and Slovakia.” Proceedings of the European Geothermal Congress, Pisa, June 3–6.
- Palomares, M. L. D., and D. Pauly. 2010. “SeaLifeBase.” World Wide Web Electronic Publication. www.sealifebase.orgversion12/2010.
- Patterson, M. G. 2002. “Ecological Production Based Pricing of Biosphere Processes.” Ecological Economics 41 (3): 457–478. doi: 10.1016/S0921-8009(02)00094-0
- Pelleg, D., and A. W. Moore. 2000. “X-means: Extending k-means with Efficient Estimation of the Number of Clusters.” Proceedings of the International Machine Learning Conference (ICML), Stanford, CA, June 29.
- Schwartz, C. 2000. “Digital Libraries: An Overview.” The Journal of Academic Librarianship 26 (6): 385–393. Amsterdam: Elsevier. doi:10.1016/S0099-1333(00)001592
- Sorvari, S., and M. Brus. 2012. “ENVRI – Overcoming the Environmental Challenges with Common Solutions.” In EPOS newsletter. February.
- Trumpy, E., R. Bertani, A. Manzella, and M. Sander. 2015. “The Web-oriented Framework of the World Geothermal Production Database: A Business Intelligence Platform for Wide Data Distribution and Analysis.” Renewable Energy 74: 379–389. doi: 10.1016/j.renene.2014.08.036
- Vretanos, P. 2005. “Web Feature Service Implementation Specification.” Open Geospatial Consortium Specification 04-094. http://www.opengeospatial.org/standards/wfs.
- Wikipedia. 2015. “Data Infrastructure Page.” http://en.wikipedia.org/wiki/Data_infrastructure.
- Zoppi, F., D. Castelli, and T. Simon. 2010. “Open Knowledge on e-Infrastructures: The BELIEF Project Digital Library.” Proceedings of the IST-Africa 2010 Conference, Durban, South Africa, May 19–21.